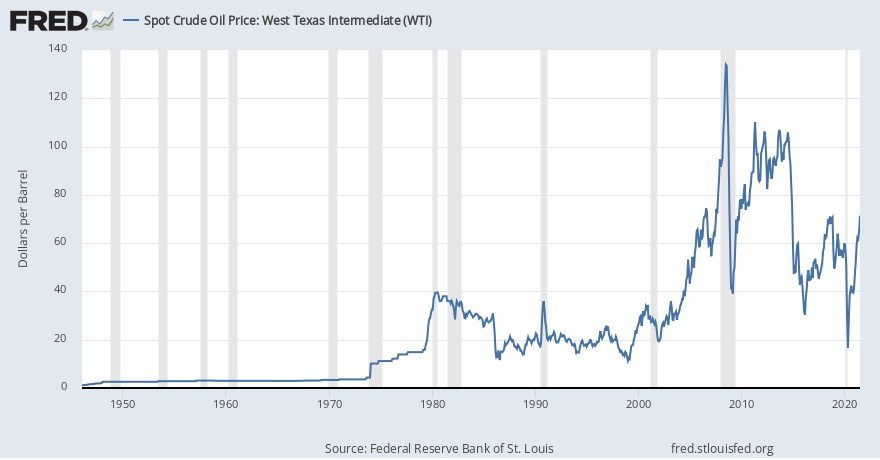
The trend of international oil prices affects the nerves of global investors. The recent 2014 peak was more than US$100 per barrel, while this year’s drop was less than US$30 per barrel. How is international crude oil priced? Does the current crude oil (energy) have investment value? Noah Fortune is trying to find answers from the past 70 years of WTI & Brent crude oil price history (with graphs by month)
Historical WTI Crude oil prices: Characteristics
The historical price of WTI oil is close to being compared with the trend of Brent, another benchmark that takes the oil extracted in the North Sea as a reference. Other meaningful quotes are Dubai Crude, Oman Crude, Urals oil, and OPEC’s Reference Basket.
Over the years, the price trend has been influenced by the amount of oil deposited in Cushing (Oklahoma, United States) – WTI’s most significant trading center and delivery point for crude oil & drilling contracts.
The WTI & Brent oil history reflects the raw material’s volatility, the price’s intense sensitivity to international events on the markets, and – above all – the global supply and demand trend for crude oil.
With the collapse of recent years inaugurated in the summer of 2014 and with the return of the bull market in a big way after the historic Vienna Agreement of 2016, it has become exciting to observe the trend in the price of oil over the last few years. Decades.
Important Events That Affect Brent & WTI Crude Oil Price History
Along the two main lines of the market and the system, Noah Fortune has reviewed the trend of crude oil prices history in the past 70 years.
- After World War II ended in 1945, the rapid development of the automobile industry in the years after the war led to a considerable increase in demand for crude oil, which drove the price of crude oil to double.
- When the Korean War broke out in June 1950, the Office of Price Stabilization (Office of Price Stabilization) imposed price controls on crude oil.
- In the summer of 1951, Iran nationalized its oil industry and suffered international sanctions, greatly reducing the international supply of crude oil.
- In 1952, a strike by refiners across the United States shut down one-third of the refineries.
- By 1953, the price controls were lifted, and crude oil prices began to rise.
After 1956
- In July 1956, Egypt nationalized the Suez Canal to fully control the Suez Canal. In October, Israel invaded Egypt, and the second Middle East war broke out. The war caused a decline in crude oil production in the Middle East, but in the following months, crude oil production outside the Middle East made up for this shortfall.
- In February 1957, global crude oil production had returned to pre-war levels.
- In October 1973, the Fourth Middle East War broke out. OPEC announced an oil embargo on Israel’s supporters to combat Israel, triggering the first oil crisis. As of November, global crude oil production fell by 7.5%, and crude oil prices soared more than doubled, breaking through US$10/barrel for the first time in the history of brent & WTI crude oil prices.
- In September 1980, the Iran-Iraq War broke out. Global crude oil production fell again by 6% within a few months.
From 1980-2000
- At the beginning of 1981, the international oil price was close to US$40/barrel, and subsequent increases in output in other regions made up for the decline brought about by the Iran-Iraq War, and international crude oil prices gradually fell.
- Between 1981 and 1985, due to the decline in global oil demand, Saudi Arabia (Saudi Arabia Oil History) cut its production by three-quarters, but this did not significantly support oil prices.
- In 1986, Saudi Arabia began to resume production, and international oil prices plummeted to less than US$12/barrel at one time.
- In August 1990, Iraq’s invasion of Kuwait caused a sharp drop in crude oil production in the two countries and a short-term surge in international crude oil prices.
- In January 1991, the first Gulf War broke out and ended at the end of February. Subsequently, international oil prices fell back to pre-war levels.
- In 1997, the Asian financial crisis broke out.
- At the end of 1998, international oil prices fell below US$12/barrel to a 20-year low.
- Since 1999, Asia has gradually recovered from the financial crisis, the global economy has recovered, and a new round of growth in oil demand has driven oil prices to rise sharply.
After 2001
- On September 11, 2001, two civilian airliners hijacked by terrorists crashed into the World Trade Center One and Two in New York, USA, and another hijacked airliner crashed into the U.S. National Defense in Washington, U.S. Department of the Pentagon. This is the worst terrorist attack on the United States. Noah Fortune believes the 9/11 incident was only a short-term suppression of oil prices. After the adjustment was completed, international oil prices continued to rise.
- In November 2001, China joined the WTO for the first time in crude oil price history, and since then, ushered in a round of rapid economic growth characterized by heavy industrialization and has gradually become an important engine for the growth of world factories and global crude oil demand.
- In December 2002, a large-scale riot broke out in Venezuela, and the strike substantially reduced crude oil production.
- In March 2003, the Second Gulf War broke out, substantially reducing Iraq’s crude oil production. Although the impact of these two events on global crude oil production is relatively small, international oil prices still skyrocketed, breaking through US$50/barrel in 2004.
- Beginning in 2004, the world entered an era of prosperity with rapid economic growth. At the same time, crude oil production has not increased significantly, and crude oil prices have reached new highs.
After 2004
- On July 14, 2008, the price of crude oil futures on the New York Mercantile Exchange hit an all-time high of US$147.27 per barrel.
- In August 2005, “Hurricane Katrina” hit the United States, causing economic losses of 108 billion U.S. dollars. The hurricane shut down 30% of Gulf of Mexico oil fields, 7 refineries, and a major US crude oil export facility.
- In August 2005, the US government used the Strategic Petroleum Reserve to aid a crude oil processing plant severely damaged by Hurricane Katrina.
- In 2005, the International Energy Agency agreed to release 2 million barrels of crude oil per day for 30 days from the strategic reserves of its 26 member states to ease market tensions caused by Hurricane Katrina.
- In 2009, international crude oil prices fell sharply due to the impact of the financial crisis. On January 21, crude oil futures on the New York Mercantile Exchange fell to US$33.20, the lowest since April 2004.
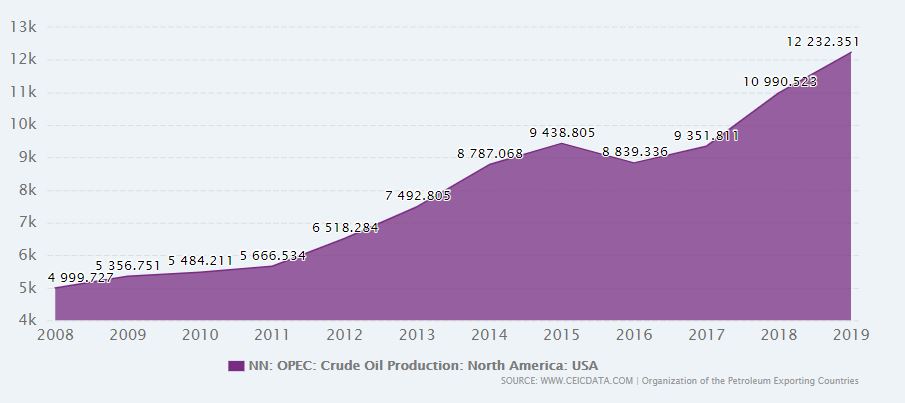
- In 2013, the U.S. shale gas revolution continued to heat up, replacing Saudi Arabia as the world’s largest oil producer. At the same time, China’s energy demand continues to increase, replacing the United States as the world’s largest net oil importer.
After 2013
- In 2014, global crude oil production continued to climb, Iran and Libya resumed crude oil exports, and the output of the United States and Iraq increased substantially. In June, OPEC decided not to take measures to reduce production, and international oil prices began to plummet, with a drop of nearly 50%.
- In December 2015, the United States lifted the 40-year ban on crude oil exports.
- In January 2016, Iran’s sanctions were officially lifted, and the ban on oil exports was lifted. Iran’s newly added 500,000 barrels/day of crude oil exports have further pressured the already oversupplied crude oil market, and international oil prices have fallen below US$30/barrel.
In addition, some overseas institutional investors represented by the Yale University Endowment Fund regard natural resources as an independent asset class to set their strategic asset allocation. The most significant proportion of natural resources is energy. Noah Fortune believes that energy prices are currently low for long-term investors, and it may be a good time to intervene in such assets.
Crude WTI Oil Price History Through Years
Historic WTI Crude Oil Price 2018 By Month
| MONTH | OPENING | MAXIMUM | MINIMUM | VAR.% |
|---|---|---|---|---|
| January 2018 | 60.20 | 66.66 | 60.10 | + 7.13% |
| February 2018 | 64.76 | 66.30 | 58.07 | -4.77% |
| March 2018 | 61.55 | 66.55 | 59.95 | + 5.35% |
| April 2018 | 64.91 | 69.56 | 61.81 | + 5.59% |
| May 2018 | 68.56 | 72.83 | 65.80 | -2.23% |
| June 2018 | 67.07 | 74.46 | 63.59 | + 10.61% |
| July 2018 | 73.62 | 75.27 | 67.03 | -7.27% |
| August 2018 | 68.43 | 70.50 | 64.43 | + 1.51% |
| September 2018 | 69.89 | 73.73 | 66.86 | + 4.94% |
| October 2018 | 73.29 | 76.90 | 64.81 | -10.84% |
| November 2018 | 64.88 | 65.39 | 49.41 | -22.02% |
| December 2018 | 52.45 | 54.55 | 42.36 | -10.84% |
Historic WTI Crude Oil Price 2017 By Month
| MONTH | OPENING | MAXIMUM | MINIMUM | VAR.% |
|---|---|---|---|---|
| January 2017 | 54.20 | 54.20 | 50.71 | -1.69% |
| February 2017 | 52.76 | 54.94 | 51.22 | + 2.27% |
| March 2017 | 53.95 | 54.44 | 54.44 | -6.31% |
| April 2017 | 50.69 | 53.76 | 48.20 | -2.51% |
| May 2017 | 49.17 | 52.00 | 43.76 | -2.05% |
| June 2017 | 48.63 | 49.17 | 42.05 | -4.72% |
| July 2017 | 46.28 | 50.41 | 43.65 | + 8.97% |
| August 2017 | 50.21 | 50.43 | 45.58 | -5.86% |
| September 2017 | 47.08 | 52.86 | 46.56 | + 9.40% |
| October 2017 | 51.64 | 54.85 | 49.10 | + 5.24% |
| November 2017 | 54.65 | 59.05 | 53.89 | + 5.55% |
| December 2017 | 57.42 | 60.51 | 55.82 | + 5.26% |
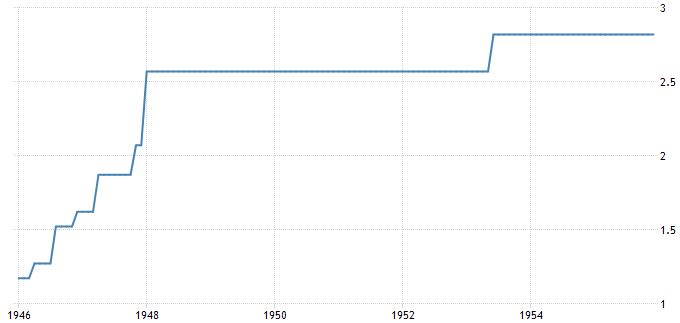
Historical from 1946 to 1955
The first historical graph of the WTI oil price includes the decade from 1946 to 1955. In these ten years, the price of oil has marked its all-time lows. In February 1946, a barrel of oil cost only $ 1.17 per barrel. Of course, the historical price of oil at the time must be related to the context in the United States. In the middle of the postwar period, at the dawn of the economic boom and, above all, of the Cold War.
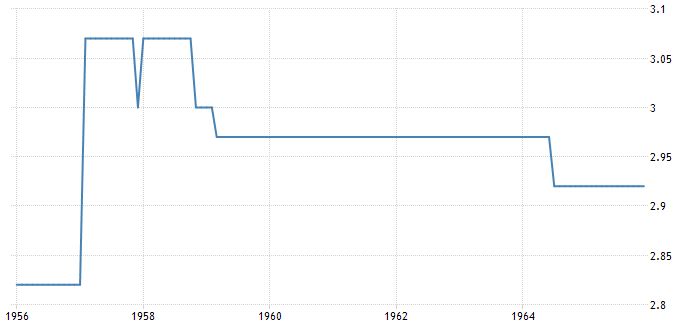
Historical from 1956 to 1965
In the history of WTI crude oil price in 1956-1965, the minimum was reached at 2.83 dollars per barrel and the maximum at 3.07.
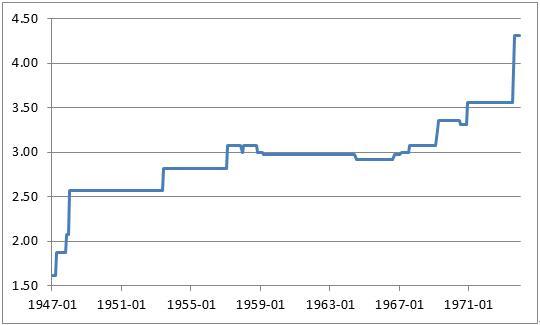
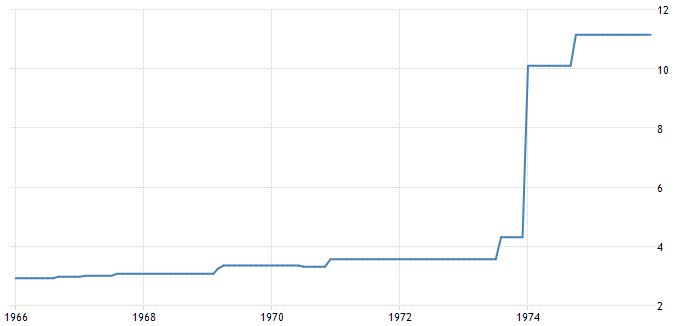
Oil price: historical from 1966 to 1975
In this ten-year historical record, the minimum oil price was 2.4 dollars; the maximum reached 11.20.
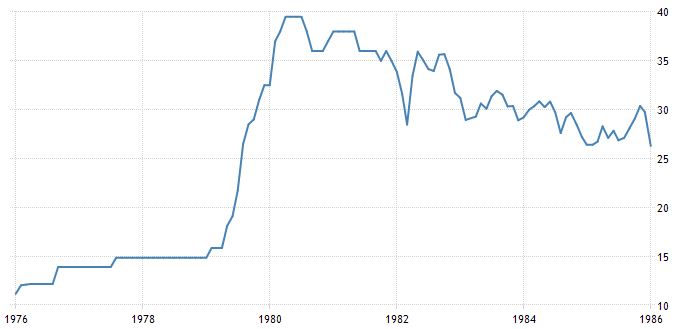
Historical from 1976 to 1985
In this decade, the price of oil began to be more volatile due to the globalization of markets and the influence of the Brent price. The price of oil exceeds $ 39.
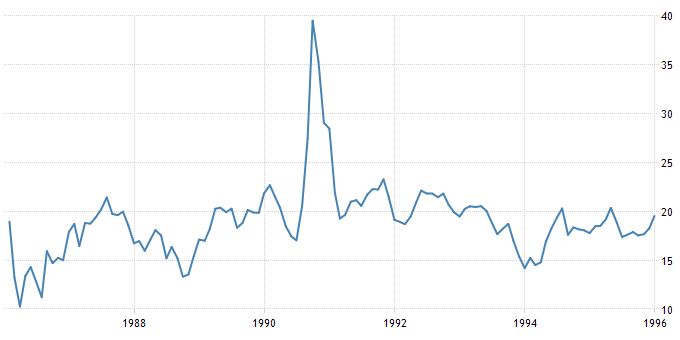
WTI Crude Oil Price History From 1986 to 1995
The decline in the price of oil that began at the end of 1985 continues. After returning to the lows of 10 dollars a barrel, the price of oil is still trying to overcome the resistance of 40 dollars a barrel – without success. 1995 ends with the inauguration of a new uptrend.
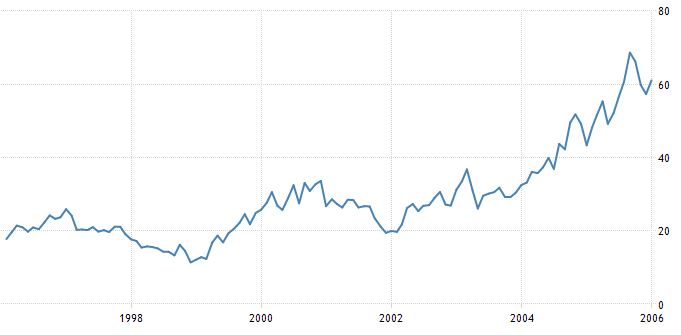
Historical from 1996 to 2005
The price of oil marks new all-time highs around $ 68 per barrel.
Historical from 2006 to 2019
After hitting all-time highs of just over 140 dollars a barrel in 2014, a new bearish phase was inaugurated that led the WTI to touch the lows of 27 dollars, last seen 13 years earlier.
Over the years, technologies have advanced, and oil extraction costs have decreased. The advance in the fracking technique, which allows conventional or directional drilling into the rock to extract crude oil, has led to the birth of the shale oil industry – which has grown dramatically in just a few years. The jump in US production meant that the United States no longer needed to buy oil from other countries to meet its domestic needs, thus triggering a bearish mechanism and an imbalance between world supply and demand.