Mechanical specific energy (MSE) is the mechanical work used to drill a unit volume of rock. It combines weight on bit, torque, rotary speed, bit area and rate of penetration into one measure of rock-cutting performance. In field units, MSE is normally expressed in psi. Its most useful application is tracking how drilling efficiency changes when operating conditions change. [1,2,3]
A high penetration rate does not tell the whole story. A bit may drill faster while consuming substantially more mechanical energy for each unit of rock removed. Conversely, a useful increase in penetration rate may occur while MSE remains approximately constant. Reading both measurements together helps distinguish greater output from better energy efficiency. [1,2,3]
What Is Mechanical Specific Energy in Drilling?
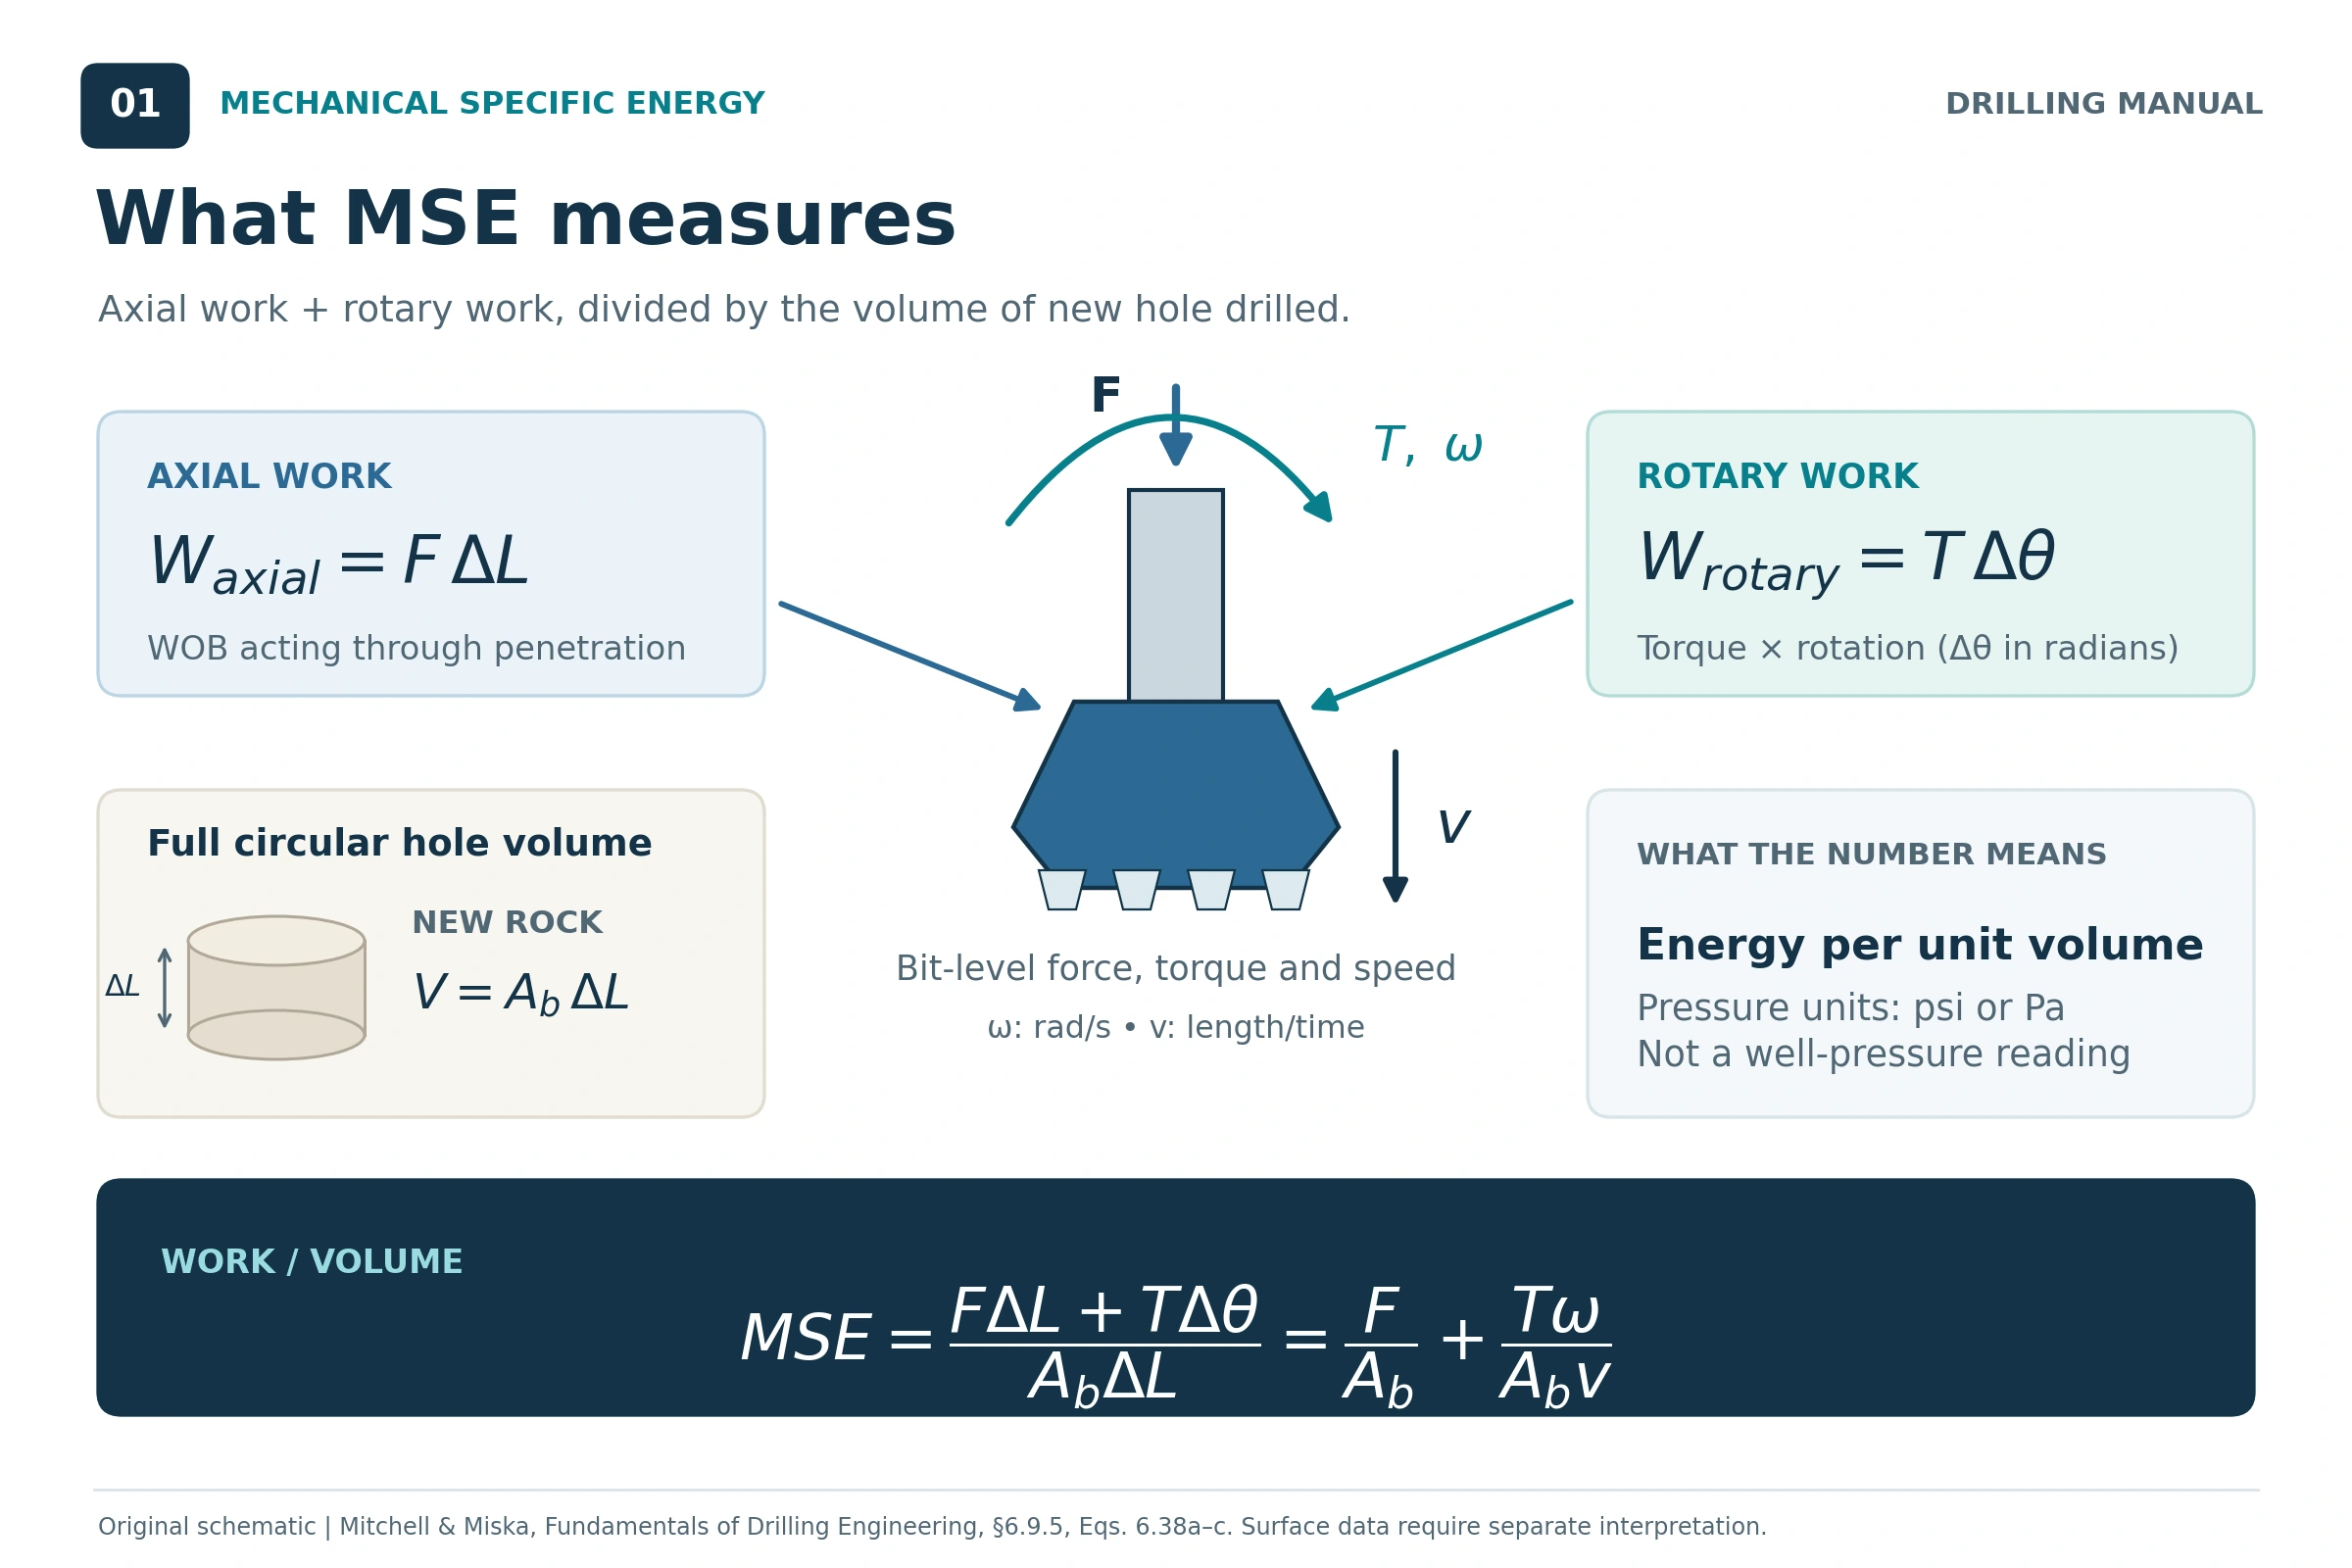
MSE answers a practical question: How much mechanical work is being used for the volume of new hole being drilled? The basic calculation combines two contributions: axial work from weight on bit and rotary work from torque acting through rotation. Dividing their combined work by the drilled rock volume gives mechanical specific energy. [2, pp. 365–366]
The units can look misleading. Although MSE is expressed in psi or MPa, it is an energy-per-volume quantity. Energy divided by volume has the same dimensions as pressure. MSE is not a measurement of bottomhole pressure, annular pressure or formation fracture pressure. This follows from the work-and-volume definition. [2]
In field interpretation, use MSE alongside rate of penetration (ROP), torque, WOB, rotary speed, formation information and available downhole measurements. The IADC manual emphasizes relative changes and the response to parameter tests, rather than treating one absolute value as a complete diagnosis. [3, BI-23–24; DP-4–5]
Mechanical Specific Energy Formula and Units
Field-Unit MSE Formula
For the full circular area cut by a drilling bit, the field-unit equation is: [1, Eq. 7.109; 2, Eq. 6.38c]
MSE = WOB / Ab + (120π × RPM × T) / (Ab × ROP)
Using Ab = πD² / 4 gives the equivalent diameter-based equation:
MSE = 4WOB / (πD²) + (480 × RPM × T) / (D² × ROP)
| Symbol | Meaning | Required unit |
|---|---|---|
| MSE | Mechanical specific energy | psi |
| WOB | Weight on bit | lbf |
| T | Torque | lbf-ft |
| RPM | Rotational speed used in the calculation | rev/min |
| ROP | Rate of penetration | ft/h |
| D | Bit diameter | in. |
| Ab | Bit cross-sectional area | in.² |
The first term is the axial contribution; the second is the rotary contribution. The constants apply to the units shown. Entering WOB in klbf, torque in thousands of lbf-ft, or ROP in ft/min without conversion gives an incorrect result. These unit checks follow directly from the equation. [2]
The bit area is the circular area associated with the hole cut by the bit. It is not the annular area around the drillpipe or the combined face area of the cutters. The measurement location of torque and WOB must also be understood before interpreting the result as bit efficiency. [2,3]
MSE in SI Units
The same work balance can be written in coherent SI units: [2, Eq. 6.38b]
MSE = F / A + Tω / (Av)
Use axial force F in N, area A in m², torque T in N·m, angular speed ω in rad/s and penetration speed v in m/s. The result is Pa; divide by 1,000,000 to express it in MPa. Angular speed is ω = 2π × RPM / 60. This is a unit-consistent expression of the book’s work balance, not a different drilling model. [2; dimensional conversion]
Mechanical Specific Energy Calculation Example
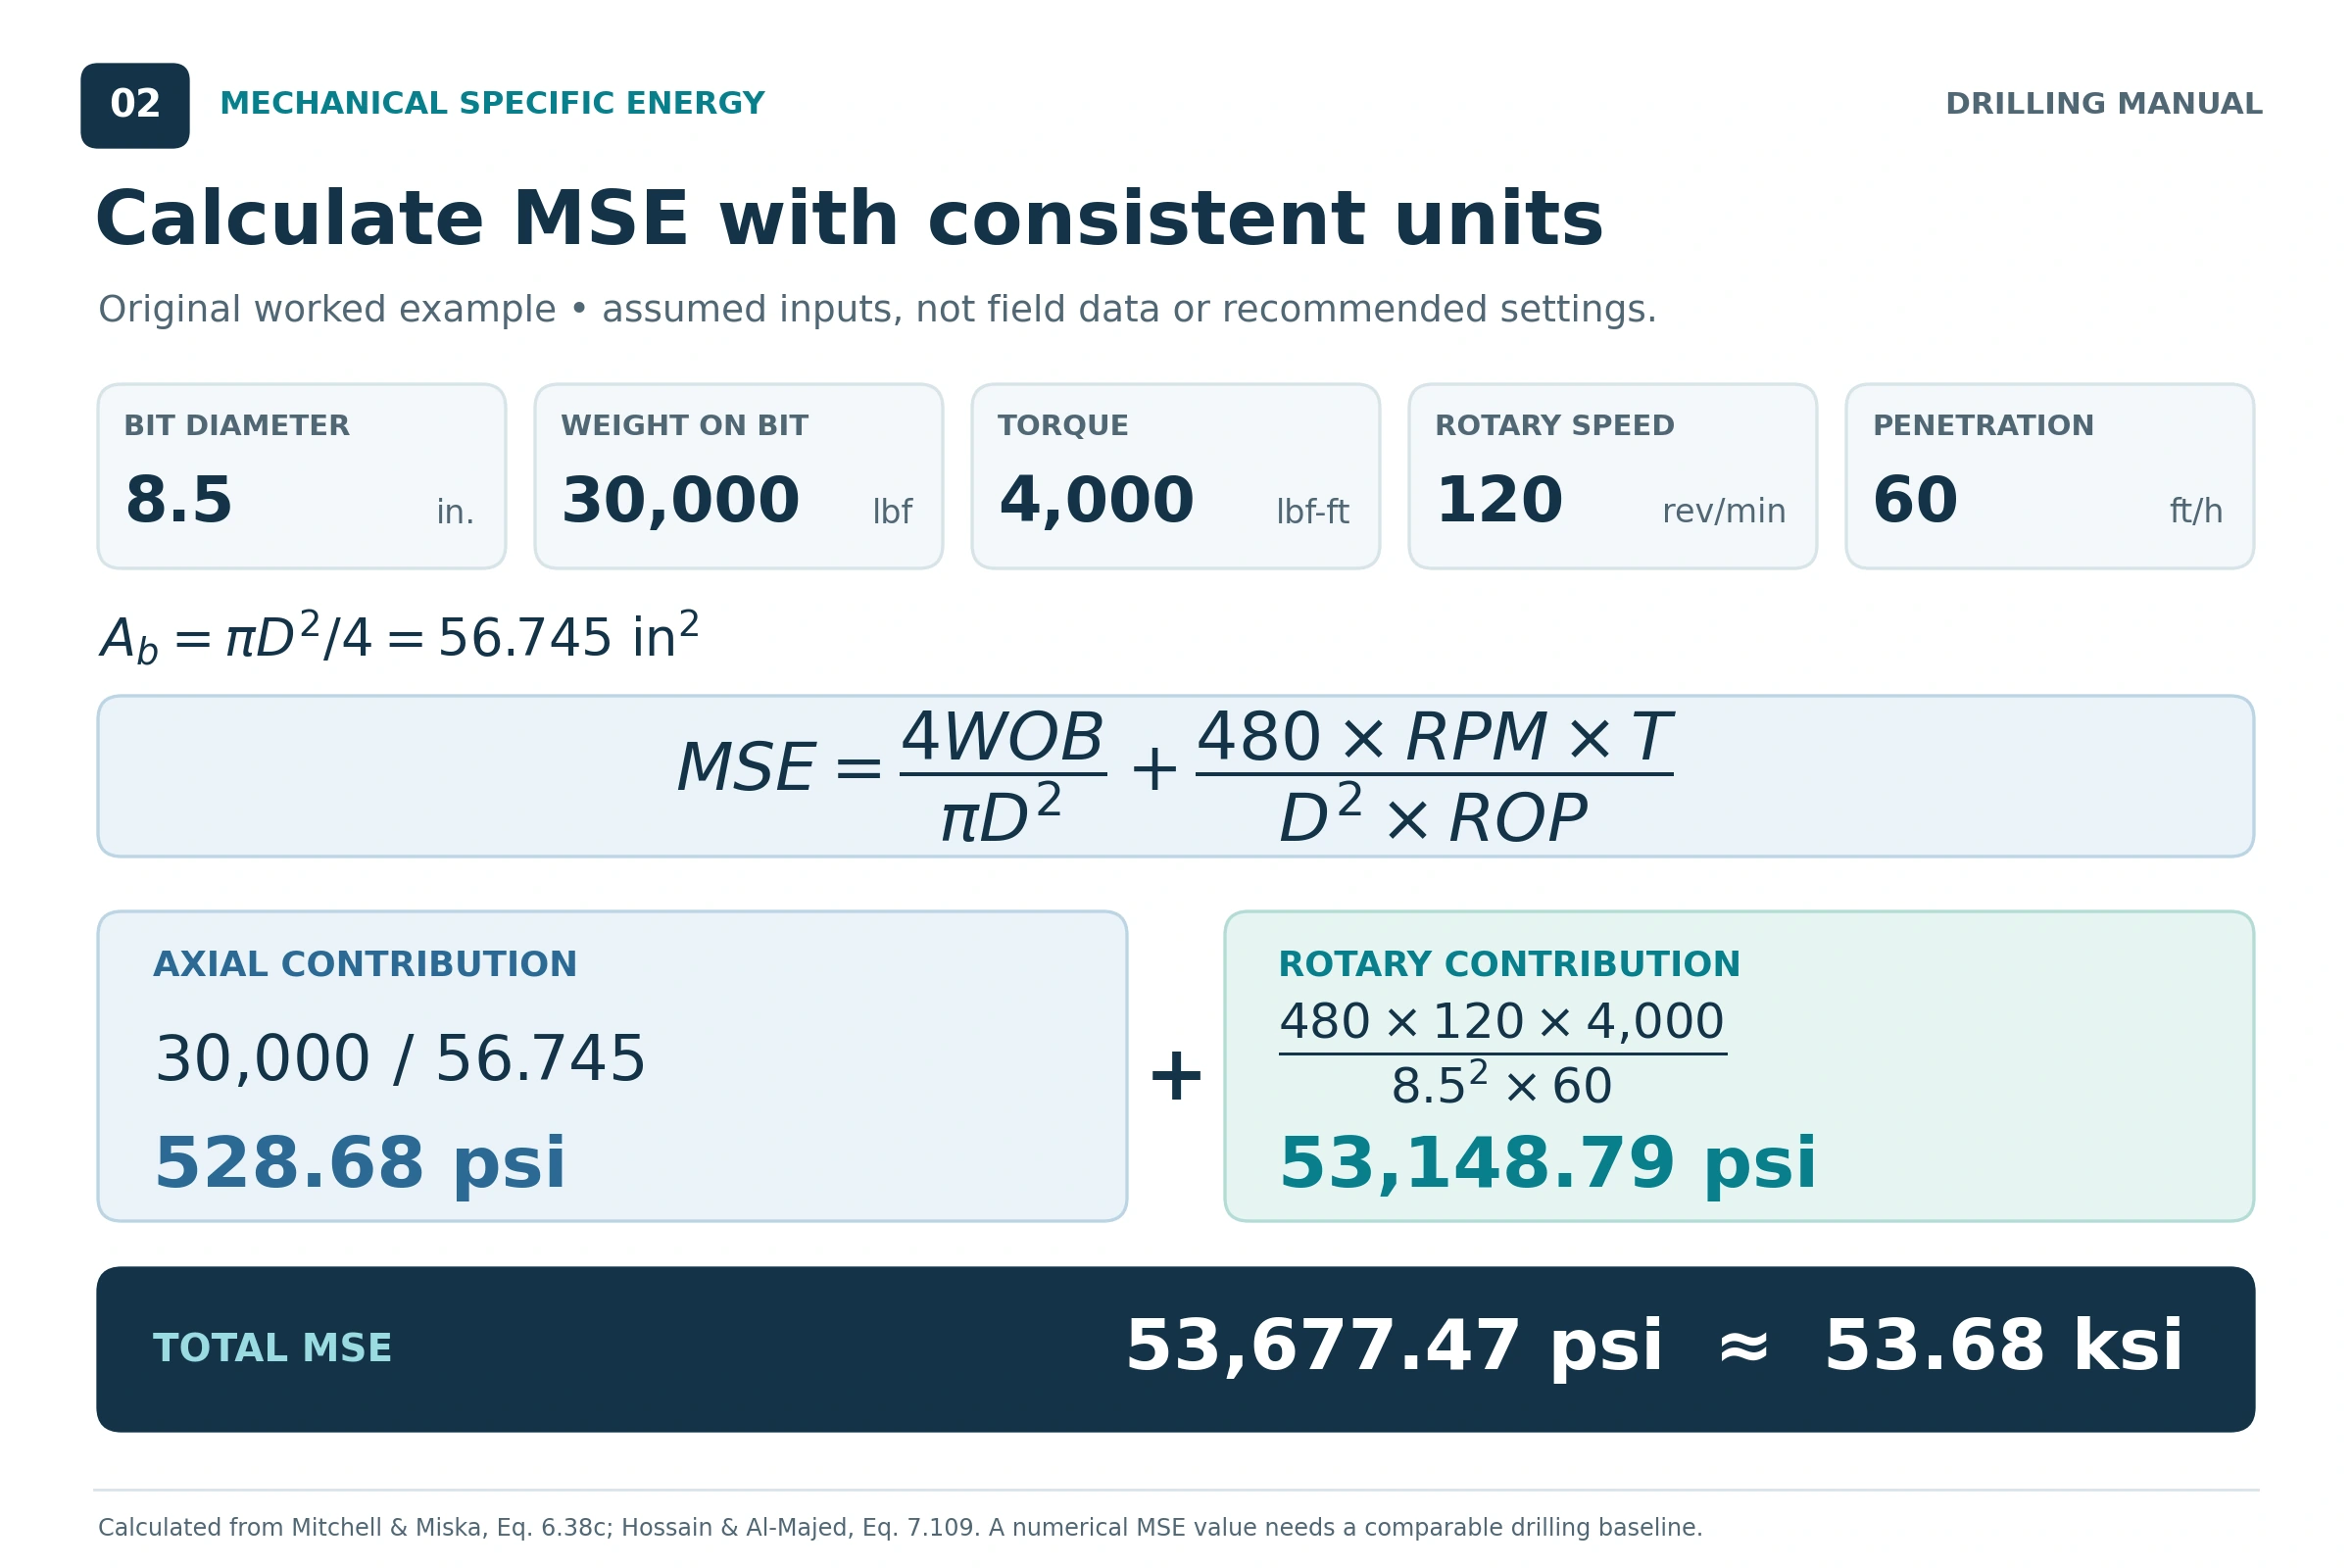
Illustrative calculation: the following inputs are assumed for teaching the verified equation. They are not reported field data, book test results or recommended operating settings.
| Input | Assumed value |
|---|---|
| Bit diameter | 8.5 in. |
| WOB | 30,000 lbf |
| Torque | 4,000 lbf-ft |
| Rotary speed | 120 rev/min |
| ROP | 60 ft/h |
1. Calculate the Bit Area
Ab = π × 8.5² / 4 = 56.745 in.²
2. Calculate the Axial Contribution
MSEaxial = 30,000 / 56.745 = 528.68 psi
3. Calculate the Rotary Contribution
MSErotary = (480 × 120 × 4,000) / (8.5² × 60) = 53,148.79 psi
4. Add Both Contributions
MSE = 528.68 + 53,148.79 = 53,677.47 psi, or approximately 53.68 ksi.
The rotary term dominates this particular example. That is a result of the assumed inputs, not a rule that the axial term should always be discarded. The calculated value alone also cannot establish whether drilling is efficient; it needs a comparable baseline and an understanding of the formation and measurement sources. [2,3]
5. Compare the Response to a Parameter Change
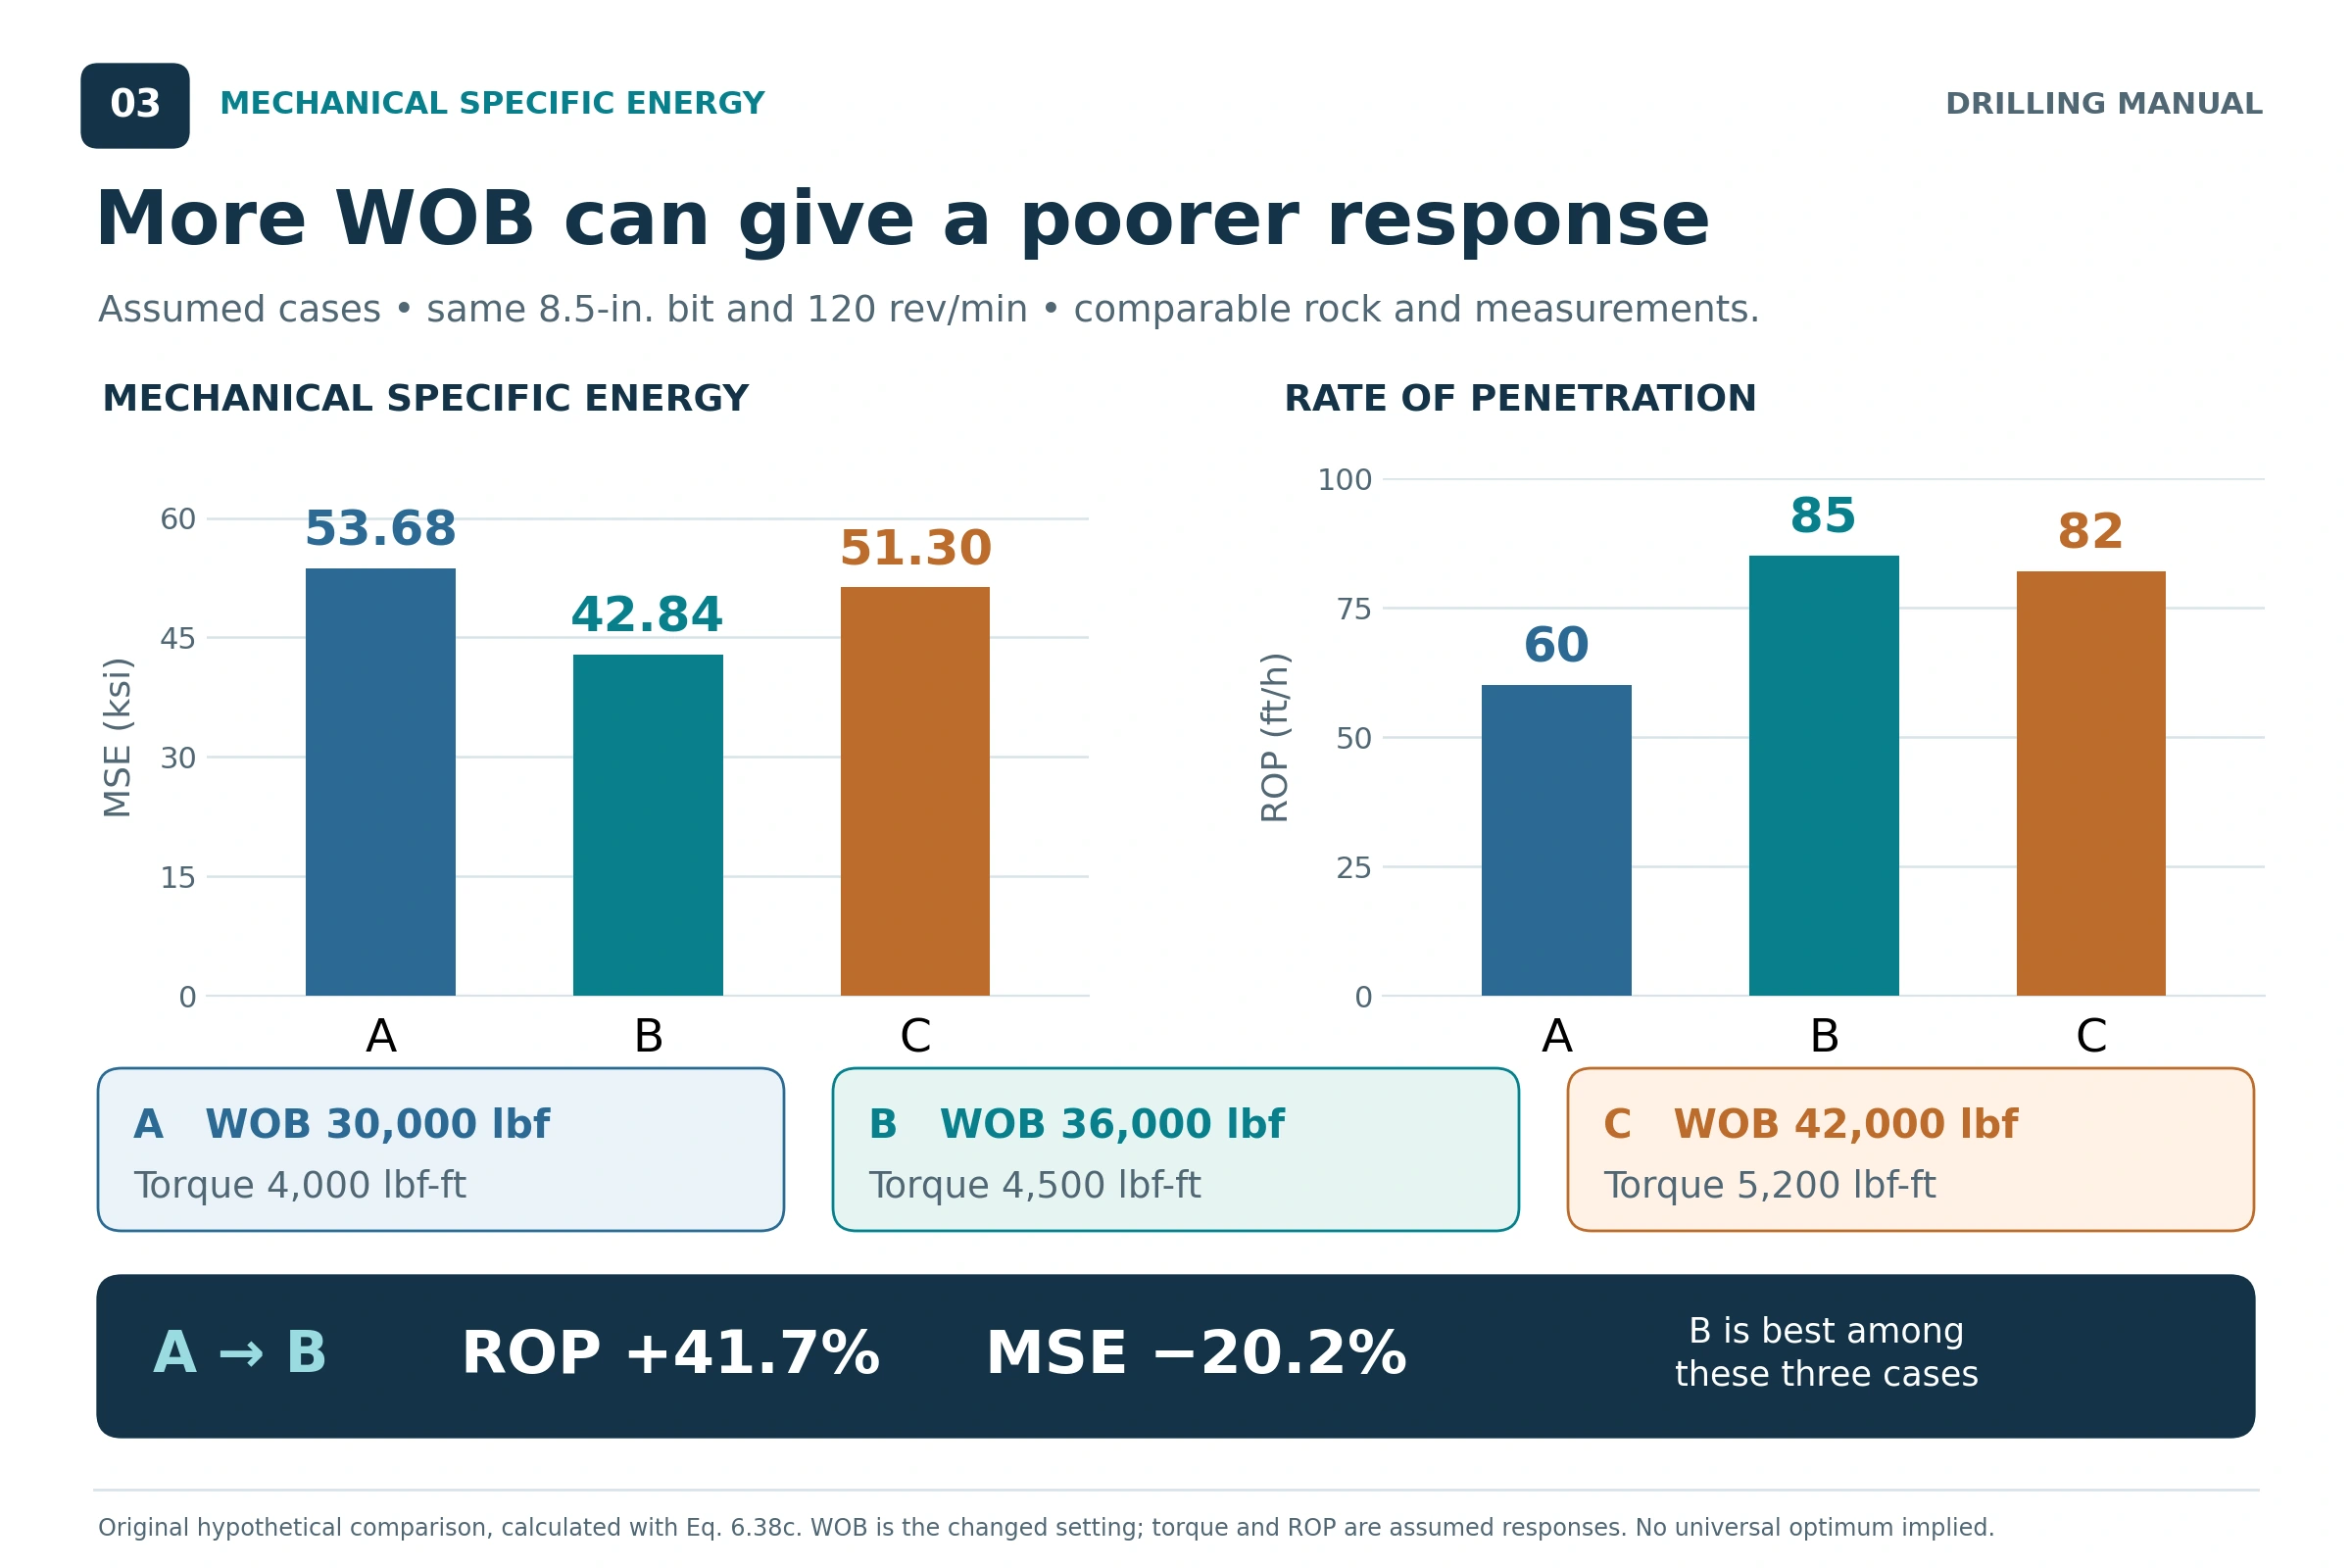
Now consider three hypothetical intervals with the same 8.5-in. bit and 120 rev/ min. WOB is the deliberately changed setting; torque and ROP are assumed responses. For this teaching comparison, assume comparable rock, consistent measurements and stable drilling within each interval.
| Interval | WOB, lbf | Torque, lbf-ft | ROP, ft/h | MSE, psi |
|---|---|---|---|---|
| A | 30,000 | 4,000 | 60 | 53,677 |
| B | 36,000 | 4,500 | 85 | 42,841 |
| C | 42,000 | 5,200 | 82 | 51,296 |
From A to B, ROP increases by approximately 41.7% while MSE decreases by approximately 20.2%. Although WOB and torque are higher, more rock is removed for each unit of mechanical work.
From B to C, more WOB and torque accompany a lower ROP and higher MSE. The additional input is producing a poorer cutting response. This calculation does not identify the cause: cleaning problems, vibration, bit condition and formation changes would need to be evaluated using actual measurements. [3, DP-4–5]
Interval B has the best combination of ROP and MSE among these three assumed cases. It does not establish a universal optimum or prove that every other operating constraint is satisfied.
Applications of Mechanical Specific Energy
Evaluate Drilling-Parameter Changes
MSE gives the drilling team a way to evaluate whether changes in drilling parameters improve the conversion of mechanical work into new hole. Plotting it alongside WOB, RPM, torque and ROP helps reveal whether additional input produces a proportionate penetration response. [1, pp. 376, 409–410; 3, DP-4–5]
At comparable conditions, falling MSE after a controlled change indicates better cutting efficiency. Approximately unchanged MSE with increasing ROP can also be useful: the bit is producing more hole while using similar energy per unit volume. Rising MSE indicates that more work is being used for each unit of rock removed. [1,3]
Identify the Onset of Founder
Founder describes a loss of the expected penetration response as mechanical input is increased. More WOB may produce only a small ROP improvement, no improvement, or even a reduction. The books associate this behavior with mechanisms including poor cleaning, balling and vibration. [1, pp. 409–410; 2, p. 355; 3, DP-3–5]
MSE helps make the efficiency loss visible. It is particularly useful when the team compares the response before and after a controlled parameter change. The operating limit identified in one interval is specific to that drilling system and formation; a change in bit condition, hydraulics or rock can change the response. [1,2,3]
Evaluate Bit-Cleaning Performance
Poor cleaning can prevent the cutting structure from effectively engaging fresh rock. Bit balling is one example. MSE surveillance can help evaluate whether a change in cleaning effectiveness improves rock-cutting performance. The IADC manual describes this application using a case in which a nozzle change improved the MSE response in an interval affected by balling. [3, DP-4–7]
The basic MSE equation contains no separate hydraulic-power term. Hydraulics still influence its result because cleaning changes torque, penetration and the effectiveness of the mechanical work. Hossain and Al-Majed discuss a separate drilling-specific-energy formulation that includes a hydraulic contribution; it should not be confused with the basic mechanical equation used here. [1, p. 410]
Support Bit-Condition Assessment
A progressive loss of penetration performance accompanied by rising MSE can contribute to an assessment of cutter wear or damage. However, the same broad trend can have other explanations. The IADC manual notes that a worn PDC cutting structure may show decreasing torque and ROP while MSE increases. Torque does not have to rise for MSE to rise. [3, BI-25]
Use the trend with formation interpretation, parameter response and other drilling observations. After the run, bit dull grading provides evidence of actual cutter condition and helps assess the interpretation made while drilling. MSE alone is not a sufficient basis for a bit-pull decision. [2, §6.9.6; 3, BI-25]
Build Better References for Subsequent Wells
Recorded MSE, drilling parameters and formation information can support comparisons of bit and BHA performance in similar intervals. Hossain and Al-Majed describe using drilling records and lessons learned to improve the choice of equipment and operating parameters for subsequent wells. Comparisons should retain the bit size, formation, operating mode and data source so that unlike conditions are not treated as equivalent. [1, p. 376; 3, BI-24; DP-10]
Factors Affecting Mechanical Specific Energy
The equation identifies the direct numerical inputs. The drilling process determines how those inputs interact. For example, increasing WOB raises the axial term if everything else stays fixed, but real drilling may also produce changes in torque and ROP that reduce the total MSE. [2; interpretation of Eq. 6.38c]
| Factor | Effect on the MSE response | Interpretation point |
|---|---|---|
| Formation strength and lithology | Different rocks require different work to remove a unit volume. | Compare similar formations before attributing a change to operating efficiency. [1,3] |
| WOB and cutter engagement | WOB changes axial work and can change torque, depth of cut and ROP. | Higher WOB does not automatically mean higher total MSE. [1,2,3] |
| Rotary speed | RPM enters the rotary term directly and influences penetration and vibration response. | Evaluate the combined torque–RPM–ROP response. [2,3] |
| Bit type, design and condition | Cutting structure, suitability for the formation and wear affect the work needed to drill. | Different bit designs or wear states need context when compared. [2,3] |
| Bit cleaning and hydraulics | Cuttings removal affects cutter engagement and the penetration obtained from mechanical input. | A hydraulic change can affect MSE without appearing as its own term in the basic equation. [1,2,3] |
| Drilling-fluid properties and overbalance | Fluid properties and pressure conditions affect rock removal, cleaning and penetration response. | Do not attribute every MSE change to WOB or RPM. [1, p. 402; 2, pp. 353–355] |
| Vibration and BHA behavior | Whirl, stick-slip and axial vibration can reduce useful cutting performance. | The MSE trend does not quantify every vibration mode or its severity. [3] |
| Measurement quality and location | Measured or estimated WOB, torque, RPM and ROP determine the calculated result. | Understand the channels, units and surface-versus-downhole basis. [2,3] |
Bit diameter also appears in the calculation through area. Keeping all other numbers unchanged while changing diameter changes the computed MSE. That mathematical normalization does not make two different hole sections directly comparable: their formations, bits, hydraulics and operating conditions may also differ. [2; equation-based interpretation]
Surface MSE Versus Downhole MSE
The location of the measurements determines what the calculated energy represents. The IADC manual favors measurements close to the bit when the purpose is to understand the energy available for rock cutting. Measurements at several positions in the BHA can improve understanding of where energy is being used. [3, BI-23–24]
Surface-derived MSE remains useful as a trend, but surface readings should not automatically be treated as equivalent to near-bit measurements. The manual calls for particular caution when a downhole motor is present and recommends considering surface and downhole data together where available. [3, BI-24]
In rotary drilling with a motor, bit speed includes the contribution from the motor as well as surface rotation. Simply combining total bit RPM with an unexamined surface-torque reading does not establish a valid near-bit mechanical-power measurement. The torque and speed basis must be consistent with the intended calculation. [3, BI-24; interpretation of the power balance in 2]
Can MSE Be Calculated Without Reliable Bit Torque?
Mitchell and Miska describe a modified formulation that estimates torque using a bit-specific sliding-friction coefficient, μ. Their field-unit relationship is T = μDWOB / 36, which leads to: [2, p. 366]
MSEmodified = WOB × [1/Ab + (13.33μ × RPM)/(D × ROP)]
This provides an estimate when reliable bit-torque measurements are unavailable, but it introduces an additional model assumption. The coefficient is bit-specific. An arbitrary coefficient should not be presented as a universal default, and estimated-torque MSE should be identified as such when comparing results. [2; interpretation of the stated model]
MSE, Rock Strength and Drilling Efficiency
The references connect the energy needed to destroy rock with its compressive strength. Hossain and Al-Majed discuss using known confined rock strength as a reference for efficiency. This can be helpful, but a numerical comparison requires a defined rock-strength basis and an understood measurement system. [1, pp. 402, 409–410]
Unconfined compressive strength (UCS) and confined compressive strength (CCS) should not be treated as interchangeable labels. Pressure and lithology affect the strength reference. State which reference is being used, and avoid turning a surface-derived MSE value into a direct measurement of formation strength or a precise percentage efficiency. [1, p. 402; 3, BI-24]
For routine field comparison, the IADC manual explains that useful MSE surveillance does not require knowing the exact rock strength. The response to a controlled change can show whether cutting performance is improving within comparable conditions. [3, DP-4–5]
Practical MSE Rules of Thumb
These are qualitative interpretation rules drawn from the books and the equation. They are not universal operating limits.
- Follow the trend before judging the number. A local comparison in similar rock is generally more useful than a single isolated MSE value. [3, BI-24]
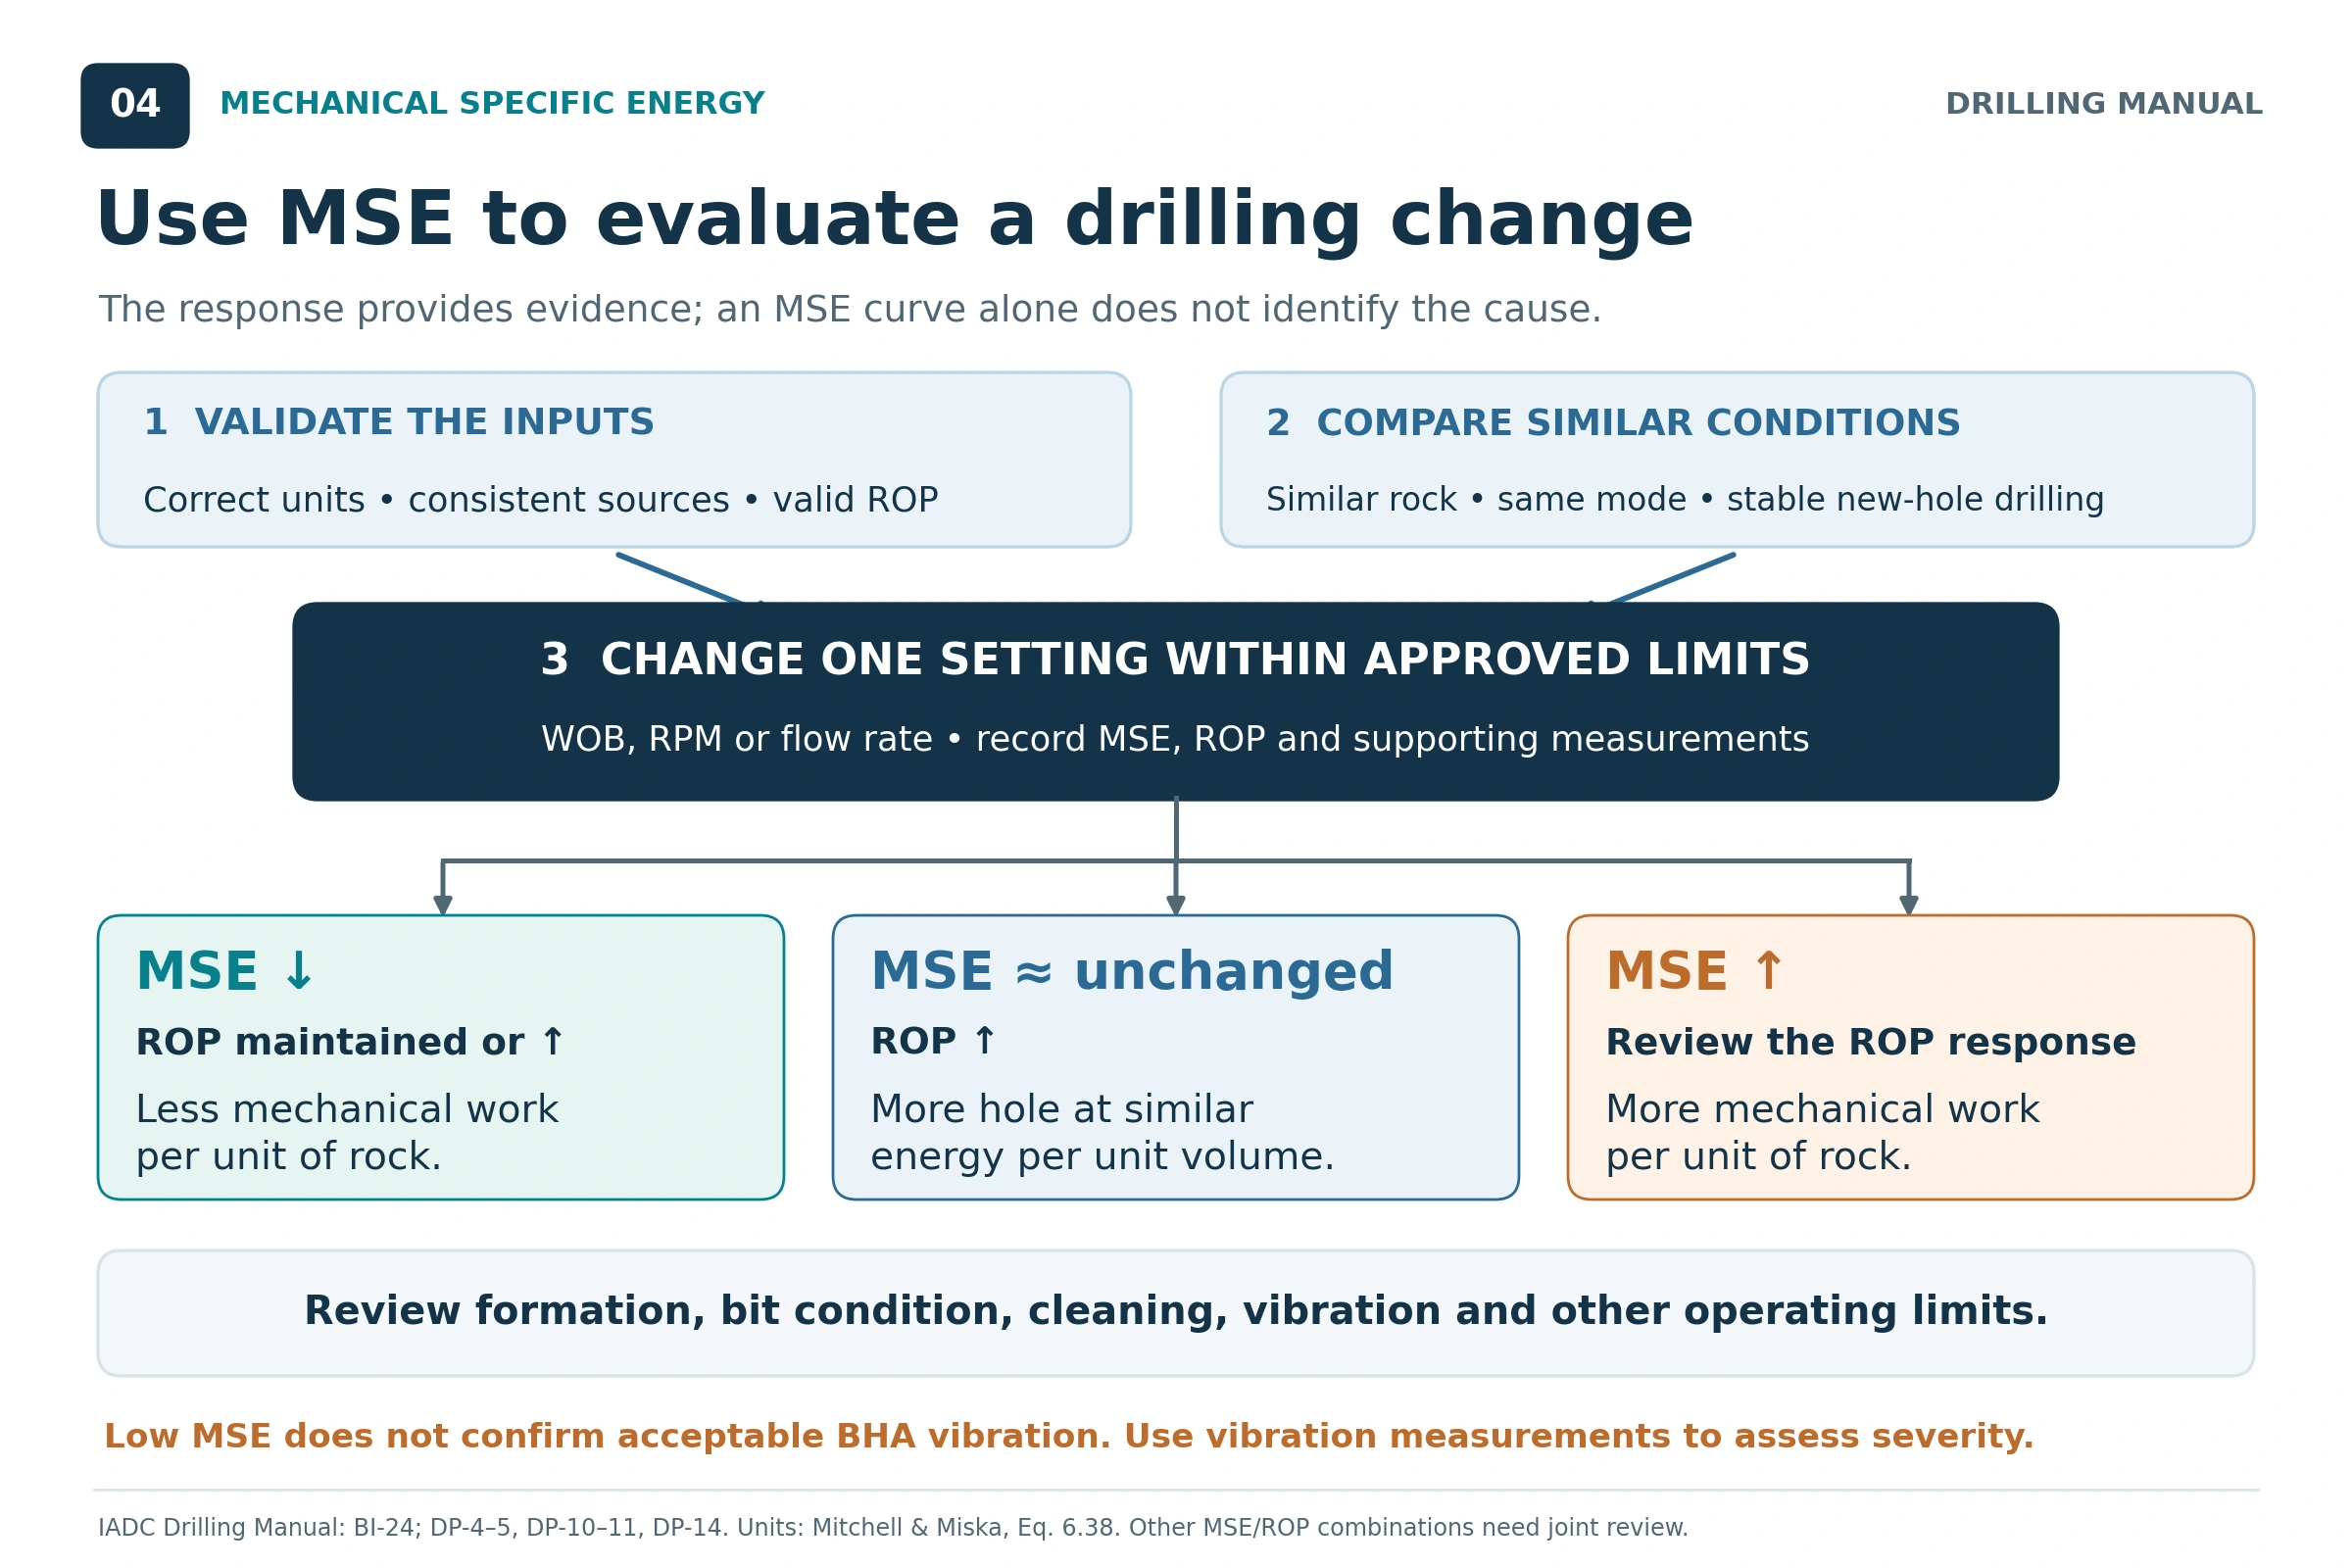
- Change one operating parameter at a time. A controlled WOB, RPM or flow-rate change makes the response easier to interpret. Changing several settings together obscures the cause. [3, DP-5]
- Compare similar formation intervals. A fall in MSE after entering softer rock does not prove that a parameter change improved efficiency. [3, DP-10]
- Read MSE and ROP together. Increasing ROP at similar MSE can be a useful improvement; falling MSE can indicate improved cutting efficiency. An absolute minimum is not the only meaningful result. [1,3]
- Do not keep adding input when the penetration response deteriorates. Additional WOB or RPM may move the system into founder. Investigate the limiting mechanism and remain within the approved operating envelope. [2, p. 355; 3, DP-3–5]
- High MSE does not prescribe one correction. More WOB can improve cutter engagement in some vibration conditions and worsen other dysfunctions. Use the response and supporting evidence to choose the next test. [3, DP-5, DP-10–11]
- Keep the measurement basis consistent. A comparison becomes unreliable if one interval uses measured bit torque and another uses an unrecorded estimate or different speed basis. [2,3; measurement-based inference]
- Separate cutting efficiency from BHA condition. Low MSE does not establish that vibration levels are acceptable throughout the assembly. [3, DP-11, DP-14]
A useful mathematical check follows directly from the formula: if ROP doubles while torque, RPM, WOB and bit area remain fixed, the rotary MSE term halves; the axial term stays unchanged. Therefore, it is not exactly correct to say that total MSE always halves when ROP doubles. [2; algebraic derivation]
Limitations of Mechanical Specific Energy
MSE Does Not Identify a Unique Root Cause
Rising MSE can accompany balling, worn cutters, unsuitable operating conditions, harder rock or vibration. A curve alone cannot reliably separate these possibilities. The IADC manual emphasizes the response to controlled tests and the need for other observations. Stick-slip vibrations, for example, require interpretation of torsional behavior as well as cutting performance. [3, BI-24; DP-5, DP-11–12]
Low MSE Does Not Prove That BHA Vibration Is Acceptable
The bit can cut efficiently while whirl remains present farther up the BHA. The manual explicitly states that MSE cannot determine the exact magnitude of BHA whirl and that downhole vibration measurements are needed to assess whether it is damaging. Keep drill string vibrations under separate evaluation. [3, DP-11, DP-14]
Zero or Very Low ROP Creates a Calculation Problem
ROP appears in the denominator of the rotary term. At zero ROP, the drilling MSE calculation is undefined because no new rock volume is being removed. With positive rotary power, the calculated value becomes very large as ROP approaches zero. This is a mathematical limitation, not automatic evidence of a particular downhole failure. [2; derivation from Eq. 6.38]
Connections, off-bottom rotation and stationary periods should therefore not be interpreted as ordinary new-hole MSE data. Reaming an existing hole also does not necessarily remove the full circular volume assumed by this calculation. Keep operating states distinct when preparing the trend. [2; application of the drilled-volume definition]
MSE Does Not Measure Every Drilling Constraint
Efficient rock cutting does not establish that the generated cuttings can be transported out of the hole. Hole cleaning, solids handling and directional-control requirements can limit an otherwise efficient drilling system. Those limits remain relevant even when MSE is low. [3, DP-10–11]
Basic MSE also excludes a separate hydraulic-energy term and does not include trip time, bit price or all non-drilling time. Minimum MSE alone therefore does not establish minimum drilling cost per foot. A complete performance evaluation needs both cutting behavior and the economics of the run. [1, p. 410; 2, §§6.9.3–6.9.6]
The Result Is Only as Reliable as the Inputs
Incorrect units, uncertain torque estimates, poorly calibrated measurements or inconsistent observation intervals can distort MSE. Use WOB, torque, RPM and ROP representing the same drilling condition. This follows from the common work-and-volume interval in the derivation and the books’ emphasis on understanding data sources. [1, p. 376; 2, Eq. 6.38; 3, BI-23–24]
A Practical Workflow for Using MSE
Within the approved well, equipment and operating limits, the following workflow translates the reference guidance into a repeatable evaluation. [3, BI-23–24; DP-4–5, DP-10–11]
- Define the calculation. Record the equation, units, bit diameter, torque source, WOB source and speed basis.
- Establish a comparable baseline. Select stable new-hole drilling data and identify the formation and operating mode.
- Display the supporting channels. Review MSE with ROP, WOB, RPM, torque, flow rate, standpipe pressure and available vibration data.
- Make one controlled change. Choose a test appropriate to the suspected limitation and the approved operating envelope.
- Compare the response in similar rock. Evaluate both energy per volume and the penetration obtained; check whether other limits or damaging behavior are emerging.
- Record what changed and what was observed. Preserve the result for subsequent decisions and future comparisons. Reassess the baseline when the formation, bit condition or drilling system changes.
The objective is to find productive, sustainable cutting performance within the well’s constraints. MSE supplies one part of that decision by showing how mechanical work relates to the volume of rock removed. [1,2,3]
Frequently Asked Questions
What Is a Good MSE Value?
There is no single value that establishes efficient drilling for every formation, bit and measurement system. Use a comparable local baseline, the response to controlled changes and an appropriate strength reference where available. The IADC manual recommends interpreting MSE primarily as a trend. [3, BI-24; DP-4]
Does Increasing WOB Reduce MSE?
It can, if the resulting increase in useful penetration outweighs the increase in mechanical work. It can also increase MSE when additional load worsens dysfunction. WOB alone does not determine the outcome because torque and ROP also respond. [1,2,3]
Can MSE Increase While Torque Decreases?
Yes. If ROP falls sufficiently, the ratio of rotary work to drilled volume can rise even as torque falls. The IADC manual describes this pattern as one possible response of a worn PDC cutting structure. It is not unique proof of wear. [3, BI-25]
Is MSE the Same as Drilling Efficiency?
MSE is an energy-per-volume measurement used to assess cutting performance. It is not automatically a percentage efficiency, a complete vibration assessment or a complete measure of well economics. Its value comes from interpreting it with the formation, data quality and response of the drilling system. [1,2,3]
References
The technical discussion and equations are based on the drilling books and manuals listed below. Worked-example inputs are explicitly assumed; their results and unit conversions are derived from the referenced equations.
- Hossain, M. Enamul, and Abdulaziz Abdullah Al-Majed. Fundamentals of Sustainable Drilling Engineering. Scrivener Publishing / John Wiley & Sons, 2015. Chapter 7, printed pp. 376, 402 and 409–410; particularly Eq. 7.109.
- Mitchell, Robert F., and Stefan Z. Miska. Fundamentals of Drilling Engineering. SPE Textbook Series, Vol. 12, Society of Petroleum Engineers, 2011. Chapter 6, §§6.8.1 and 6.9.3–6.9.6, printed pp. 352–355 and 365–366; Eqs. 6.38a–d.
- International Association of Drilling Contractors. IADC Drilling Manual, 12th edition. “Bits,” printed pp. BI-23–BI-25; “Drilling Practices,” printed pp. DP-3–DP-7 and DP-10–DP-14.