A cement bond log (CBL) measures the amplitude or attenuation of waves propagating axially along with a casing. The attenuation of the wave depends upon the materials on both sides of the casing: mud inside the casing and cement in the annular space. The effect is more pronounced on the casing-cement interface than on the mud-casing interface. The amplitude of the first arrival wave at the receiver indicates the presence of cement around the casing. A low amplitude indicates cement, and a high amplitude indicates free pipe. This log indicates the compressive strength and cement distribution around the casing.
Cement Bond Index
The distribution of cement around the casing is reported by the bond index. The index correlates the amplitude of the casing arrival time to the relative degree of cement bond to the casing. Simply, it gives the % of the pipe circumference cemented. The bond index is given by
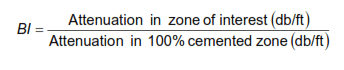

where attenuations Am and Ac are
where “d” is the distance between the transmitter and receiver on the tool. The bond index when combined with the height of the cement zone can give an indication of success of zonal isolation. Pilkington reported the amount of footage required for vertical isolation was
- 5 ft of cement of 80% bond index for a 5 in. OD casing and
- 15 ft of 80% bond index for 9⅝ in. OD casing.
- The height values for a 60% bond index will be slightly higher.
Cement Bond Logging Response
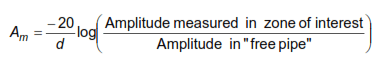
Few responses of cement bond logging from a tool having an axial transmitter and a receiver are shown in Figure 1.
Free Pipe
Figure 1 (a) shows the response in a free pipe i.e. a casing that is not cemented. The first arrival in the response is the casing travel time which is the sum of the travel time in the mud between the tool and the casing, and the travel time in the casing between the transmitter and the receiver. Since the casing is free, the waveform has high amplitude and lasts a long time or takes longer to attenuate. In a free pipe, the energy from the sonic wave is confined to mud and the casing.
Good Cement Bond Log With Casing & Hole Formation
Figure 1 (b) shows the response when cement bonds well with both casing and formation. The wave shows the very little signal at the casing arrival time and very small amplitude in the cement. The only distinct response is the formation arrival time. Most of the wave energy is transferred from the casing to the formation through cement.
High-Velocity Formation
Figure 1 (c) shows the response in a high-velocity formation. The sonic velocity in the formation is comparable to that in the casing. As a result, the signals from the formation and casing are overlapping making it difficult to evaluate cement bonding (Cement Evaluation – Cement Evaluation Tool CET).
Cement Bonded to Casing Only
Figure 1 (d) shows the response when the cement is bonded to the casing only, not to the formation. In this case, the acoustic energy is attenuated in the cement sheath. There is no acoustic coupling between the cement and formation and so, no signals is observed from the formation.
Partially Bonded Cement
Cement Bond Log Figure 1 (e) shows a partially bonded cement. The waveform signals are complicated because a part of the energy is from the free pipe and another from the bonded pipe. Similarly, moderate signals are observed from the formation arrival time. This partial bonding indicates either a channel or a micro annulus.
Since the use of the cement bond log CBL tool began, there had been several different improvements in the tool. But the physics of the measurement has remained the same. The different versions provide the amplitude in different sectors around the casing. You can check ultrasonic logging tools for more info
The main advantage of the cement bond log CBL tool is that it is little affected by borehole fluids. Hence it can be run in heavy drilling muds.
Shortcomings of the CBL Tool
The amplitude of a high-strength cement having channels may be similar to a low-strength cement with no channels. So a clear distinction in the cement evaluation may be difficult.
Microannulus
Microannulus is a small water gap created behind the casing when the pressure inside the casing is released after the cement is set. A seven-inch. 23 lbm/ft casing expands 0.004 in. when it is subjected to 1000 psi pressure. When pressure is released after cementing (Cementing in drilling), a micro annulus of 1/10 th mm thickness might be created between casing and cement sheath. A high amplitude in a cement bond log CBL response may indicate free pipe while it may actually be micro annulus. So the CBL log must be run under pressure to prevent micro annulus formation.
Thin Cement Sheath
The CBL has a poor response in the thin cement sheath. It is reported that a cement sheathless than ¾ in. will not provide complete attenuation for the acoustic signal and hence will not give correct cement evaluation. A mud cake of ¼ in. thickness in a ¾ in. annulus will cause cement attenuation to be 70% of that without the mud cake.
CBL Interpretation
The interpretation of the CBL cement bond log response with bond index requires correct knowledge of the amplitude of 100% cemented sheath and of free pipe used in the cementing operations. These amplitudes are a function of drilling mud, cement acoustic properties, casing size and thickness.
Hard Formations
In high velocity formations, hard formations, the wave from the formation may mask the cement signals. A combination of CBL with VDL Log (variable density log) might improve the problem associated with signal emanating from formation, but it will provide only qualitative measurements. This combination can not eliminate the drawback from the type of wave propagation.
Ultrasonic-CBL/VDL Tools Combination
The combination of ultrasonic and CBL/VDL tools provides much better insight into cement evaluation. These tools complement each other. When the CBL tool indicates less than perfect cement bond, additional data are needed to determine the reason for the poor cementing. This additional data is obtained with the ultrasonic tool, which identifies whether zonal isolation was achieved or not. The logs are run without wellhead pressure and with 800-1000 psi wellhead pressure to identify microcannulas
Below examples shows that the combination of ultrasonic and sonic logging tools can help to evaluate cement bond quality behind casing, assist in predicting zonal isolation, top of cement, irregular cement distribution, presence of channels.
CBL/VDL Logging For Good Cement
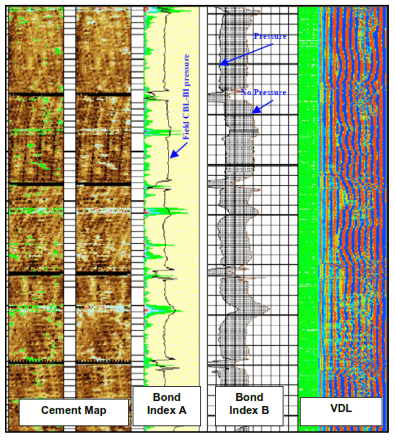
Figure 2 shows responses from the ultrasonic and CBL Cement bond log /VDL logs run in a well-cemented with a 12 lbm/gal cement. The logs were run at two wellhead pressures: zero and 2000 psi. The cement bond index at these pressures is not similar indicating the presence of microcannulas in the cement. The acoustic impedance of the cement solids is between 3-5 MRayls. The cement map from the ultrasonic tool shows dark regions with good cement and light regions having poor cement.
CBL/VDL Logging For Cement With Gas Migration
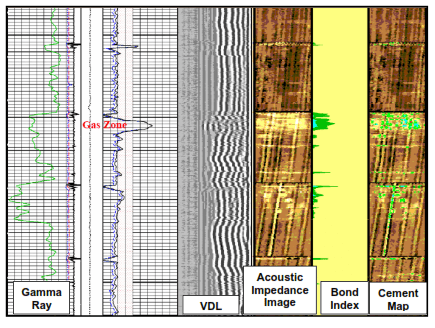
Figure 3 shows logging results from a well with 7⅝ in. 33.7 lbm/ft casing cemented with an anti-gas migration agent. The formation has a 10 ft gas cap above the oil interval. The bond index is nearly 100% except across the gas cap where there is gas migration into the cement. The ultrasonic tool shows good cementing across most of the sections except in the gas zone where there is limited gas contamination. The acoustic impedance of the cement is from 4-7 MRayl.
CBL and Ultrasonic Tools Results For Free Pipe
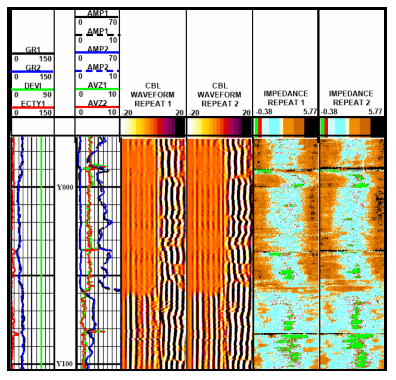
Figure 4 compares the results from CBL and ultrasonic tools. At depths below Y060 ft, the acoustic impedance is low and the CBL Cement bond log log shows high amplitude and high casing signal indicating free pipe. Thus, the cement bonding is poor below Y060 ft. At shallower depths, the acoustic impedance values are high indicating more cement above Y060 than below. Above Y060ft, the impedance map shows a channel in the center which is on the low side of the hole, whereas the cement is wrapped around the top side. The negative acoustic impedance could be caused by casing contacting the formation. The casing contact with the formation could also result in some signals returning to the CBL.
Challenges to Cement Evaluation
The cement evaluation methods should be able to describe cement properties irrespective of its density, compressive strength, or quality. The acoustic logging devices have to be carefully used for the evaluation of low density, low compressive strength cement such as foamed cement, cement with sponge-like microspheres, cement containing hydrogen for control of annulus flux, or any cement containing gas percolation. The compressive strength of the lightweight cement is low. Hence, the acoustic impedance of the lightweight cement is slightly more than that of the drilling mud. The devices should also be able to work in high mud weights and thick-walled casings used in ultra-deep sea environments. The tool parameters have to be correctly set for such challenging cement evaluations.
As environmental concerns continue to become more dominant, the use of more sophisticated cement evaluation tools will become important.
Ref : Advanced Drilling Practices Course By Petroskills