The Variable Density – VDL Log in essence is a further refinement of the conventional CBL (Cement Bond Log) by including a full waveform display, presented on the log as ‘a variable intensity’ in shades between black and white, representing maximum and minimum in amplitudes. It is used mainly in the interpretation of the cement-to-formation bond (Cementing In Drilling). You might be interested in cement evaluation & cement evaluation tool.
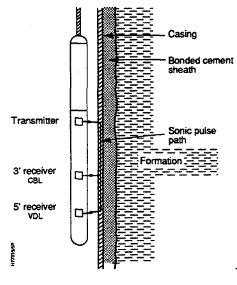
The essential parts of the CBT are an acoustic transmitter and one or two receivers spaced at 0.9 (CBL) and 1.5 m (VDL Log) below (or at 1.2 m for a single receiver configuration). Figure 1 refers. In fact, the tool is the same as used for open bore-hole compensated sonic logging (BHC).
Mechanism & VDL Log Tool Working Principle
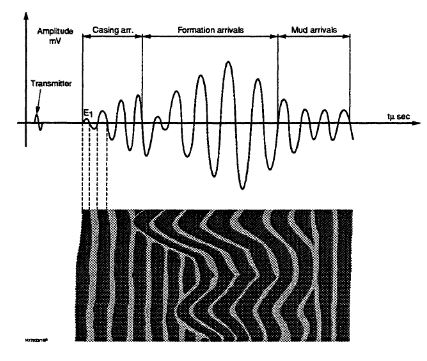
In the VDL transmitter short bursts of acoustic energy, at a frequency of 10 to 30 kHz, are generated and emitted in a spherical wave. The duration of each emission is typically 50 μs and is repeated once every 1 to 5 seconds. In between the emissions the receiver{s) pick up the refracted and direct waves, in the form of a wave train of varying amplitudes, measuring their arrival times. Part of the refracted energy travels through the casing and shows up on the VDL as the first arriving signal as the wave travels faster along casing than through the (liquid) hole contents (transit times for casing and water are 187.5 and 683 μs respectively).
Some of the acoustic energy traverses the casing and is partly refracted, partly conducted by cement and formation and arrives at the receiver{s) in accordance with their transit times. The strength of the signal from cement and formation first of all depends on the part of the energy of each pulse that is passing the interfaces casing-cement and cement-formation. A good shear coupling facilitates a high energy transfer across these interfaces. Therefore the strength of the received signal is a measure of this coupling and by extension the cement bond, taking into account the attenuation effects imposed by the media.
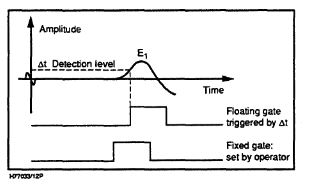
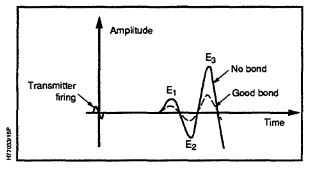
The total signal picked up by the VDL log tool receiver{s) will be rather complex, composed as it is of compressional waves from the four media (liquid, casing, cement and formation rock) and shear waves from the solid media. By using ‘gates’ (as in Figure 2) in the electronic circuitry processing the receiver signal, unwanted parts of the wave train are filtered out, thereby enhancing the parts of interest. Figure 3 (below) is an example of a wave signature. Table 1 compares gating systems.
| Situation | Effect on the transit time | Effect on amplitude reading (Fixed gate) | Effect on amplitude reading (Floating gate) |
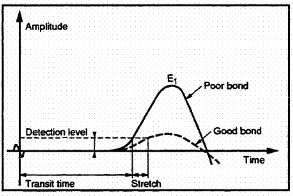
| Free Pipe or Poor Bond | constant | High reading E1 | High reading E1 |
| Moderate to Good Bond | constant | Low Reading E1 | Low Reading E1 |
| Very Good Bond – 1 | Risk of Stretching | Very Low Reading E1 | Very Low Reading E1 |
| Very Good Bond – 2 | Cycle Skipping | Very Low Reading E1 | Very Low Reading E3 |
The actual log displays the amplitude of the signal at the nearest receiver in mV(CBL), whereas the VDL part shows the transit times of the various wave components.
For the CBL to produce meaningful results it is essential too that the tool is centralized in the (cased) hole and logging is carried out at a constant speed. The speed, together with the pulse frequency at the transducer, determines the ‘resolution’ of the tool, i.e. the height that is covered by a single pulse emission and receiving cycle.
CBL/ VDL Log Quality Control and Interpretation
The interpretation of the VDL log today is as much a matter of debate, indeed of controversy, as it was at the time of its inception. Even under the best of circumstances bond logging interpretation requires a thorough understanding of the fundamentals of sonic logging. As there are a great many variables the signal interpretation can be very complex and experience in cement evaluation, therefore, is very valuable. In many cases the results can be undiscriminating, leaving some questions unresolved. However, it still can provide a qualitative assessment of the degree of cement fill in the annulus that has been achieved and the shear bonding of cement to casing and formation alike. As the formation plays an important role in the evaluation of the cement bond, open-hole log and evaluation data, such as Caliper, porosity and lithology need to be taken into account in the interpretation of the CBL / VDL tool response.
Quality Control
The interpretation process should begin with quality control of the log for which it is essential that the log also has a transit time curve, allowing comparison of measured with expected transit times. This comparison may show transit times shorter or longer than expected:
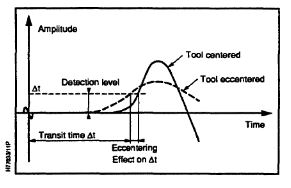
- Shorter transit times may indicate poor centralization of the sonde or are caused by fast formations. If the shorter time is indicative of poor tool centering quantitative CBL evaluation becomes impossible when the shortening exceeds a certain limit. A maximum of 4 μs is widely used.
- Longer transit times (‘stretch’) as pictured in Figure 4 usually indicate a good bond when a corresponding low amplitude is observed and the differential is less than 15 μs. When the amplitude is high a thin cement sheath and high acoustic impedance contrast might be implicated. If longer than 15 μs a good cement-to-pipe bond is present, particularly when this is a ‘cycle skip’, i.e. the first cycle of the original wave is that much attenuated that the amplitude is below the detection level of the receiver, as set by the ‘gate’. Figure 5 shows an example of cycle skipping.

Good Cement Bond Indication In VDL Log
If cement is well bonded to the pipe and formation a high proportion of energy will pass to the formation to propagate and be attenuated before it shows up at the receiver. The better the shear bonding the higher the ‘loss’ of energy to cement and formation. The loss to the borehole (liquid + pipe) is low and constant, therefore the variation in energy received is from the annular material.
The Annulus is Filled With Fluid
If the annulus is filled with fluid little or no acoustic energy is lost and the signal received will be composed only of the casing and fluid waves. A micro annulus between pipe and cement will have a similar effect as fluid fill in that the absence of an acoustic coupling means little energy is transmitted and eventually returned to the receiver.
VDL Log Extra Complications
In the interpretation of a cement bond log extra complications come from e.g.:
- Unconsolidated formations. These have a strong attenuation effect on sonic energy. Therefore the amplitude of the receiver signal will be low and the VDL log will indicate a poor cement-to-formation (Figure 6 refers).
- When transit times of formation are shorter (‘fast formations’) than for casing the formation signal will arrive earlier than the one from the casing. This is important for tool settings, so as not to miss this early arrival.
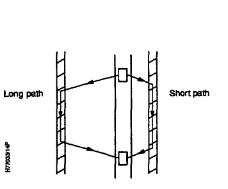
- Poor centralization may result in intimate contact between casing and formation, which may show up, erroneously, on the VDL as a strong formation signal (Figures 7 and 8 refer).
acoustic signal at the VDL receiver
- Plastic, homogeneous salt formations may cause the VDL log to indicate free pipe as this type of formation causes a high degree of attenuation and no contrast in the wave train.
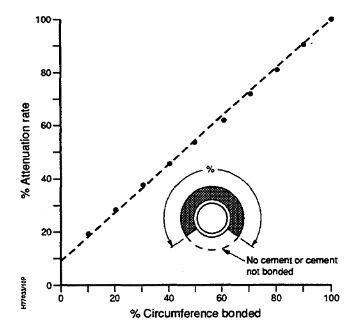
VDL Log Bond Index
The Bond Index has been introduced to give a quantitative interpretation of the cement bond. It is defined as the ratio of cemented cross-sectional area at the zone of interest and full cement fill. The index is based on the linear relationship between attenuation and cemented area, as shown in Figure 9 below.
Log Nomograph – Attenuation and compressive strength
In the early days after CBL / VDL log evolution, a nomograph was introduced known as the ‘CBL interpretation chart’. It relates the attenuation to casing size and weight but above all to the compressive strength of the cement (check also oil well cement properties). This has been proven wrong and nowadays the nomograph uses the acoustic impedance of the cement rather than its strength. This change also allows the nomograph interpretation of non-conventional cements, such as foamed cement formulations, as long as the acoustic impedance is known.
Interference and parameters affecting CBL & VDL Log
Apart from tool and technique-related parameters that have a bearing on the final logging result, there are a number of ‘external’ factors that influence CBL / VDL results.
- Temperature and pressure affect sound transmission and attenuation in well-bore fluid and casing/rock material. It also has some effect on the response of transducers and receivers. Also, increases and decreases in hydrostatic pressure inside the casing may indirectly reduce the cement bond quality by creating a micro-annulus. Running the log at sufficient pressure, therefore, is a prerequisite for successful logging.
- Casing size and thickness. the larger the casing the longer the path acoustic energy has to travel before reaching the casing, resulting in attenuation increasing with size. Greater thickness in contrast leads to less attenuation and a stronger signal at the receiver.
- Fast formations lead to shorter transit times than expected. When sufficient acoustic energy propagates through the formation it would imply a good acoustic coupling between pipe and formation. However, as wave amplitudes vary a great deal in formations the first arriving cycle, which normally is used to measure transit time, maybe too weak to be picked up. In this case, the second wave is used, leading to apparently longer transit times rather than shorter, indicative of fast formations.
- Well-bore fluids. The acoustic properties of well-bore fluids have an impact on the transit time and CBL amplitude, particularly for large casing sizes where the ‘fluid path’ is relatively long.