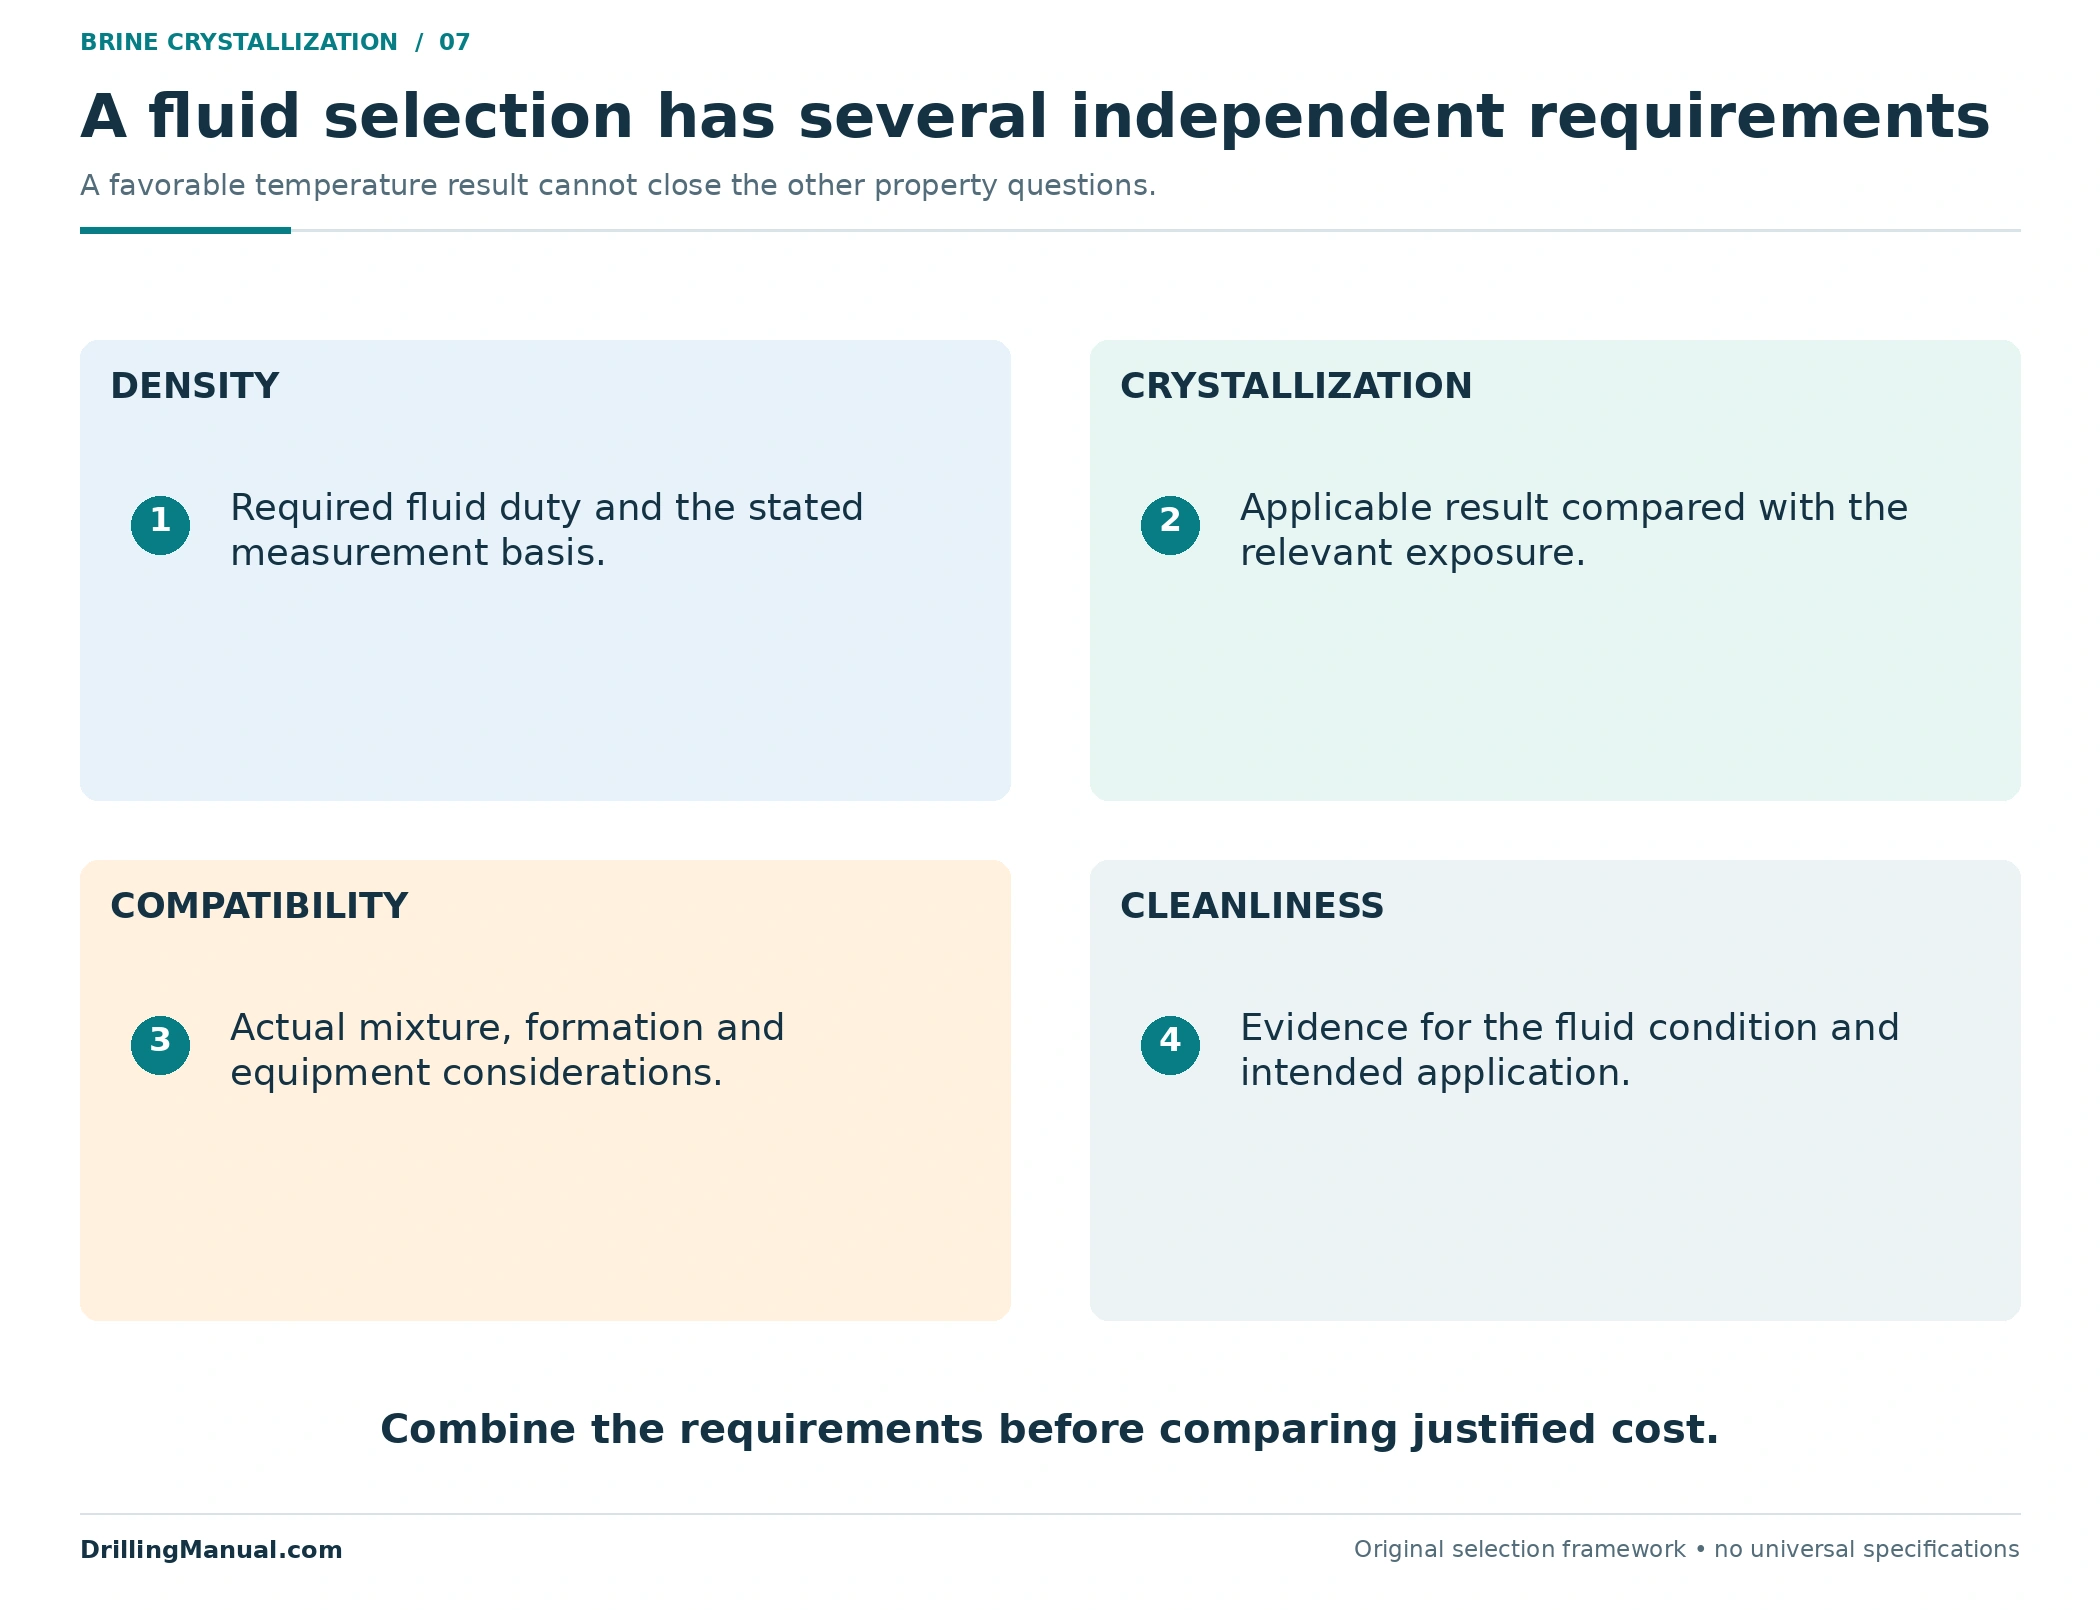
True crystallization temperature belongs in a workover-fluid selection review because a brine must remain suitable wherever it travels, including the coldest exposed part of the system. A fluid selected only for its density can meet one requirement while failing another. Salt crystals can form in a concentrated brine during cooling, and the resulting solids can affect the fluid delivered from storage and the equipment through which it passes. The relevant comparison starts with the actual formulation and its expected exposure. [1, printed pp. 41–44; PDF pp. 56–59] [2, sec. 2.1, printed p. 7; PDF p. 128]
This guide explains what the temperature terms mean, why density does not uniquely define crystallization behavior, and how to make a useful comparison without inventing a universal temperature allowance. The broader workover-fluid selection guide covers the combined density, compatibility and formation-protection decision. Here the central question is narrower: does the evidence for this brine cover the coldest conditions it may encounter?
What true crystallization temperature means
A brine crystallization result describes a physical change in a particular fluid under stated conditions. In the historical heavy-brine reference, the actual crystallization condition is where solid material can begin separating from the solution when sufficient time and suitable nucleation conditions are available. For concentrated brines, that solid can be hydrated salt. In a dilute brine, cooling can instead produce freshwater ice. These possibilities should not be collapsed into a single picture of water freezing inside every completion fluid. [2, sec. 2.1, printed p. 7; PDF p. 128]
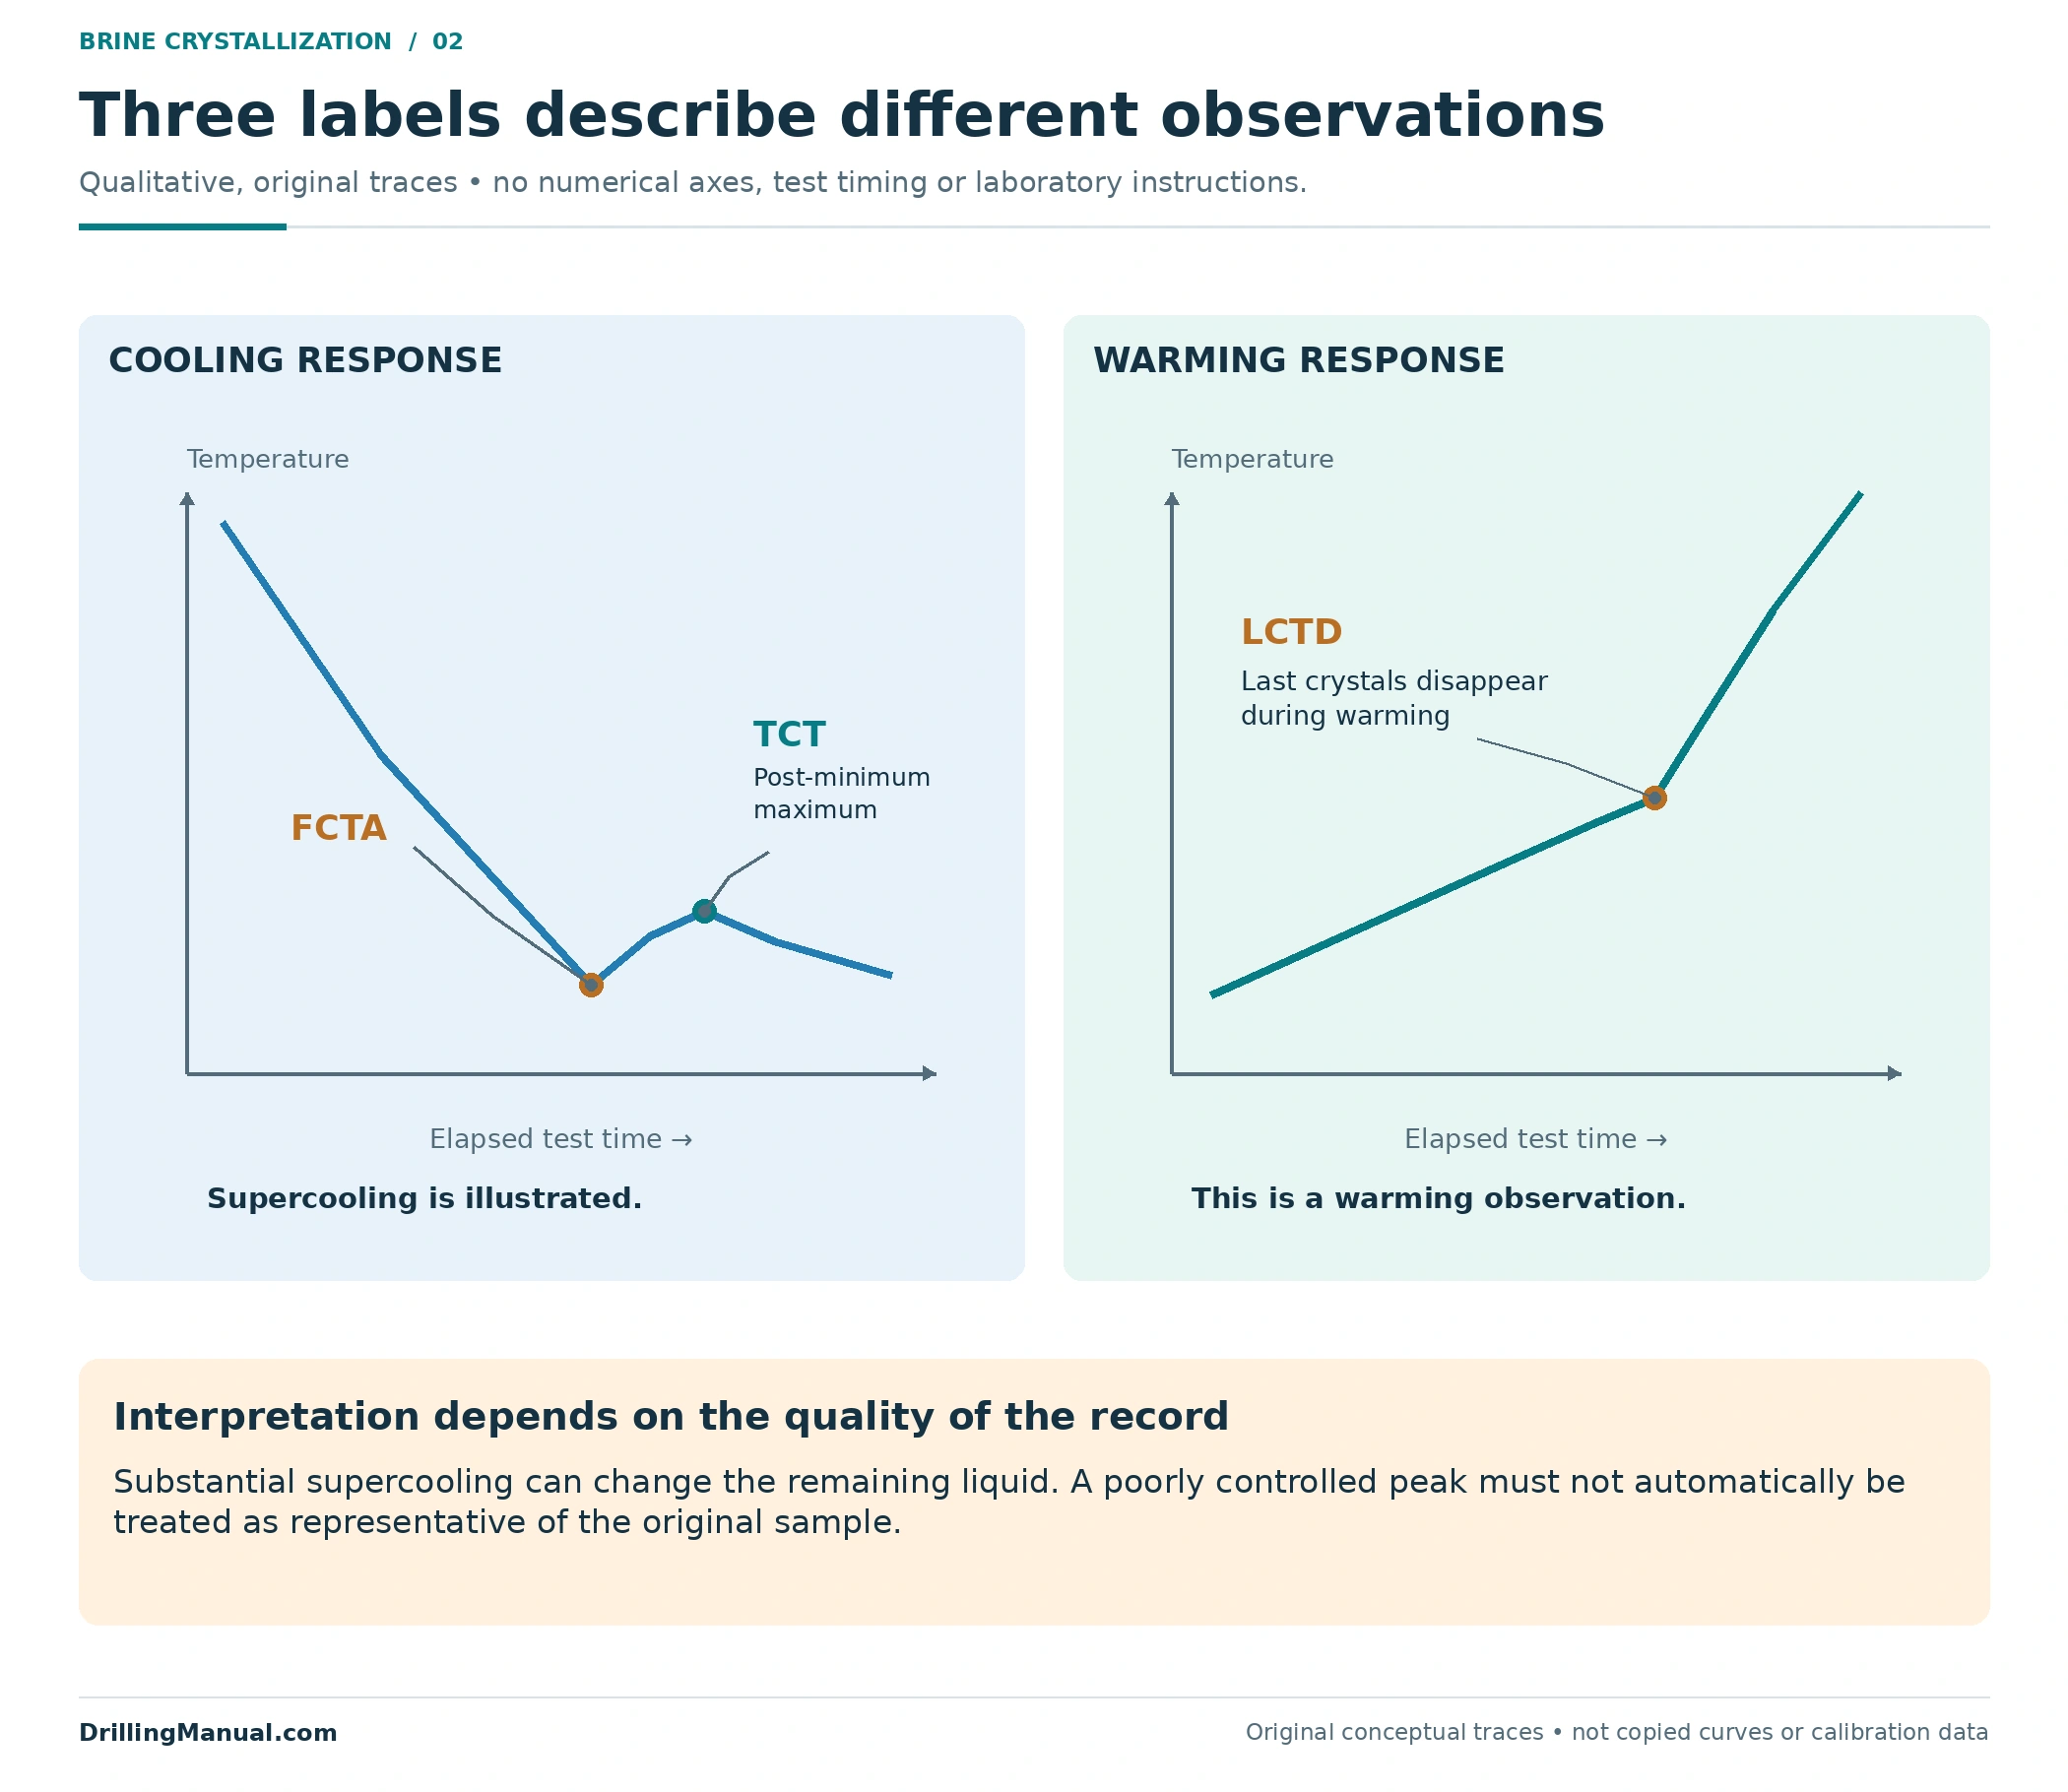
The same sample can produce three named temperature observations. They refer to different parts of a cooling and warming record. A report needs the relevant names alongside the numbers; an unlabeled “crystallization point” leaves the reader to guess which observation was made. Lyons describes the first appearance and final dissolution observations, while the historical heavy-brine reference explains the additional TCT interpretation. [1, printed p. 43; PDF p. 58] [2, sec. 2.1, printed pp. 7, 10; PDF pp. 128, 131]
| Reported term | Observation it describes | Interpretation limit |
|---|---|---|
| FCTA: first crystal to appear | Initial visible crystallization during cooling, associated with the cooling minimum where supercooling occurs. | The sample may have cooled below its actual crystallization condition before crystals appeared. |
| TCT: true crystallization temperature | The temperature maximum after the supercooling minimum, or the cooling-curve inflection when there is no supercooling. | Excessive supercooling can undermine the measurement’s representation of the original sample. |
| LCTD: last crystal to dissolve | The disappearance of the remaining crystals during warming, or the corresponding heating-curve inflection. | This is a warming observation; it should not be relabeled as the cooling result. |
Supercooling means that the liquid has cooled below its actual crystallization temperature without immediately forming crystals. Once crystallization starts, released heat can raise the measured sample temperature. The reference also explains why substantial crystal formation changes the remaining liquid’s composition. Consequently, simply reading a maximum from a poor cooling record does not guarantee a representative true crystallization temperature. Test quality and interpretation matter. The schematic illustrates the distinctions, not a laboratory procedure or a calibration curve. [2, sec. 2.1, printed p. 10; PDF p. 131]
The practical concern extends beyond seeing crystals. The historical reference describes salt settling in a tank and leaving the pumped liquid with a density below that intended. It also describes increasing viscosity and obstruction of handling equipment as crystallization progresses. Those are related consequences of a changed physical state, rather than separate proof that the original density measurement was wrong. A valid measurement on an earlier homogeneous sample may cease to describe the fluid being delivered after crystals have formed and separated. This is why the property record and the fluid’s subsequent history belong together. [2, sec. 2.1, printed p. 7; PDF p. 128]
Supercooling also explains why a sample that remains visibly liquid below a reported value should not automatically justify colder service. The reference relates delayed crystal formation to nucleation conditions and contrasts a small test sample with the much larger wetted system in the field. The absence of visible crystals at one instant is therefore an observation with limits. It cannot establish a new operating temperature for tanks and transfer equipment. A questioned result needs appropriate test interpretation, rather than a conclusion drawn from appearance alone. [2, sec. 2.1, printed p. 10; PDF p. 131]

Density does not determine true crystallization temperature
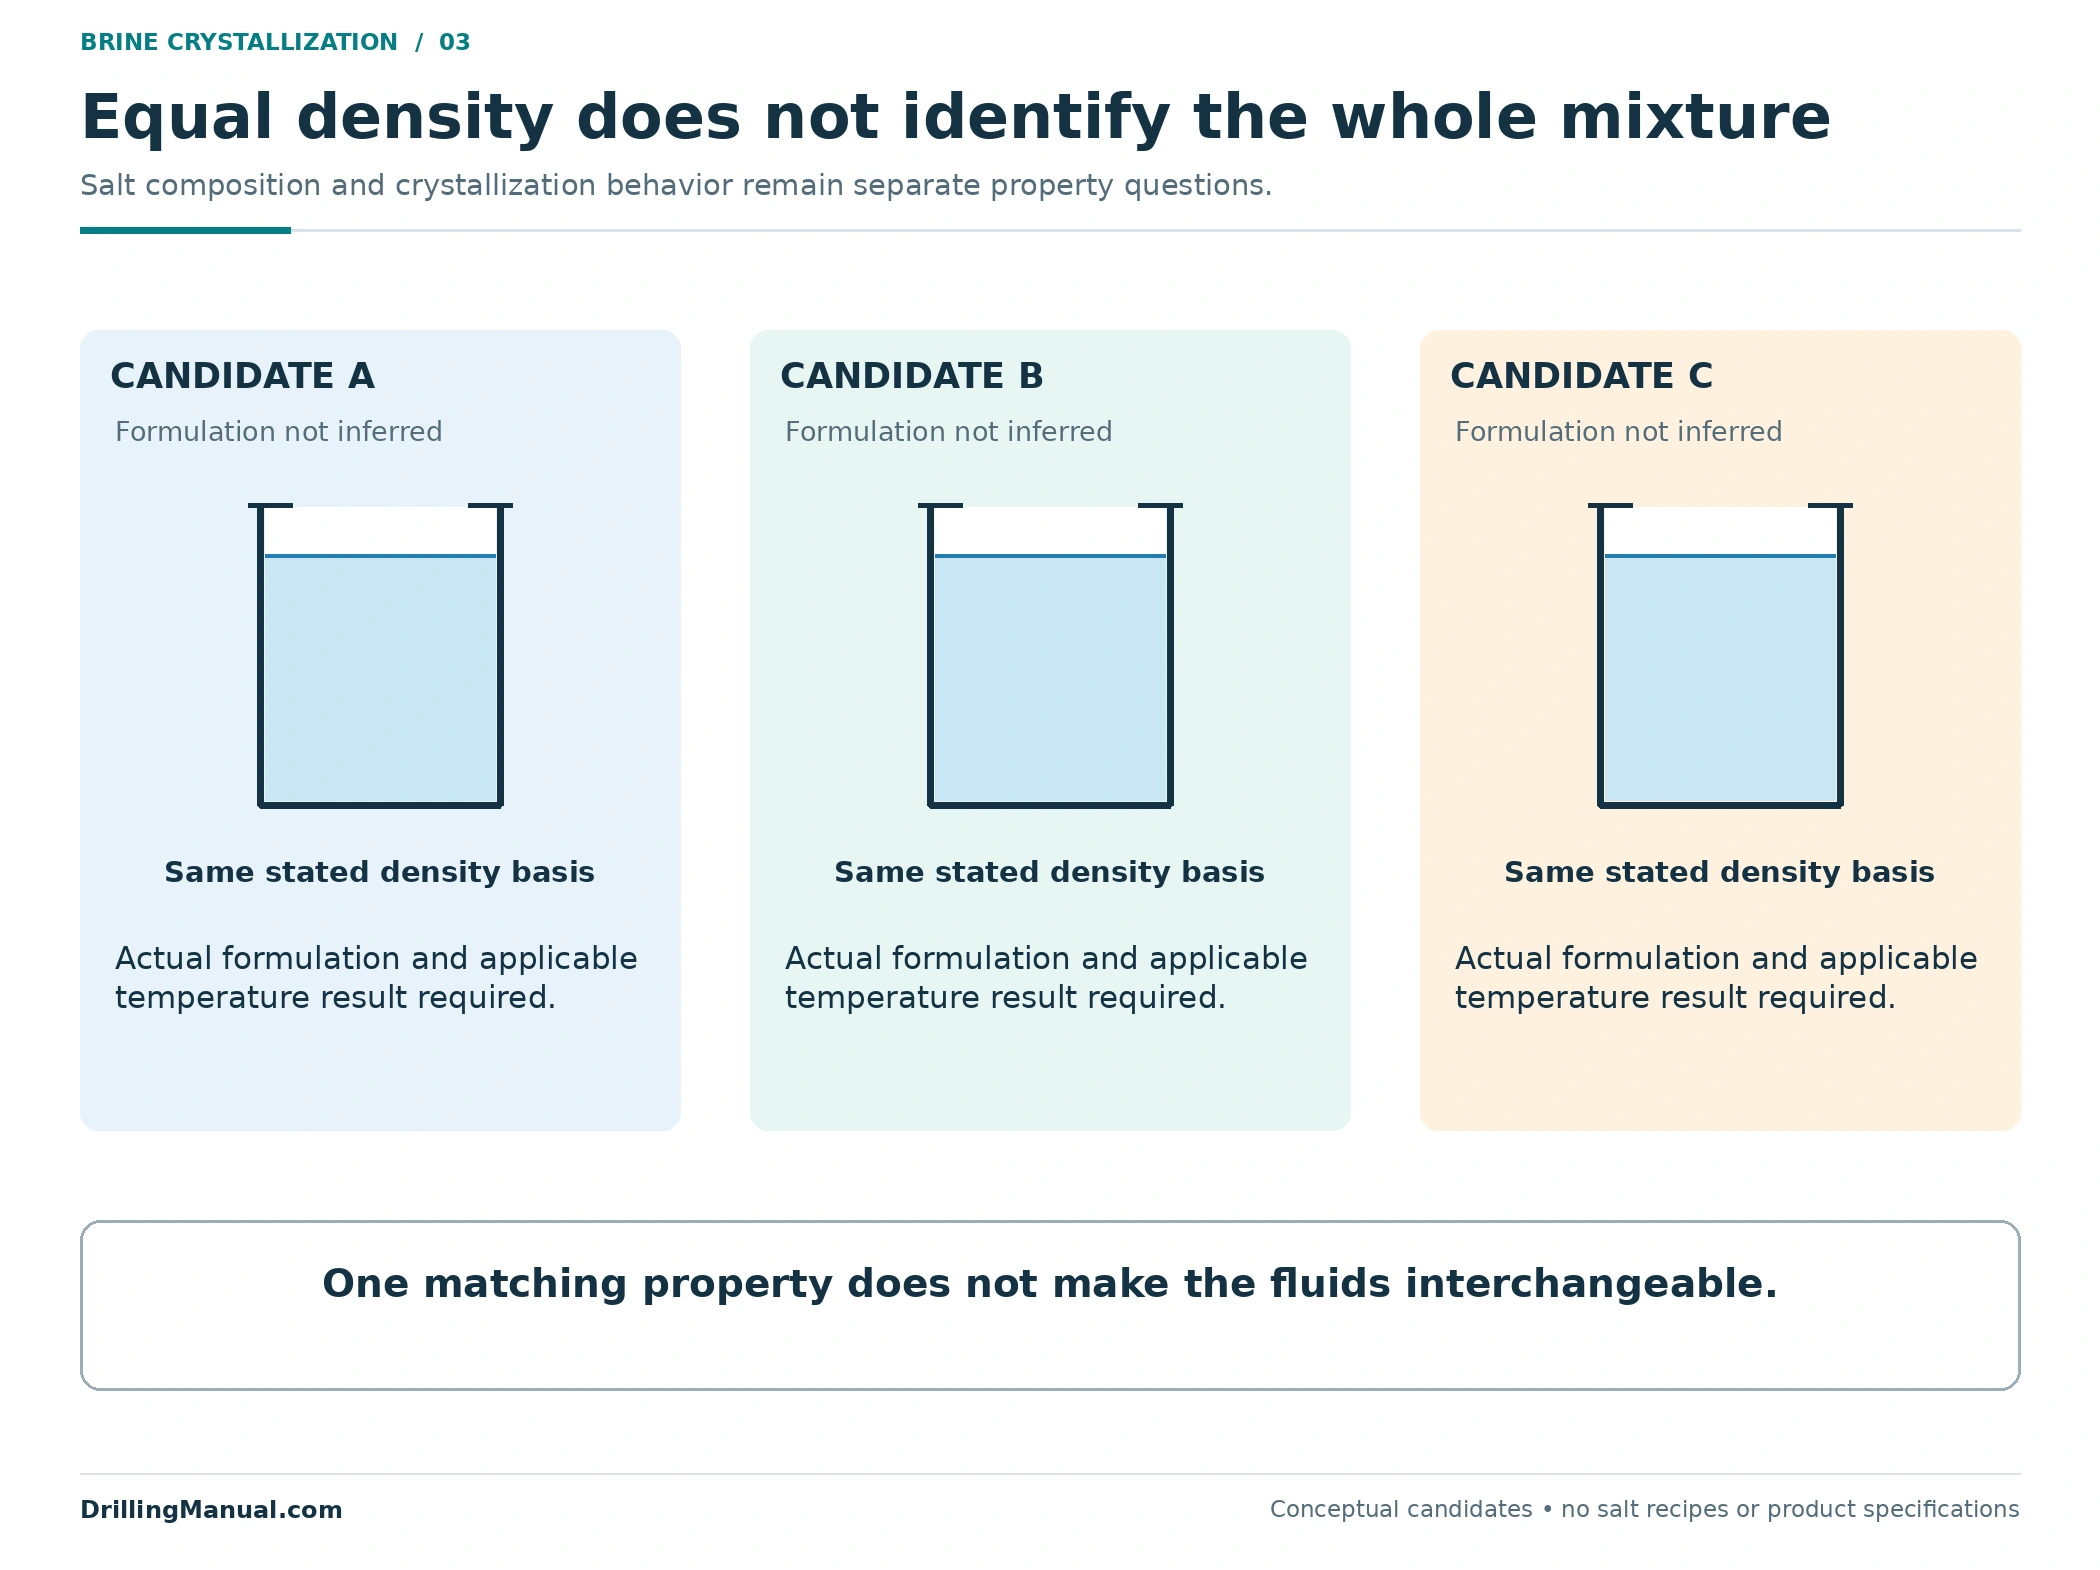
Completion brines can contain one salt or combinations of salts. Lyons discusses single-salt, two-salt and three-salt systems, and relates their selection to the required fluid properties. A density result tells the engineer an important property of the tested mixture; it does not identify every ingredient or its concentration. The heavy-brine reference explicitly describes formulations of a given density with different crystallization temperatures. [1, printed pp. 41–42; PDF pp. 56–57] [2, sec. 2.1, printed p. 7; PDF p. 128]
That distinction matters when comparing bids, reused fluid and a replacement batch. Two fluids described by the same nominal density should not automatically inherit the same cold-exposure assessment. Each proposed formulation needs its own applicable property record. Equally, a lower crystallization result does not prove that the density, compatibility or corrosion behavior is acceptable for the planned duty. Those remain separate requirements.
Density itself also needs a measurement basis. In the atmospheric-pressure data discussed by Lyons, warming lowers brine density; the text addresses pressure effects as a separate property consideration. A recorded density without its temperature is therefore incomplete for a precise comparison. Keep the density basis and the true crystallization temperature basis together, while recognizing that they answer different questions. [1, printed p. 42; PDF p. 57]
Compare true crystallization temperature with the exposure path
The hottest downhole condition is only one part of the fluid’s history. The cited sources discuss seasonal conditions and crystallization in tanks, pumps and transfer lines. A selection review should therefore identify the relevant storage and transfer conditions as well as conditions in the well. The temperature associated with a location should describe the fluid exposure being assessed, rather than an unrelated ambient or reservoir number. [1, printed pp. 43–44; PDF pp. 58–59] [2, sec. 2.1, printed pp. 7, 10; PDF pp. 128, 131]
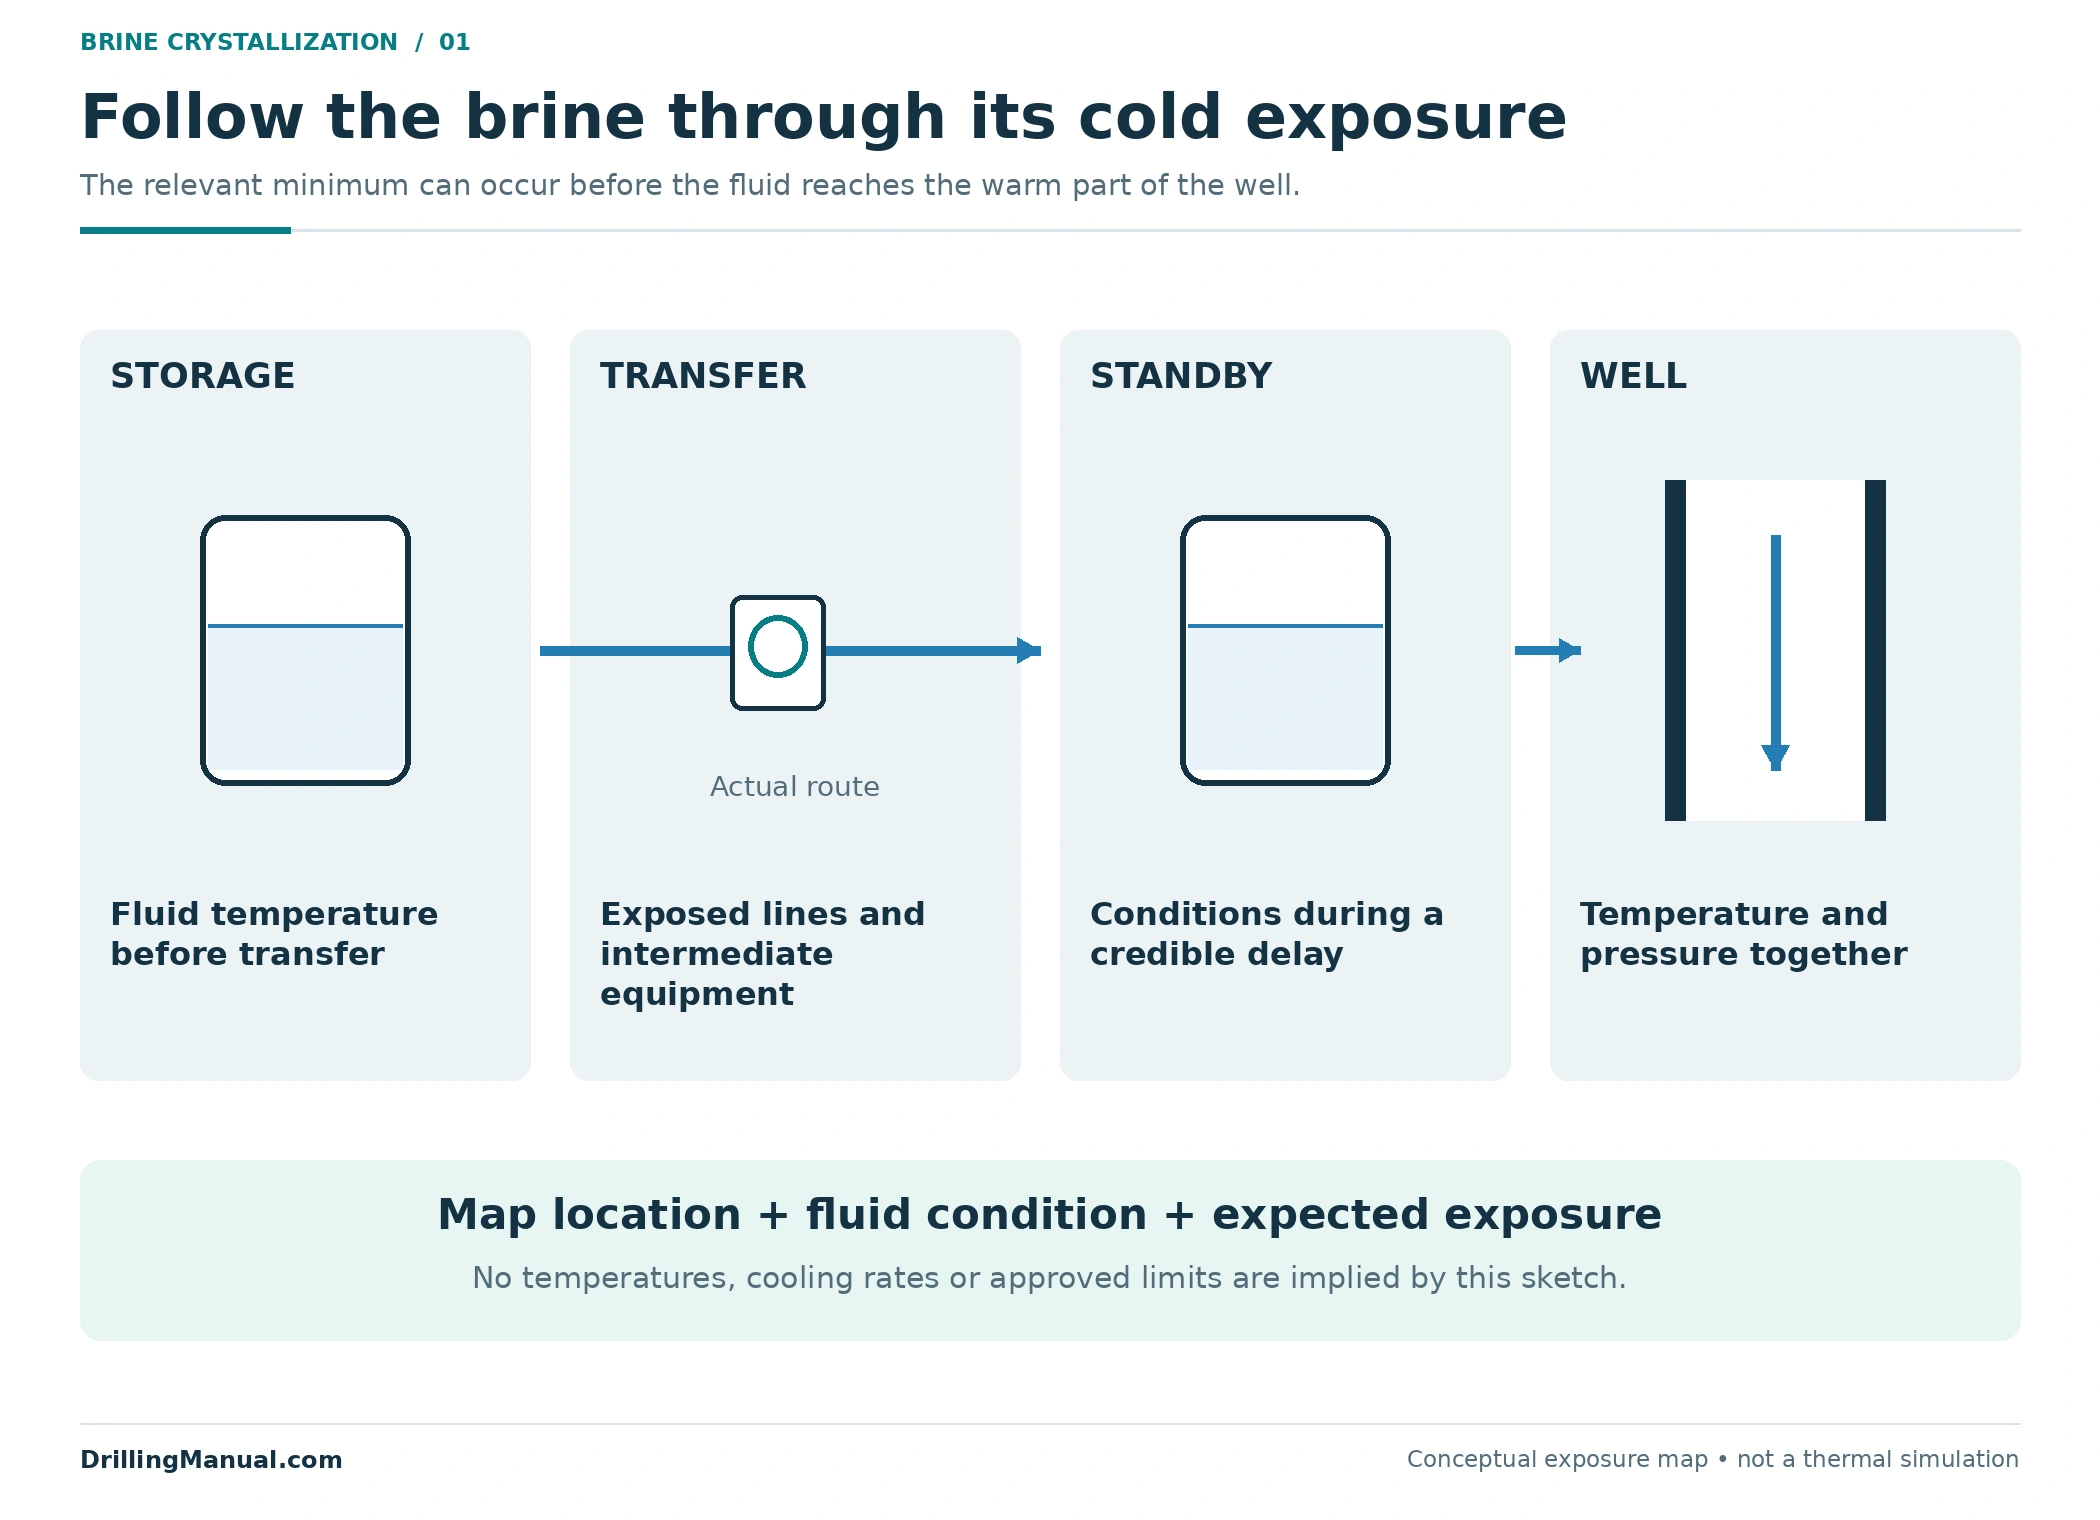
Map the planned route and credible changes to it. A brine may spend time in storage, move through exposed connections and remain in surface equipment during a delay before entering a warmer part of the system. The useful record identifies where the cold condition could occur, what supports the temperature estimate and which fluid batch is involved. It should also show when a change in timing or route would require the original comparison to be reconsidered.
| Exposure being reviewed | Information to retain | Question it resolves |
|---|---|---|
| Storage | Expected fluid temperature range and the conditions supporting it. | Does the property evidence cover the fluid before transfer? |
| Transfer and exposed surface equipment | The actual route, expected cold sections and potential standby conditions. | Could an intermediate location govern the temperature comparison? |
| Well exposure | Relevant temperature and pressure conditions together. | Does the qualification cover the intended well environment? |
| Changed schedule or fluid history | Revised exposure or composition and the date of the supporting assessment. | Does an earlier result still represent the current proposal? |
Comparing true crystallization temperature with an exposure path is an evidence exercise, not a substitute for thermal evaluation. The route sketch contains no cooling rate or predicted residence-time effect. The related mud-displacement guide covers the wider displacement context; a displacement plan still needs the appropriate properties for the fluid it actually moves.

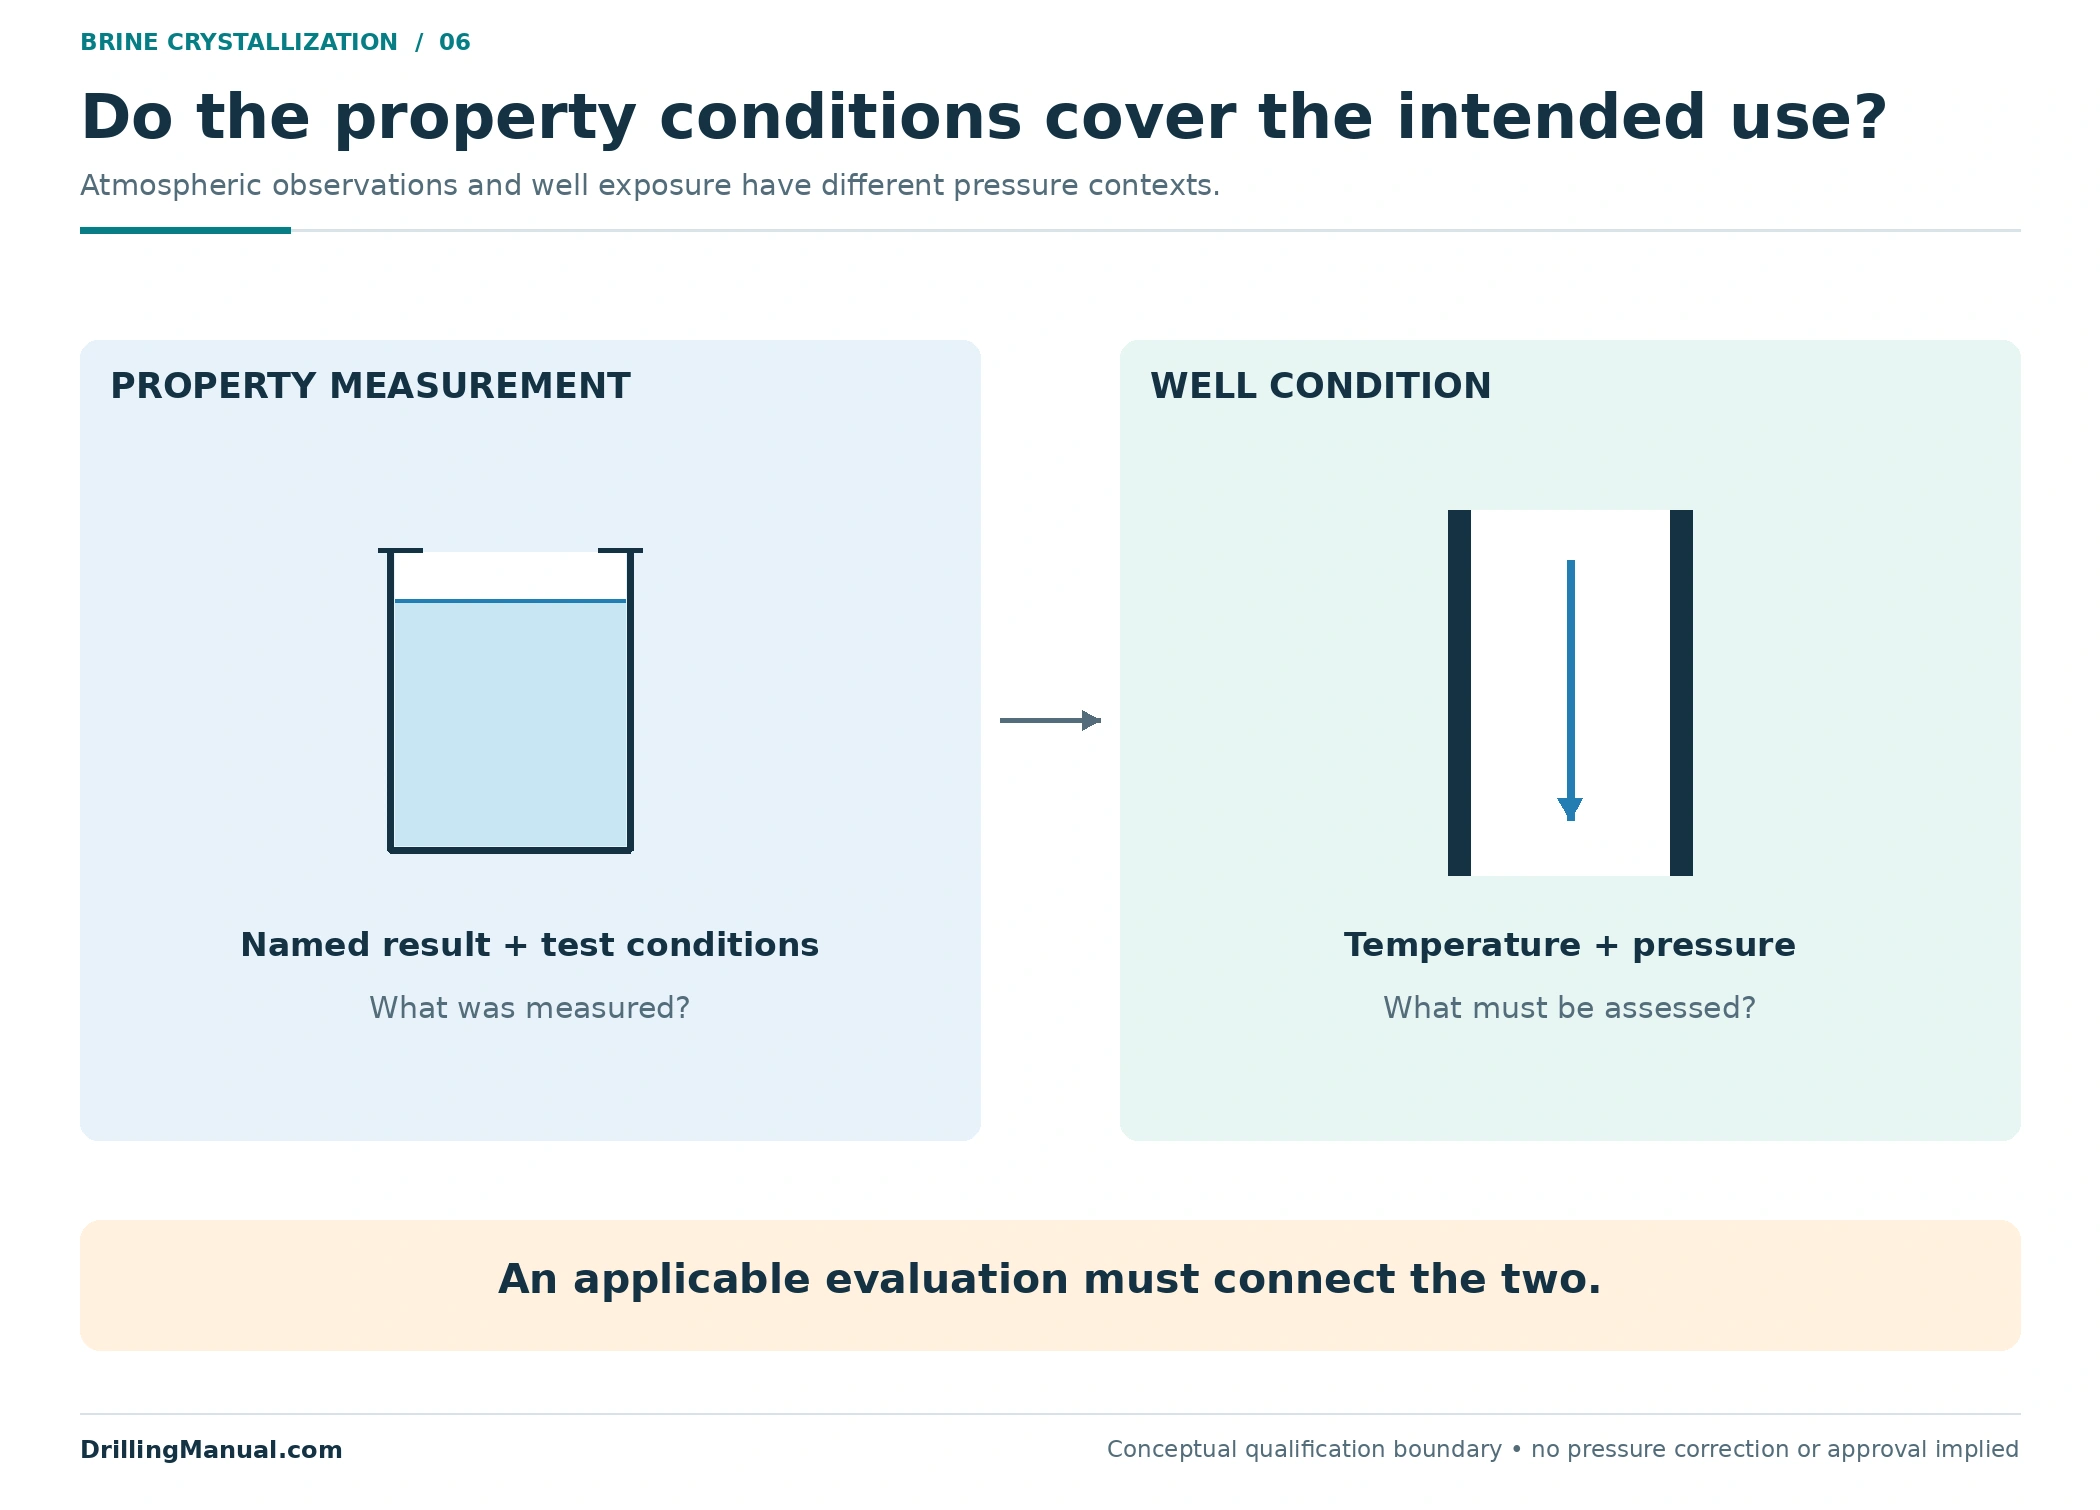
True crystallization temperature and the pressure basis
A temperature result should not lose its pressure qualification as it moves from a laboratory report into a workover program. Lyons states that the described first-crystal and last-dissolution observations are made under normal-pressure conditions, and that pressure can substantially change crystal formation. That is sufficient reason to separate a surface-temperature screen from a conclusion about every downhole condition. [1, printed p. 43; PDF p. 58]
The comparison is straightforward to state: identify the test conditions, identify the intended exposure conditions, and determine whether the evidence connects them. A positive temperature difference calculated from an atmospheric result does not by itself close a pressure-related evidence gap. Nor can a different fluid’s pressure response be assigned to the proposed mixture merely because the two share a density label.
The diagram deliberately supplies no pressure correction. Its two panels distinguish the property measurement from the well condition requiring assessment. This keeps the selection record honest about what was measured and what still needs an applicable evaluation.
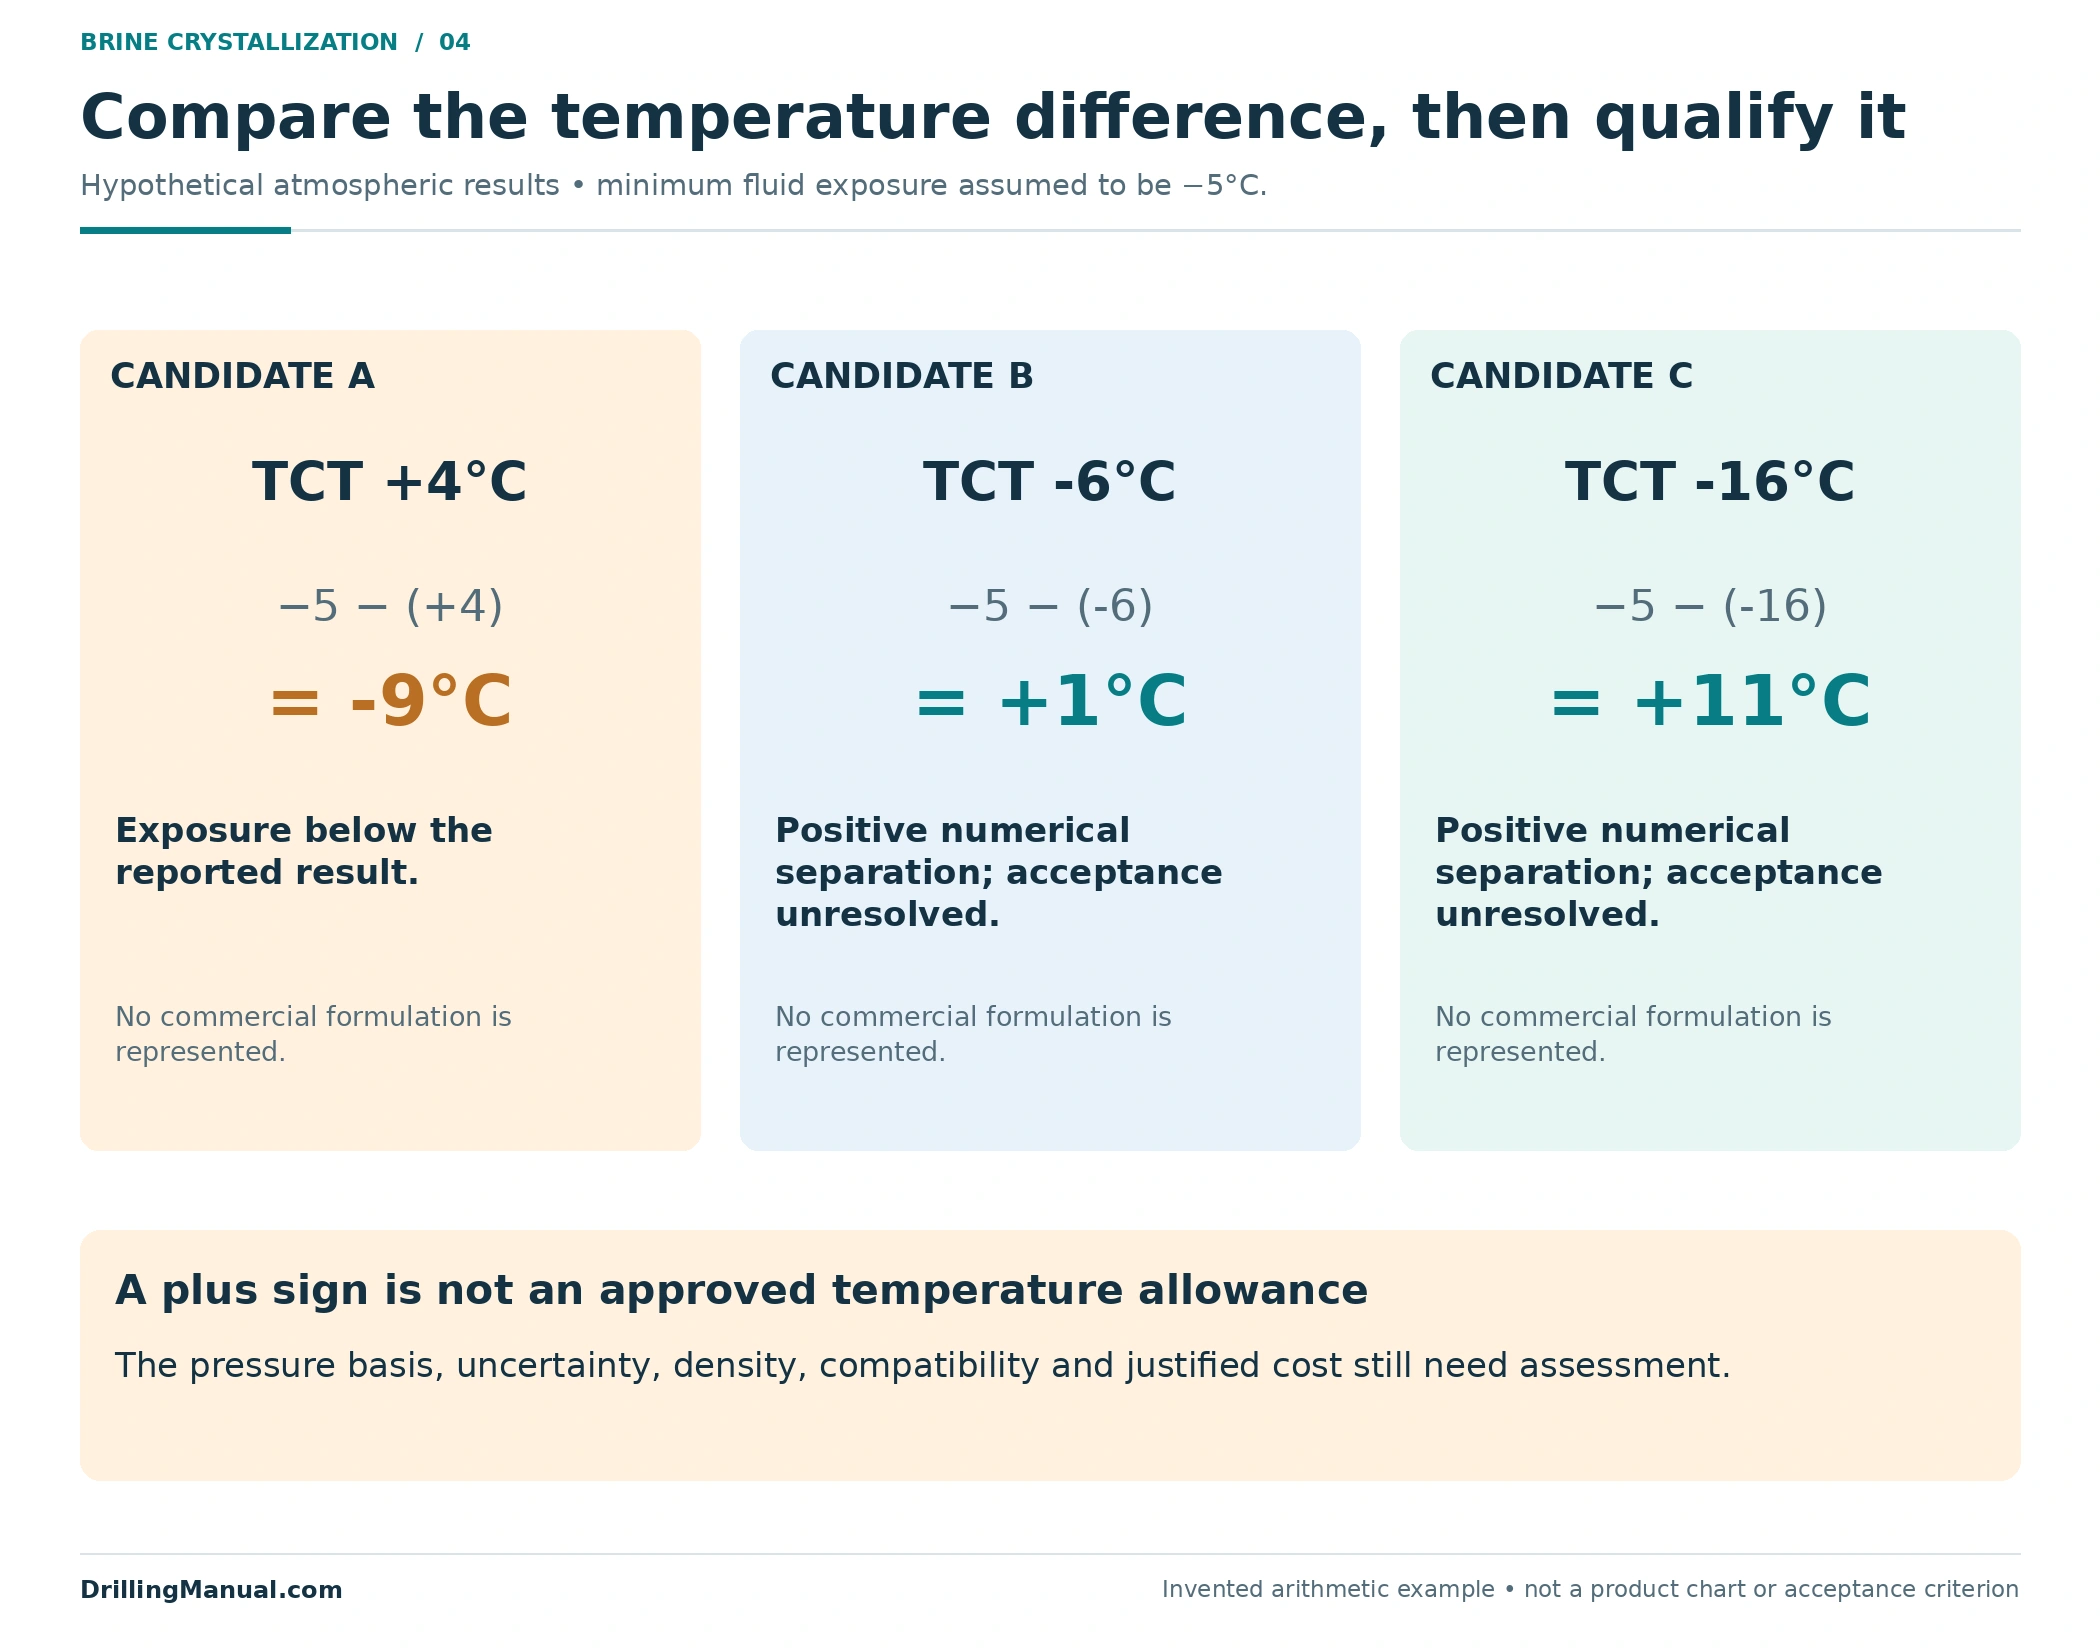
A hypothetical cold-exposure comparison
Consider three hypothetical candidate brines that have already been placed on the same density comparison basis. Their assumed, valid atmospheric TCT results are +4°C, −6°C and −16°C. Suppose an independently established minimum fluid temperature for the atmospheric storage and transfer portion of the job is −5°C. These numbers are invented to explain the comparison; they are not commercial formulations, measured field data or recommended specifications.
For this limited screen, define the temperature difference as the assumed minimum exposure minus the reported true crystallization temperature. A negative value places the exposure below the reported result. A positive value only states the numerical separation. It does not establish an approved allowance, adequate uncertainty treatment or acceptance for pressurized service.
| Hypothetical candidate | Assumed TCT | −5°C minus TCT | What the arithmetic establishes |
|---|---|---|---|
| A | +4°C | −9°C | The assumed minimum exposure is below the reported result. |
| B | −6°C | +1°C | The assumed exposure is only 1°C above the reported result; acceptance is unresolved. |
| C | −16°C | +11°C | The numerical separation is larger; other selection requirements remain open. |
Candidate B should not acquire a “safe” label from the plus sign, and candidate C should not win automatically because its number is lowest. Review uncertainty in the exposure and the property result, the pressure basis, compatibility, required density and economics. If the expected minimum changes, recalculate the comparison. If the formulation changes, establish whether the original property result remains applicable before reusing it.
For example, changing only the assumed minimum exposure from −5°C to −10°C changes the three differences to −14°C, −4°C and +6°C respectively. Candidate B has crossed from a positive to a negative numerical difference without any change in its assumed laboratory result. This does not predict that a particular delay will cool the fluid by five degrees; it demonstrates why a changed exposure requires a fresh comparison. The temperature basis is an input to the decision, not a permanent property of the purchase order.
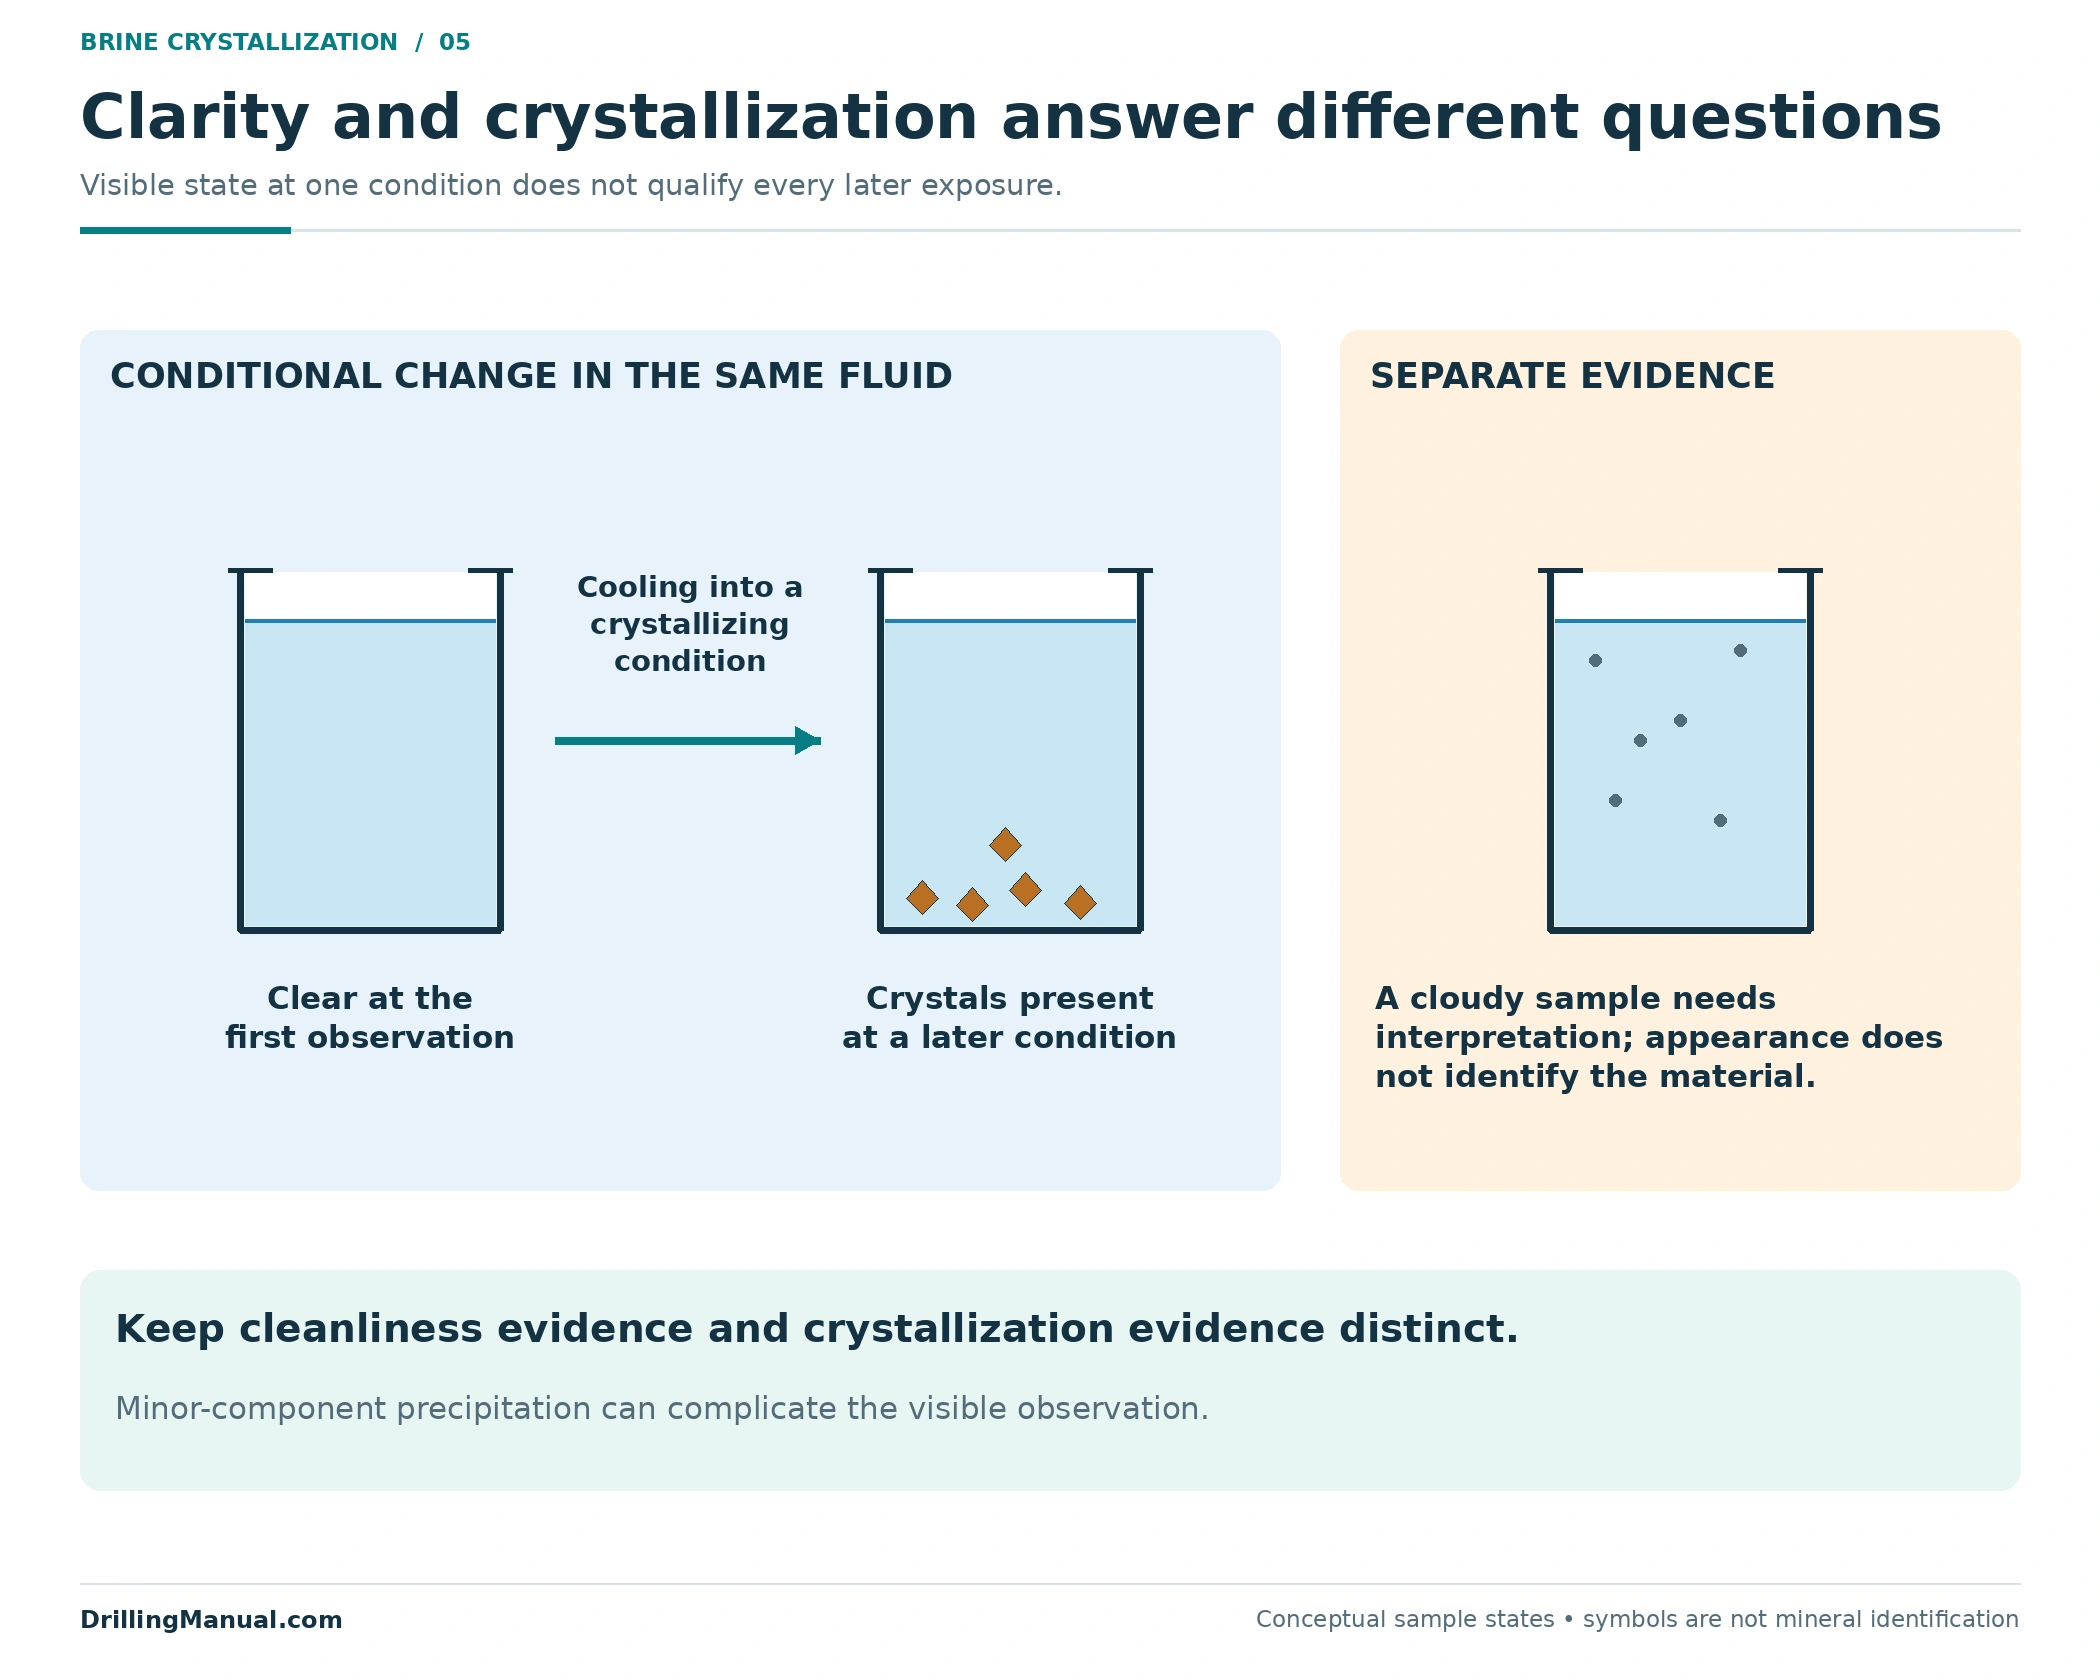
True crystallization temperature is separate from cleanliness
A clear sample at one temperature does not establish that the same fluid will remain clear after a different exposure. The crystallization discussion concerns material leaving solution under the relevant conditions. A cleanliness assessment concerns the observed or measured solids condition of the sample. Those questions intersect when crystals appear, but one successful observation cannot replace the other. [1, printed pp. 43–45; PDF pp. 58–60]
The historical heavy-brine reference adds a useful qualification: a minor constituent can precipitate and make a sample cloudy before the main brine’s TCT response. Appearance therefore needs interpretation. Cloudiness should neither be dismissed nor automatically converted into a new temperature specification for the entire mixture. Establish what the observation represents and preserve the distinction between the sample’s visible condition and its qualified crystallization result. [2, sec. 2.1, printed p. 10; PDF p. 131]
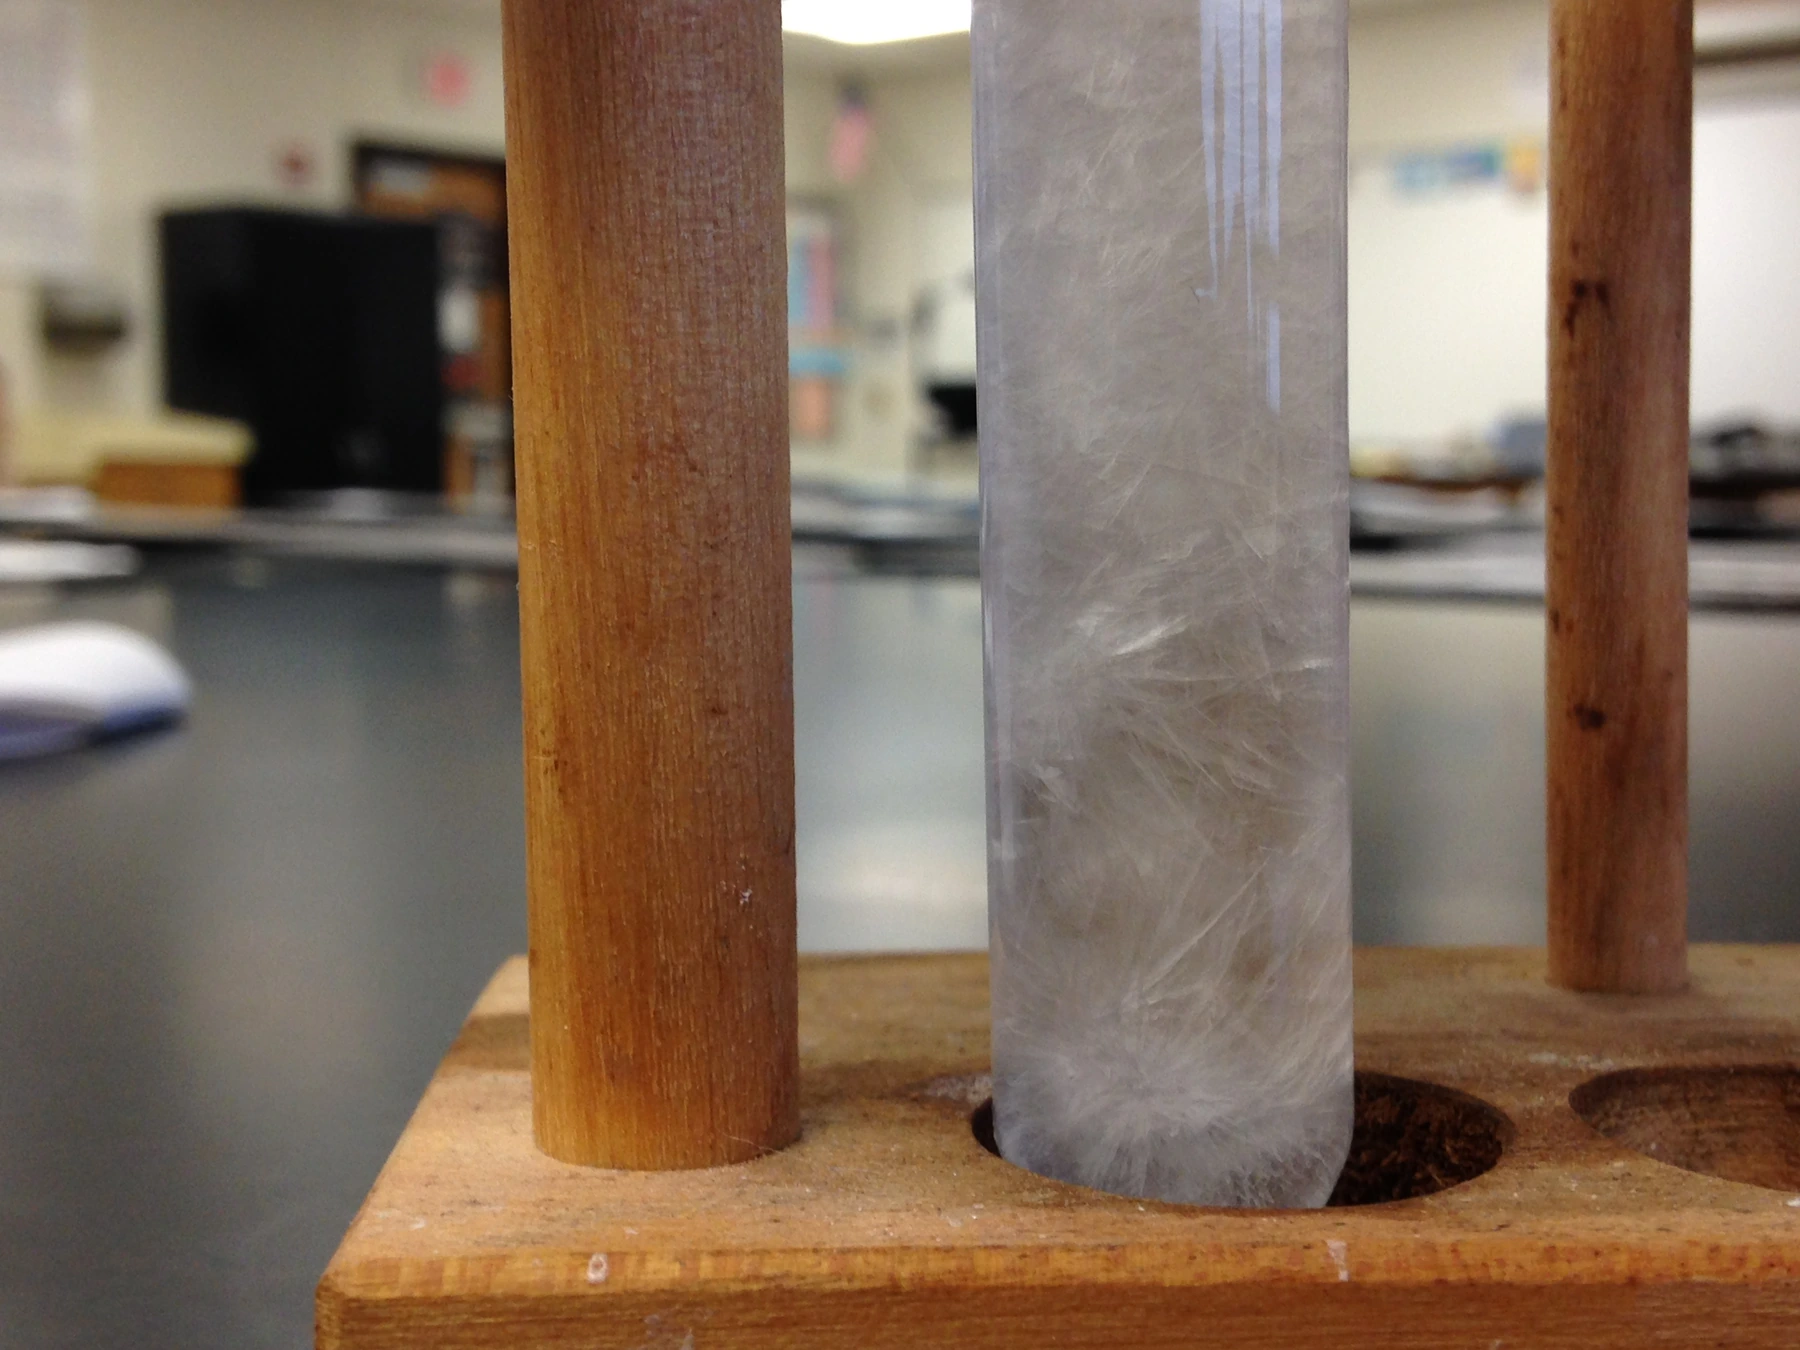
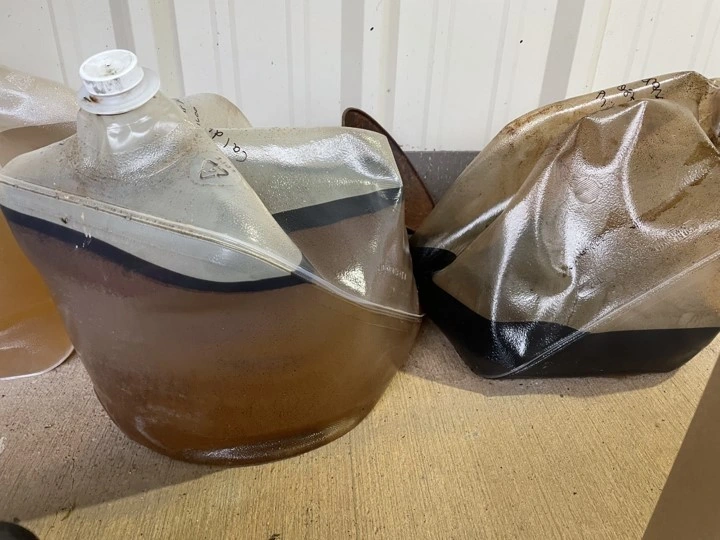
The completion and workover-fluid testing guide covers cleanliness measurements. Use those results alongside the temperature assessment. The photographs here have narrower purposes: the USGS image shows actual produced-water sampling, and the classroom image shows crystals in a solution of unspecified composition. Neither supplies a completion-brine qualification result.
Recheck the evidence when the mixture changes
A laboratory result belongs to the tested composition. Dilution, blending or contamination can change the fluid that the original result described. Lyons discusses formulation-dependent crystallization and warns that some changes to brine chemistry can cause precipitation. The practical implication is to retain the identity and history of the fluid represented by the result, particularly where stored or recovered brine is reused. [1, printed pp. 41, 44–45; PDF pp. 56, 59–60]
A treatment that changes true crystallization temperature is not automatically neutral to the other required properties. Avoid treating density restoration, temperature qualification and compatibility as interchangeable adjustments. A review should establish the properties of the resulting fluid, rather than combining a density result from one mixture with a crystallization result from another. This article supplies no order of addition or blending recipe.
The formation-damage guide addresses the broader consequences of unsuitable fluid interaction. In this selection review, compatibility remains an independent question even when a candidate satisfies the temperature requirement.
A colder specification needs a reason
Lyons explains the economic trade-off: formulations with lower crystallization temperatures can cost more, and specifying a much lower temperature than the duty requires can add unnecessary expense. The historical brine reference describes the opposing consequence of an inadequately cold formulation: crystallization in handling equipment can create operational problems and lost time. The selection therefore needs a justified exposure requirement, rather than a preference for either the cheapest fluid or the lowest number. [1, printed p. 44; PDF p. 59] [2, sec. 2.1, printed p. 7; PDF p. 128]
The economic question is whether the proposed true crystallization temperature is appropriate for the documented duty, with the other fluid requirements satisfied. Historical summer and winter blend ranges are not current vendor specifications. Obtain applicable property information for the proposed batch and intended conditions; a seasonal name alone does not complete the assessment.
Make the true crystallization temperature decision reviewable
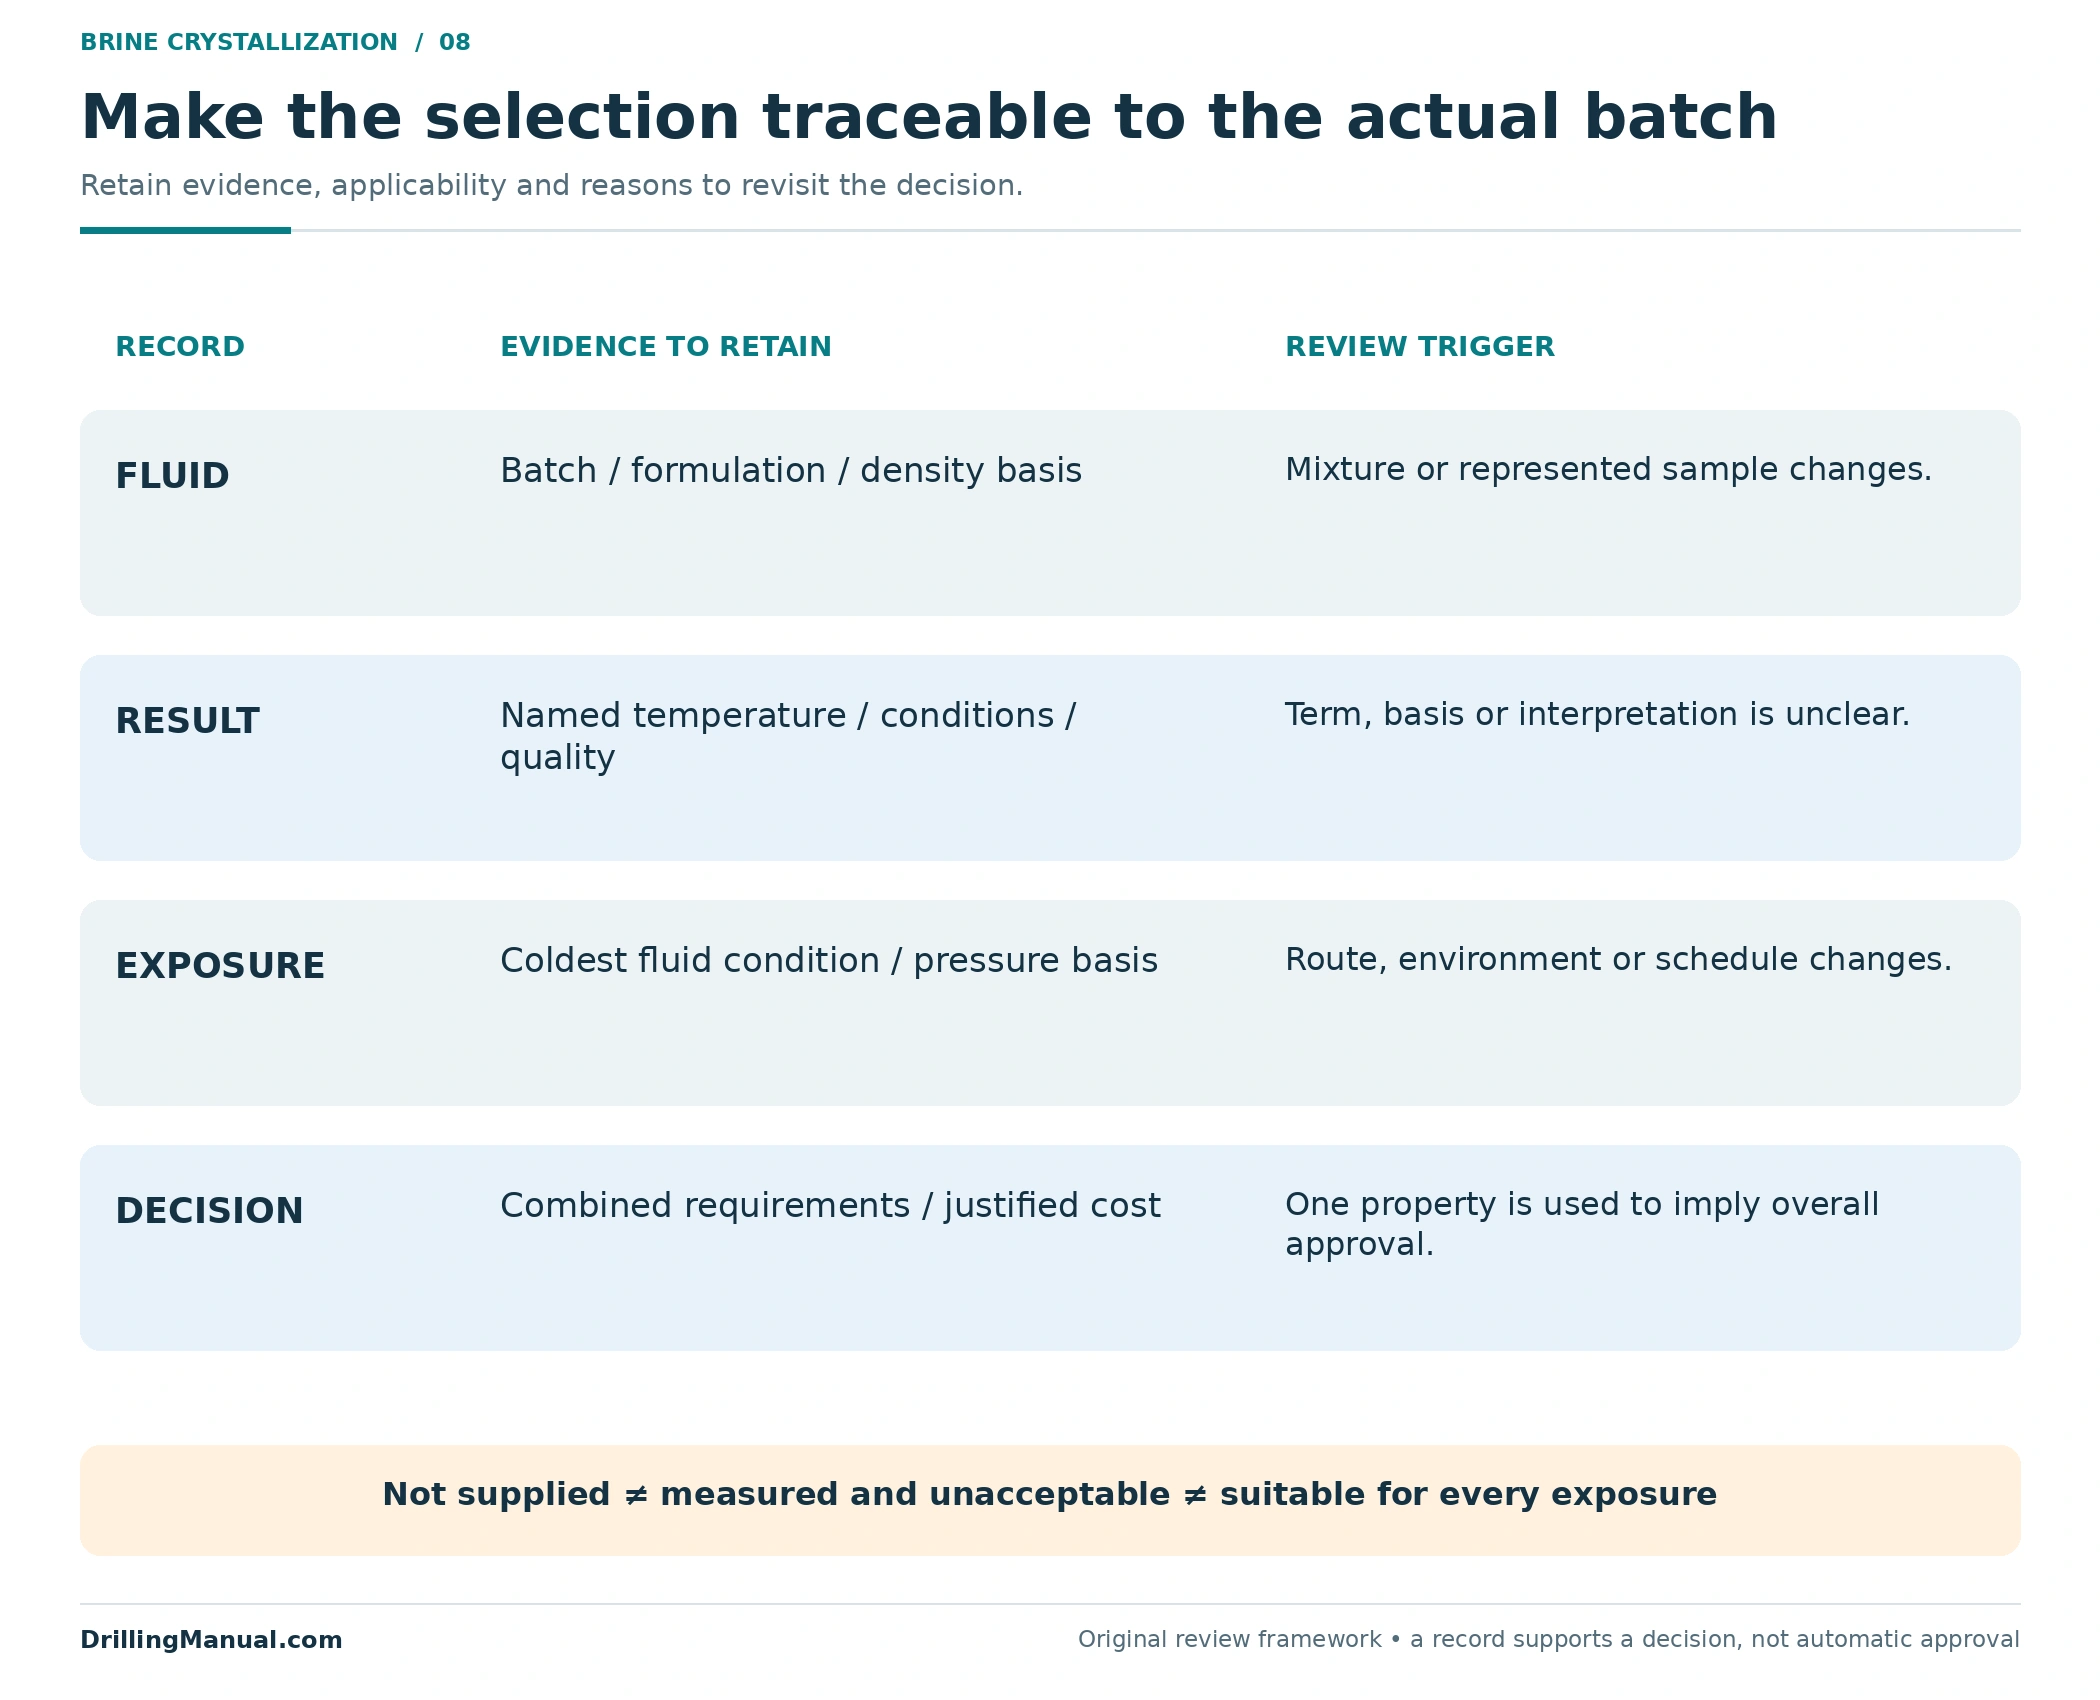
The selection record should connect the fluid, property evidence and exposure. It need not reproduce a laboratory procedure to do that. A second reviewer should be able to identify the tested batch, understand which temperature was reported and see why the result applies to the proposed use. The following original framework combines the source distinctions without assigning universal limits.
Preserve incomplete information as an open item. “No result supplied” differs from a measured result that fails the agreed requirement. Likewise, an atmospheric result can remain valid evidence for its stated conditions while being insufficient for a different pressure exposure. Keeping those categories separate helps the reviewer ask for the missing evidence without discarding useful measurements or granting an unsupported pass.
| Record item | Useful content | Reason to revisit it |
|---|---|---|
| Fluid identity | Formulation or batch identity, density basis and relevant reuse or mixing history. | The composition no longer matches the represented sample. |
| Crystallization evidence | Named result, test basis and any qualification affecting interpretation. | The reported term or measurement quality is unclear. |
| Exposure assessment | Coldest relevant fluid condition and the temperature/pressure basis. | The route, schedule or operating environment changes. |
| Combined selection | Density, compatibility, cleanliness, temperature suitability and justified cost. | One property is used to imply acceptance of the others. |
Keep the decision within the overall workover scope and access plan. A fluid-property review supports that plan; it does not demonstrate the condition of every well barrier or authorize an intervention. Its value is a traceable choice of fluid for a defined job.
Brine crystallization questions
Is FCTA the same as true crystallization temperature?
They name different observations. FCTA can include supercooling before visible crystals appear; TCT is interpreted from the subsequent cooling response or the inflection without supercooling. The distinction is why a temperature number needs its label and test context. [2, sec. 2.1, printed pp. 7, 10; PDF pp. 128, 131]
Why record the last crystal to dissolve?
LCTD describes the warming side of the observation. It records the disappearance of the remaining crystals and should remain distinguishable from the cooling observations. It is not a replacement name for FCTA or TCT. [1, printed p. 43; PDF p. 58]
Can equal-density brines have different crystallization temperatures?
Yes. The historical heavy-brine reference describes changing the proportions of salts to obtain different crystallization behavior at a given density. That supports comparing the actual formulations, not assigning a single temperature to every brine with the same density label. [2, sec. 2.1, printed p. 7; PDF p. 128]
Does a clear sample prove temperature suitability?
No. It describes the sample’s visible state at that observation. It does not establish behavior over the full intended temperature and pressure exposure, and minor-component precipitation can complicate interpretation. Cleanliness and crystallization evidence must be considered separately. [1, printed p. 43; PDF p. 58] [2, sec. 2.1, printed p. 10; PDF p. 131]
What margin should be used above true crystallization temperature?
No universal margin is established here. The applicable requirement must account for the actual exposure, measurement basis and uncertainty, pressure conditions and the other fluid-selection requirements. The hypothetical comparison illustrates subtraction, not an approved acceptance allowance.
Should the lowest available TCT always be selected?
No. A lower value can increase cost without resolving a separate density or compatibility problem. Select a formulation that meets the justified requirements for the duty, with the relevant property evidence, rather than ranking fluids by one temperature alone. [1, printed pp. 44–45; PDF pp. 59–60]
Book references
- William C. Lyons. Working Guide to Drilling Equipment and Operations. First edition, 2010. Gulf Publishing, an imprint of Elsevier. ISBN 978-1-85617-843-3. Section 1.4, printed pp. 41–45; PDF pp. 56–60. The edition and year follow the inspected title and copyright pages.
- American Petroleum Institute. Recommended Practice for Testing Heavy Brines, API RP 13J, first edition, June 1, 1986, section 2.1, printed pp. 7–10. Reproduced in Appendix 6.1 of E. van Kapel, Completion/Work-over Fluid Manual, Shell Internationale Petroleum Maatschappij B.V., Report EP 90-3765, December 1990; PDF pp. 128–131. Used for historical terminology and physical interpretation, not as a current test specification. No test procedure or source figure is reproduced.