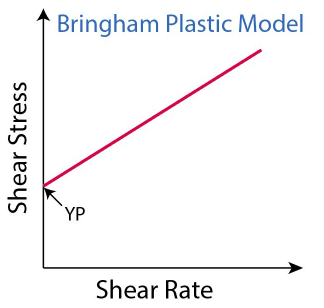
Yield Point in drilling mud is defined as the measure of the fluid’s initial flow resistance or the calculation of a value required to move the fluid in terms of shear stress. It can also be stated that the yield point is equivalent to the force of attraction between the particles of fluid colliding with one another. However; according to Bingham Plastic Model, the yield point is the value of shear stress when extrapolated to the zero value of shear rate on the y-axis as shown in Figure 1.
Formulae:
Mud is circulated in an instrument called “viscometer” ( check also: rheometer test procedures) at different rotations per minute and the values are measured that are used in the calculation of yield point. The formulae for the calculation of yield point are given as:
Yield Point (YP)= Reading at 300 rpm – Plastic Viscosity (PV)
And the value of Plastic Viscosity (PV) from the above equation can be calculated as:
Plastic Viscosity=Reading at 600 rpm-Reading at 300 rpm
SI unit used for the Yield Point (YP) is lb./100ft2.
Example:
An experiment performed in lab by circulating drilling mud in a “viscometer” at 600 rpm and 300 rpm and the measurements were noted as follows:
Reading at 300 rpm = 28
Reading at 600 rpm = 47
Plastic Viscosity (PV) = 47 – 28 = 19 CP
Yield Point (YP) = 28 – 19 = 9 lb./100 ft2.
Factors Affecting Yield Point (YP) in Different Types of Drilling Mud:
There is a direct relation between Yield Point (YP) and frictional pressure loss. The more the value of Yield Point (YP) is, the more will be the frictional pressure losses.
Following factors are affecting Yield Point (YP) in water-based drilling muds making its value increase:
- Higher Temperature: Measurements of Yield Point (PV) increases with increase in temperature showing that there is a direct relation between Yield Point (PV) and temperature in water-based muds.
- Contaminants: Because of the circulation of the drilling fluids in the wellbore and the influx of reservoir fluids into it there are many mud contaminants that includes in it. These contaminants effect the calculations of Yield Point (PV) making these an important factor to consider when dealing with the value of Yield Point (PV). These contaminants might include carbon dioxide (CO2), salt and anhydrite etc.
- Over Treatment: Many chemicals and mixtures are added in water-based muds for different reasons. Their quantity mixed in the mud if not managed properly might affect the values of Yield Point (PV). These chemicals include lime or caustic soda.
Following factors are affecting Yield Point (YP) in oil-based muds making its value increase:
- Drill Cuttings: Value of Yield Point (YP) increases with the increase in drilled cuttings from the formation. Cuttings that are circulated back to the surface when present in the oil-based mud effect the value of Yield Point (YP).
- Reaction of Lime (CaO) in the mud with the CO2: Lime (CaO) is often added in the oil-based mud which when chemically reacts with the CO2 in the mud forms Calcium Carbonate (CaCO3) that contribute towards the increment in the value of Yield Point (YP).
- Lower Temperature: On contrary to the water-based mud, it is the lower temperature that is affecting Yield Point (YP). Lower the temperature in oil-based mud higher will be the viscosity and more will be the value of Yield Point (YP).
Yield Point in Drilling Mud Applications:
The Yield Point (YP) of the drilling mud has a very basic and important function in the drilling. Some of its applications in the drilling field of the petroleum industry are stated as follows:
- Carrier of Drilled Cuttings: When the drilling bit at the end of the drill string cut through the formation it is very important to remove those cuttings from the face of the bit and avoid the accumulation of drilled cuttings in the borehole. Otherwise, the efficiency of the drilling is seriously threatened. Yield Point (YP) value demonstrates the ability of the drilling mud to carry back those drill bit cuttings to the surface.
- Equivalent Circulating Density (ECD): Equivalent Circulating Density (ECD) typically increases with the increase in Yield Point (YP) value.
- Borehole Cleaning: As explained earlier that is important to keep the bore hole clean for better penetration rate. So, the higher the diameter of borehole, more should be the Yield Point (YP) value of the drilling mud to support a better cleaning of the borehole.
Yield Point & Drilling Mud Additives
Figures la and b indicate the relationship between PV and specific weight and between YP and specific weight of drilling fluids with solids. The inflection points on these curves reflect the changes in the physicochemical conditions of drilling fluids. From these graphs, one can see that both PV and YP are related to the same important property of drilling fluid (i.e., density). Consequently, YP values can be plotted as a function of PV.
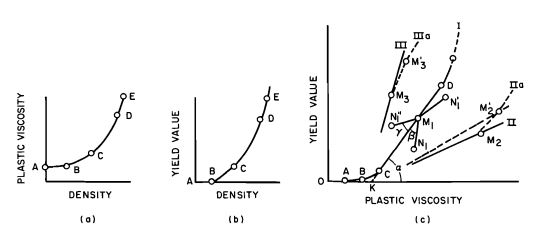
Figure I shows such a relationship between YP and PV for an untreated freshwater drilling fluid (curve I), for a stabilized drilling fluid system (curve II), and for a coagulated mud system (curve Ill). The mud-condition angle α decreases with increasing degree of stabilization and increases with increasing degree of coagulation and flocculation.
In the untreated drilling fluid systems (Figure I, curve 1), point M1 moves upward along the curve with increasing clay content. Stabilizers reduce YP, as point M1 shifts to N1. The effectiveness of treating agents depends on the stabilization length (M1N1) and on the stabilization angle β. The degree of stabilization depends on both the type and effectiveness of the stabilizer and on the clay content in the system. The stabilization length depends on the number of chemicals introduced.
Higher-molecular-weight agents appear to result in greater stabilization angle. All other variables remaining the same, the stabilization angle increases in the presence of higher clay content. Point M1 moves along the MINI line with the addition of low-molecular-weight additives, such as soda ash.
Coagulated drilling fluid systems are characterized by smaller values of stabilization distance OK and by greater mud-condition angle α, which means a higher YP/PV ratio. With the addition of coagulating agent, point M1 moves to point N1. In this case, the degree of coagulation is measured by coagulation angle γ and coagulation length (M1N1).
- In addition of water or stabilizer, the shift of point M3 on curve III (Figure Ic) is similar to the shift of point MI under the same conditions.
- On addition of clay, curve III shifts toward untreated mud (curve IlIa) and point M3 moves to M’3, because increasing clay content causes reduction of the coagulant concentration per unit volume of clay (solid phase).
Stabilized drilling fluid systems are characterized by a smaller mud-condition angle α, which means a lower YP/PV ratio, and by larger values of stabilization distance OK. The effects of water, stabilizer, or coagulant on a point on curve II are similar to those on the point MI on curve I under the same conditions. Curve II shifts toward untreated mud by the addition of clay (curve lIa), as point M2 moves to M’2 because the addition of clay results in lowering the concentration of stabilizing agent per unit volume of clay.
The writers conducted extensive experiments on evaluating the utility of PV-versus- YP curves. Both freshwater and saltwater muds were tested using various proportions of clays, weighting materials, dispersants, and coagulants. Responses of PV-versus-YP curves to various additives were then evaluated.
Effect of Barite on Bentonite Mud
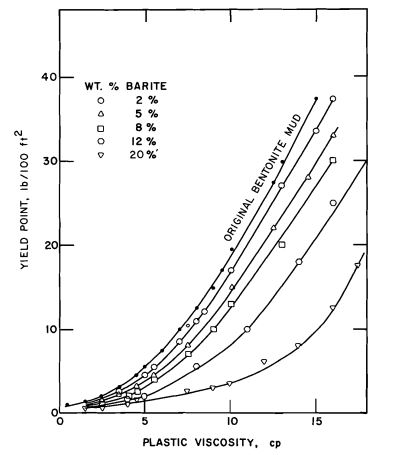
mud to various concentrations of barite (2%,5%,8%, 12%, and 20%).
Each one of the curves represents constant concentration of barite-2%, 5%, 8%, 12%, and 20%. The concentrations of bentonite clay were the same as those of the reference curve. The addition of barite does not appear to change appreciably the mud-condition angle α. The curves shift to the right with increasing concentration of barite due to the increase of plastic viscosity with increasing solids content.
Effects of Thinners on Bentonite Mud
Four different types of thinners have been tested by the writers:
- SAPP (sodium acid pyrophosphate)
- Ferrochrome lignosulfonate (Q-Broxin)
- Lignosulfonate
- Lignite
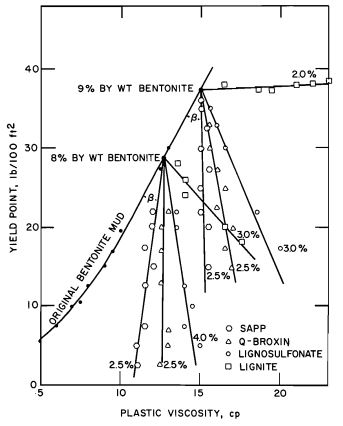
The resulting PV-versus-YP curves are parallel (same YP/PV slope). Both PV and YP increased with increasing concentrations of Ca(OHlz. The YP increased appreciably
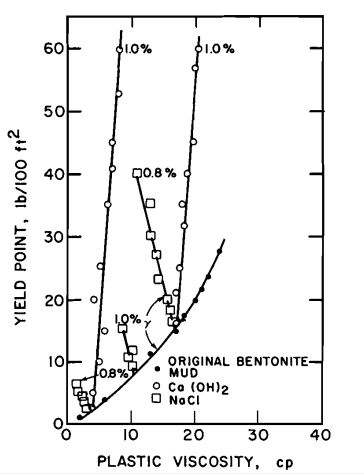
and NaCl, as demonstrated on PV-versus-YP plot.
The slopes of three lines were equal, with only a slight decrease in Pv. Coagulation angle γ is larger for Ca(OH)z than for NaCl, because Ca(OH)2 has greater flocculation power than NaCI.
Effect of Impermex and Carboxymethylcellulose on Salt-Saturated Mud
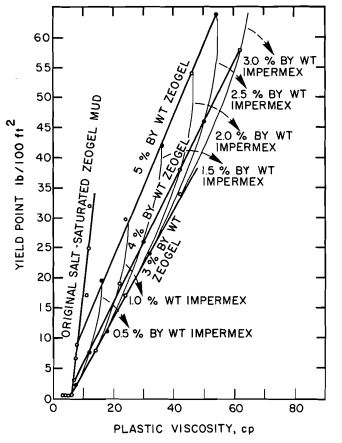
Both PV and YP increase with increasing concentration of starch; the YP/PV slope remains constant. Because of better stabilization, the mud-condition angle α decreases on adding starch to saltwater Zeogel mud.
References:
- Yield Point of Drilling Fluids. 2021. https://www.drillingformulas.com/
- What is Yield Point (YP)? 2021. https://www.trenchlesspedia.com/
- Drilling Fluid Evaluation Using Yield Point-Plastic Viscosity Correlation