Pulsed neutron logging can help identify hydrocarbons remaining in a formation behind casing. It does not, by itself, establish that those hydrocarbons will move into the well at a useful rate. A saturation interpretation describes pore occupancy; producibility also depends on connected flow paths, fluid behavior and reservoir pressure. That distinction should remain visible from the first candidate review to the proposed workover. [1, pp. 2-1–2-3 and 3-17]
The practical question is therefore more specific than whether a log shows “pay.” What measurement supports the saturation estimate? Which rock, water and borehole assumptions could change it? What separate evidence supports production from that interval? This guide follows those questions through capture measurements, carbon/oxygen interpretation and two hypothetical candidates. The wider workover operations guide addresses how a diagnosed opportunity becomes an intervention objective.

What does pulsed neutron logging investigate?
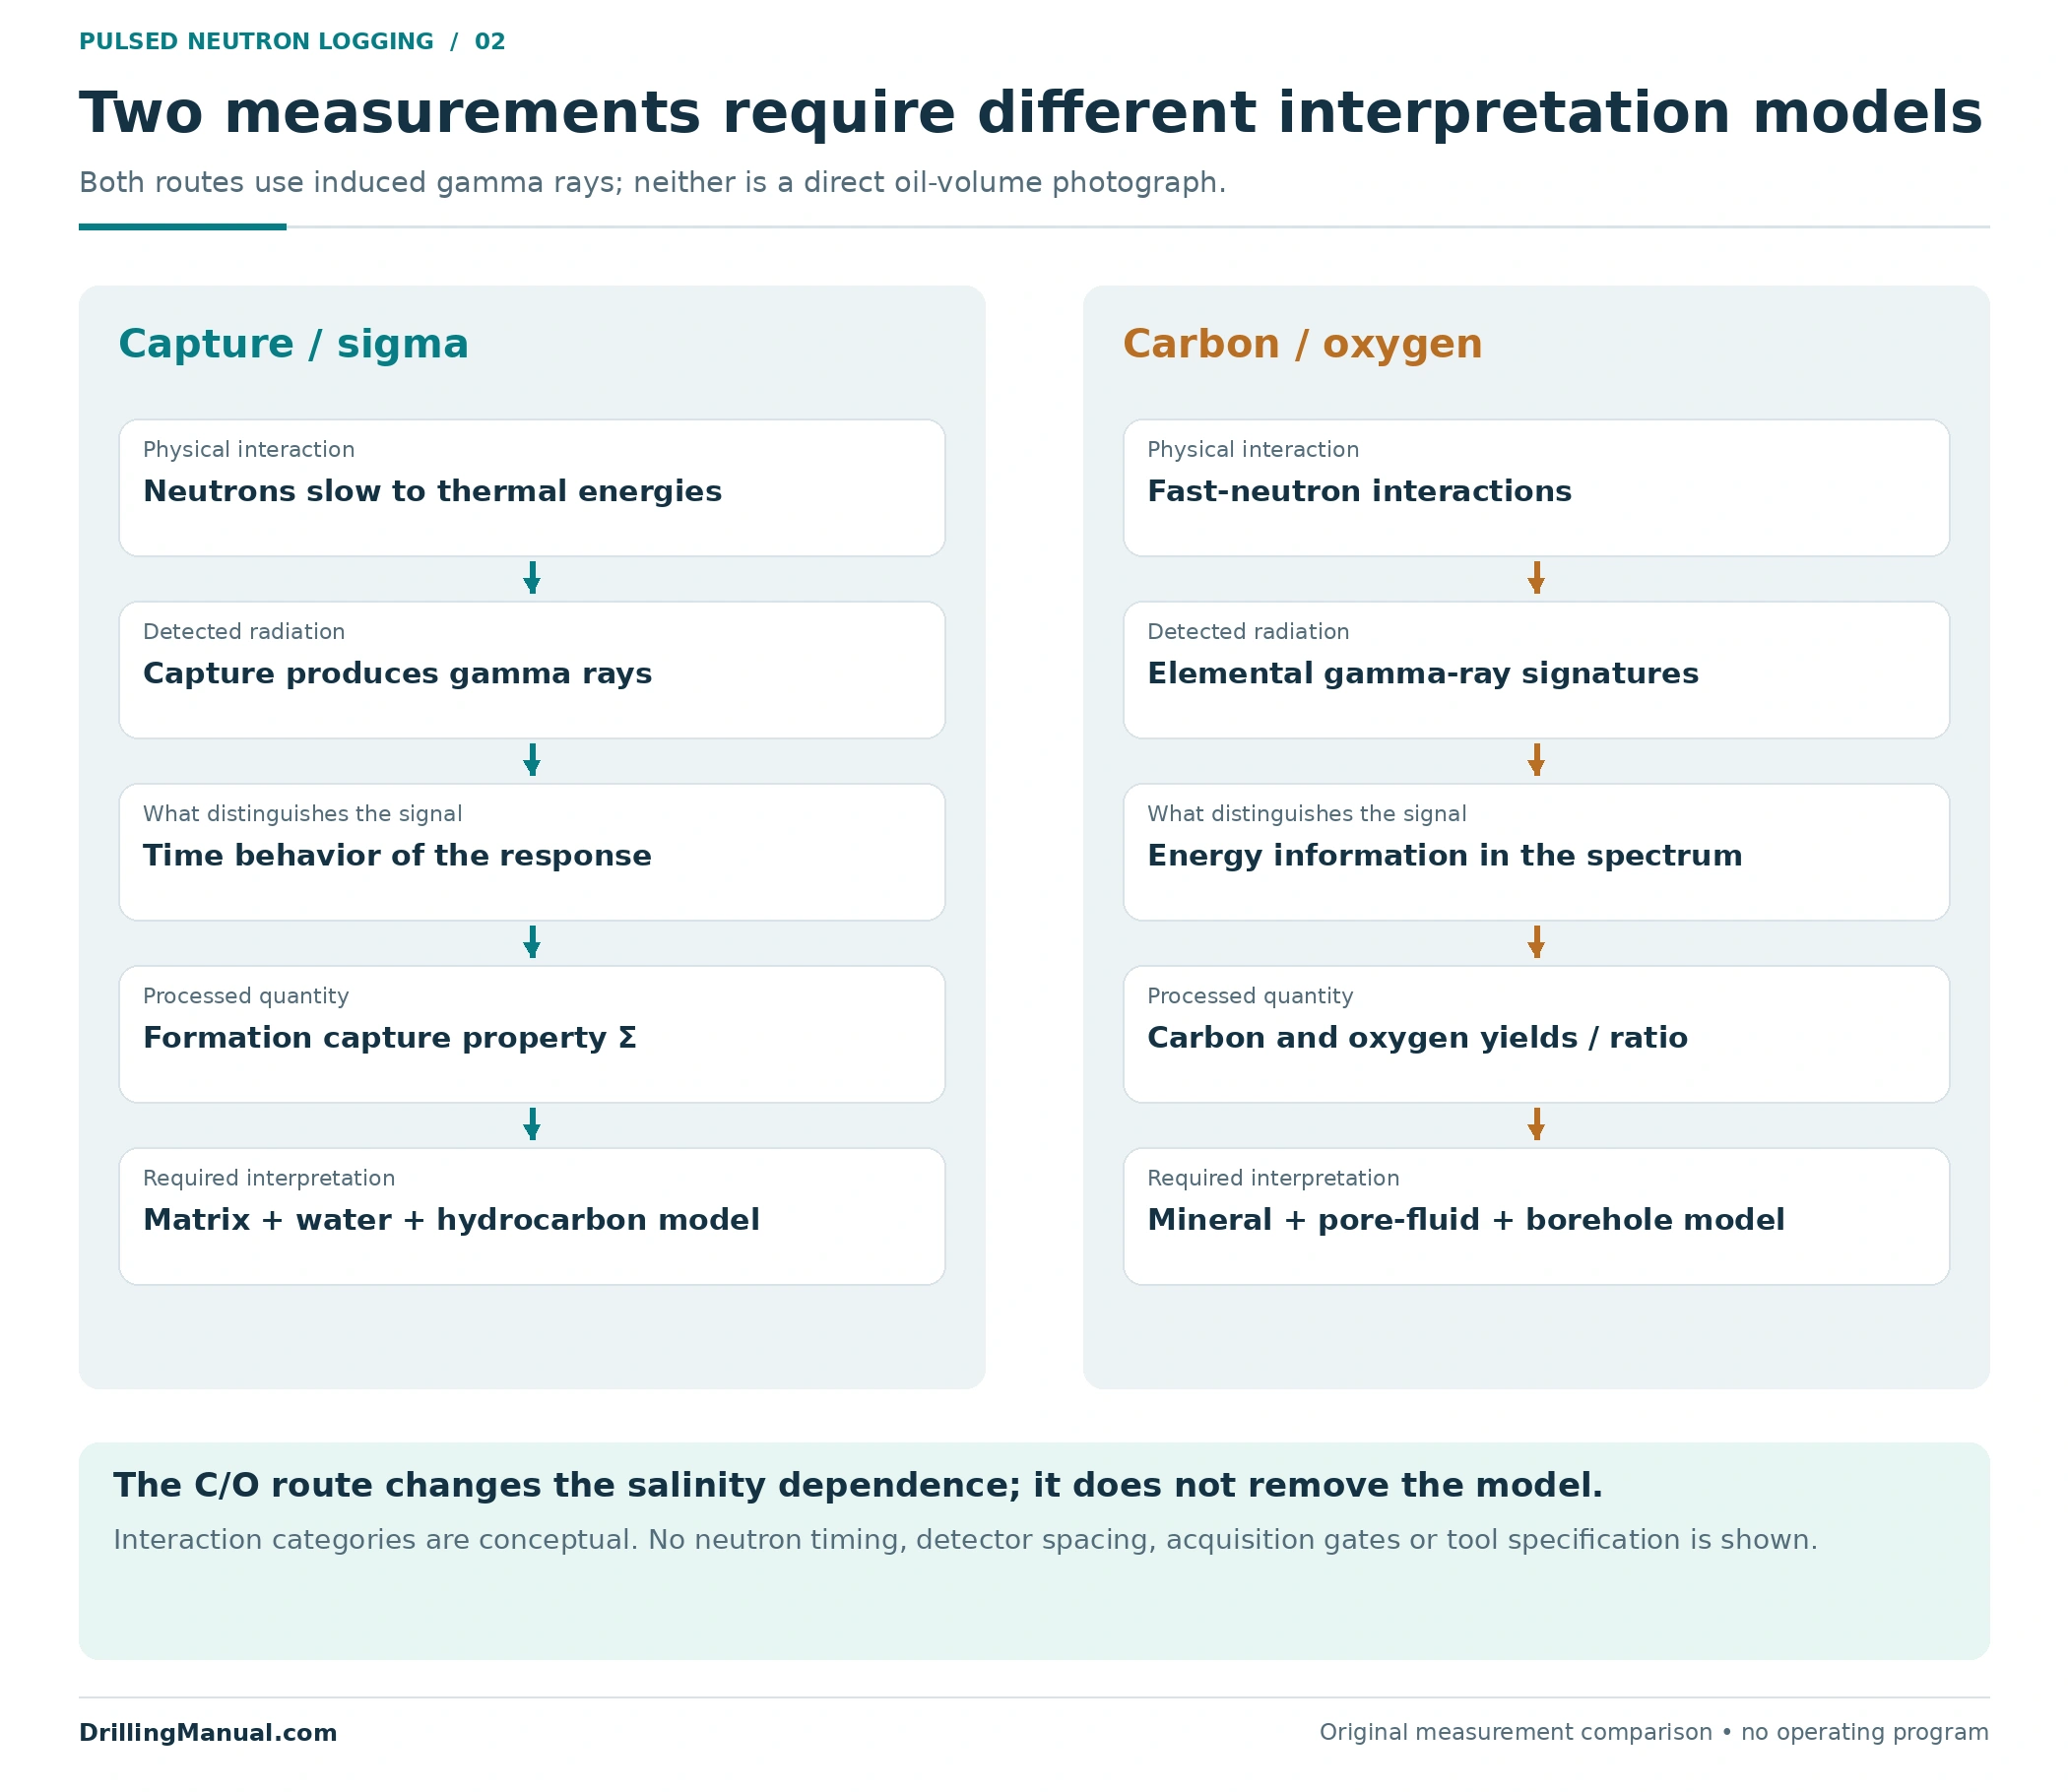
A pulsed source emits bursts of fast neutrons. Their interactions with materials around the tool generate gamma rays. The measurement and processing use the timing or energy of those gamma rays to obtain information about the formation and its fluids. Thermal-decay measurements and carbon/oxygen spectroscopy use different parts of this physical response; they should not be treated as interchangeable names for one saturation curve. [1, pp. 3-17–3-18 and 3-32–3-35]
The target formation lies outside the casing and cement, while the instrument operates in a borehole environment that also contributes to the response. Tool processing and interpretation must distinguish these contributions. Consequently, a clean-looking display is the result of measurement and modeling together, not a direct photograph of oil occupying individual pores. [1, pp. 2-3, 3-19–3-22 and 3-35–3-37]
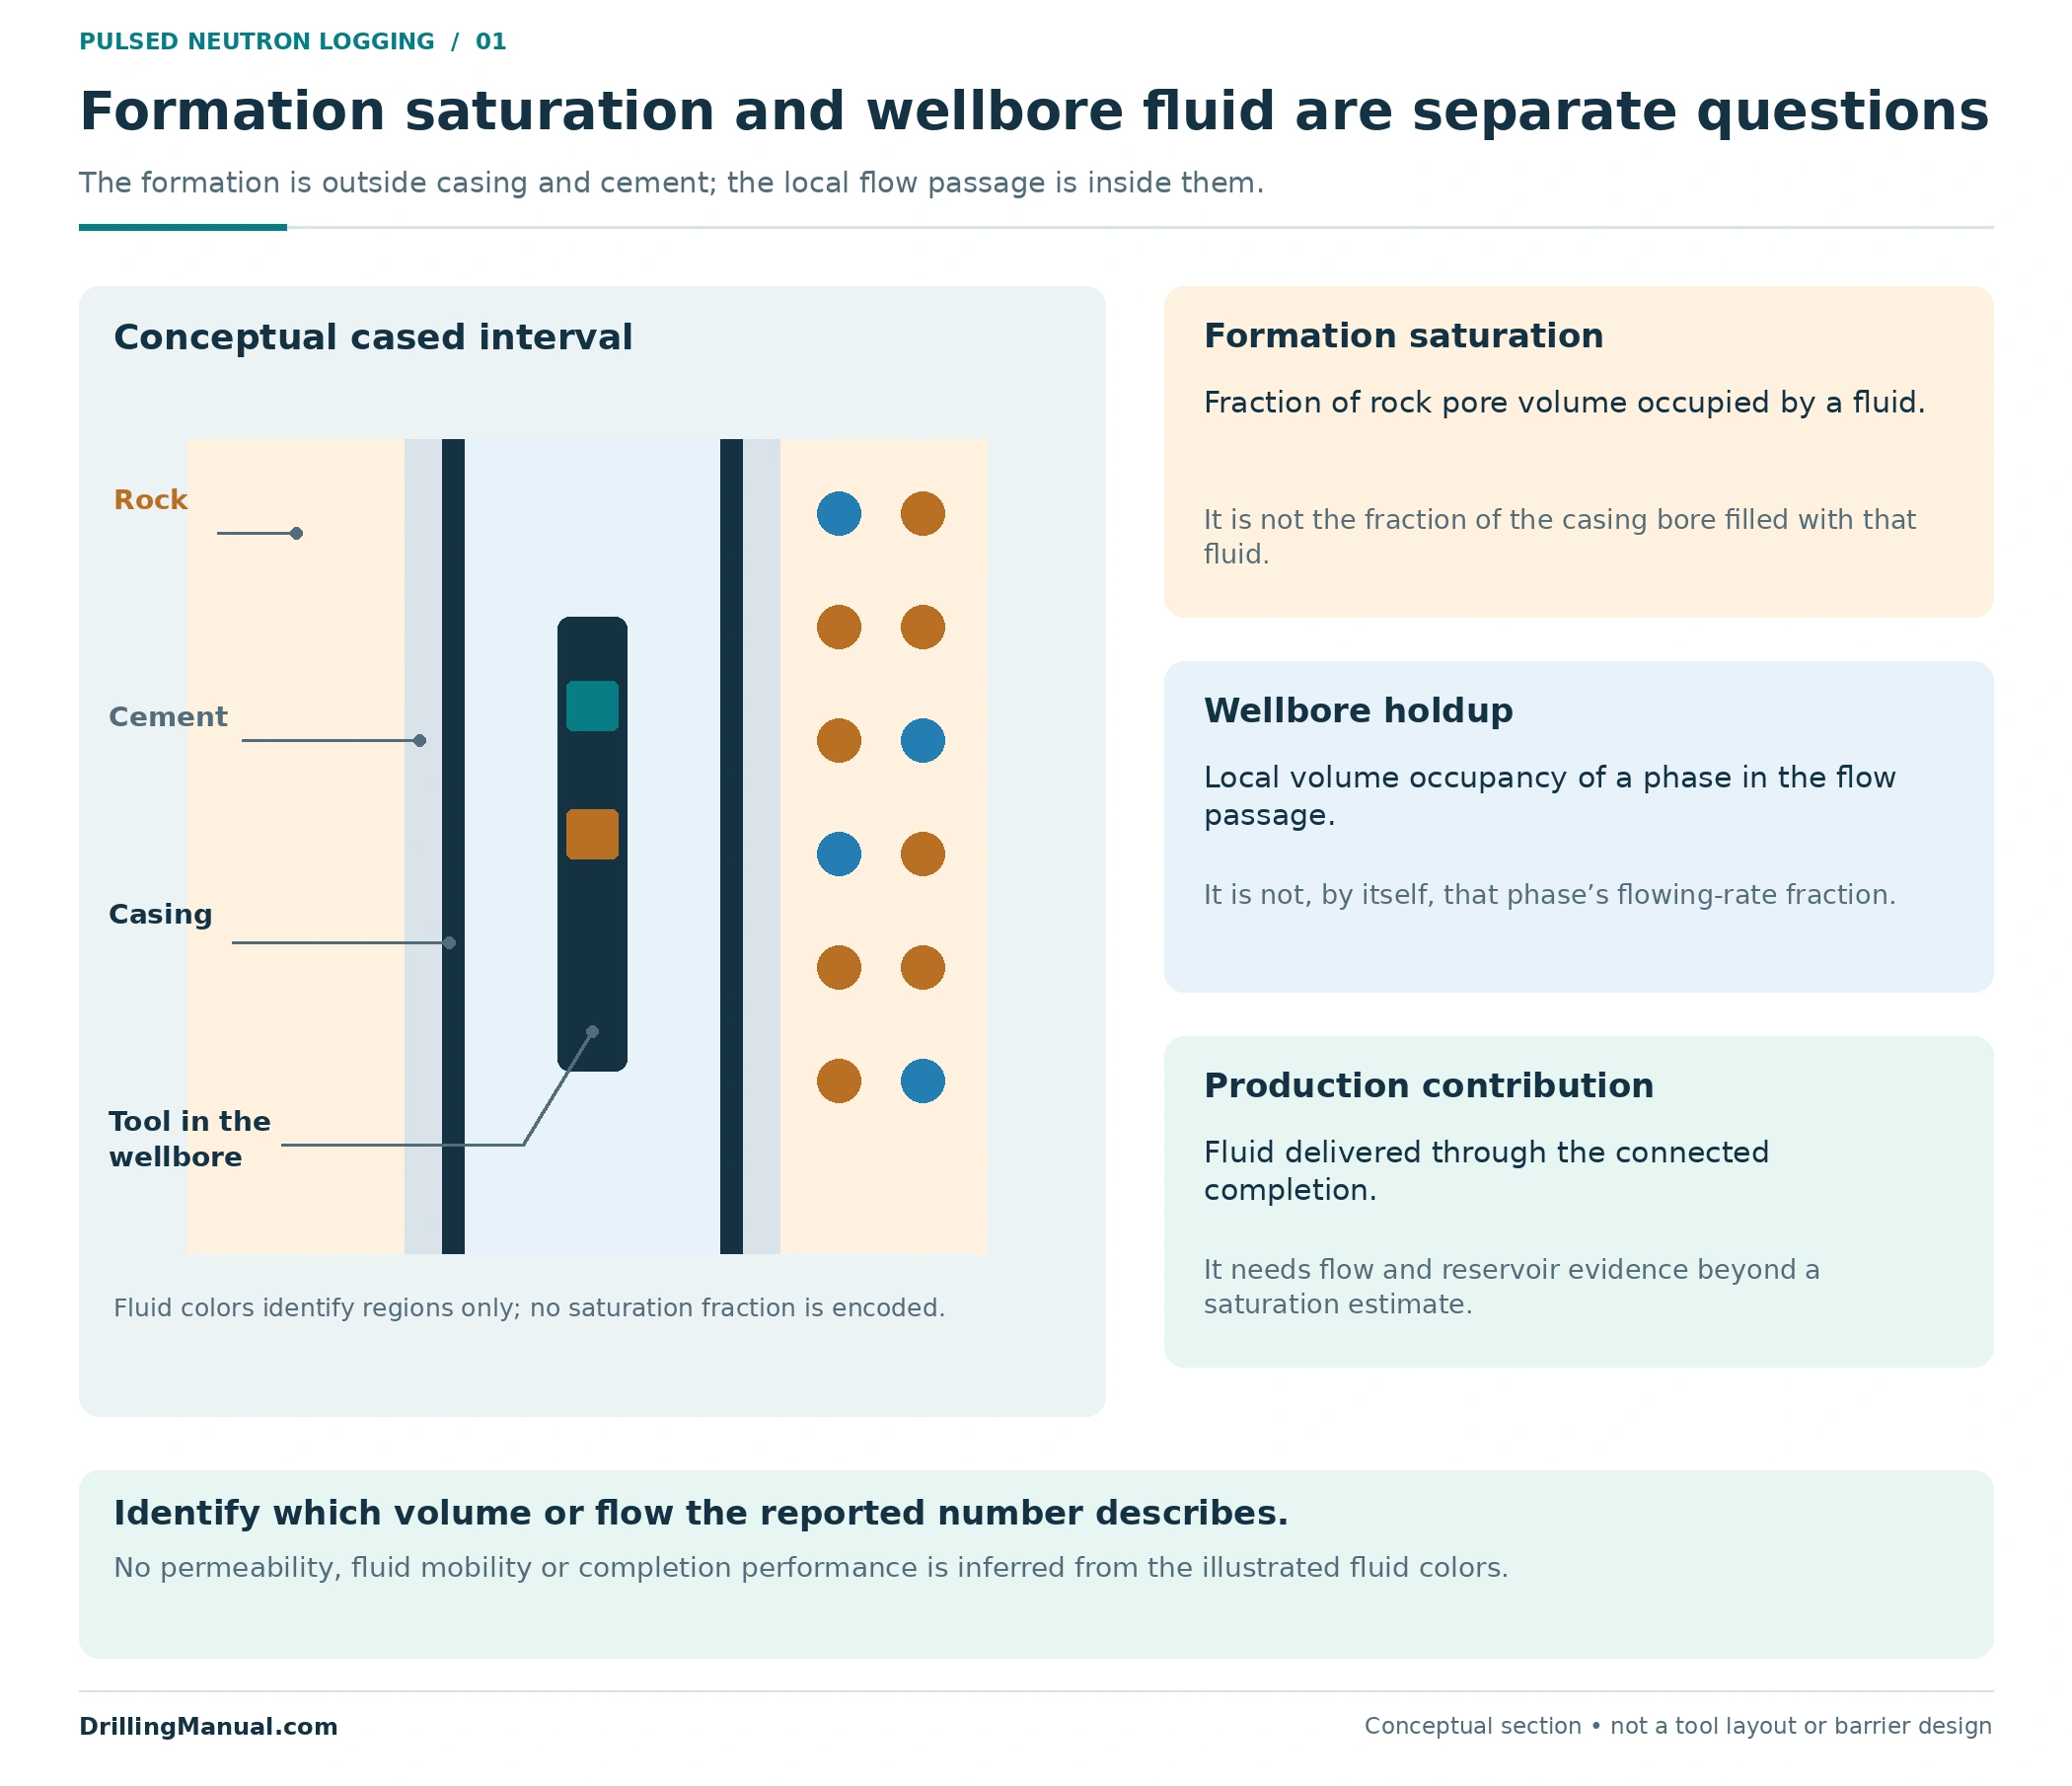
Formation saturation also differs from wellbore holdup. Saturation refers to the portion of rock pore volume occupied by a fluid. Production logging investigates fluid conditions and movement in or near the wellbore. A water-filled flow passage can coexist with hydrocarbon-bearing rock, and an oil-bearing formation need not currently contribute oil through the completion. Keep the formation and flowing-well questions separate before combining their evidence. [1, pp. 2-1–2-2 and 4-1–4-2]
A pulsed neutron logging report should also distinguish pore-volume saturation from hydrocarbon volume per unit of bulk rock. The latter includes porosity as well as saturation. Assessing an accumulation further requires its thickness and area. A large saturation percentage in a thin or low-porosity interval is therefore not, on its own, a measure of the amount recoverable or the value of completing it. [1, pp. 2-1–2-3]
Capture sigma: the water contrast matters
In thermal-decay interpretation, fast neutrons slow to thermal energies and are captured. The associated gamma-ray record describes how the neutron population changes after a burst. Formation capture cross section, usually called sigma and written Σ, expresses the material’s capture behavior. Neutron diffusion also affects the observed decay, so an uncorrected decay measurement cannot simply be identified with intrinsic formation capture. [1, pp. 3-17–3-21]
Chlorine in saline formation water provides a useful contrast with hydrocarbons. However, the inferred water saturation depends on more than chlorine alone. Porosity, the rock matrix, shale, water composition and the hydrocarbon endpoint all enter the interpretation. The book’s clean-formation equation becomes more involved when shale and bound water are included. [1, pp. 3-17, 3-26–3-27 and 3-30–3-31]
For pulsed neutron logging in a waterflooded interval, original connate-water salinity may no longer describe the water around the well. Injected and native waters can mix. A sigma change then needs evaluation against both saturation change and changed water properties. A water sample or another salinity constraint is valuable only to the extent that it represents the interval being interpreted. [1, pp. 3-27 and 3-39–3-40]
That is a reason to examine the origin and timing of the water information. A historical value, a current commingled sample and a zone-specific interpretation are different pieces of evidence. The source’s waterflood example describes mixed waters whose unknown combined salinity prevented the conventional sigma analysis being used. Its lesson is to resolve the relevant fluid input, not to assume that one measured surface salinity describes every candidate interval. [1, p. 3-40]
Pulsed neutron logging example: one sigma, two answers
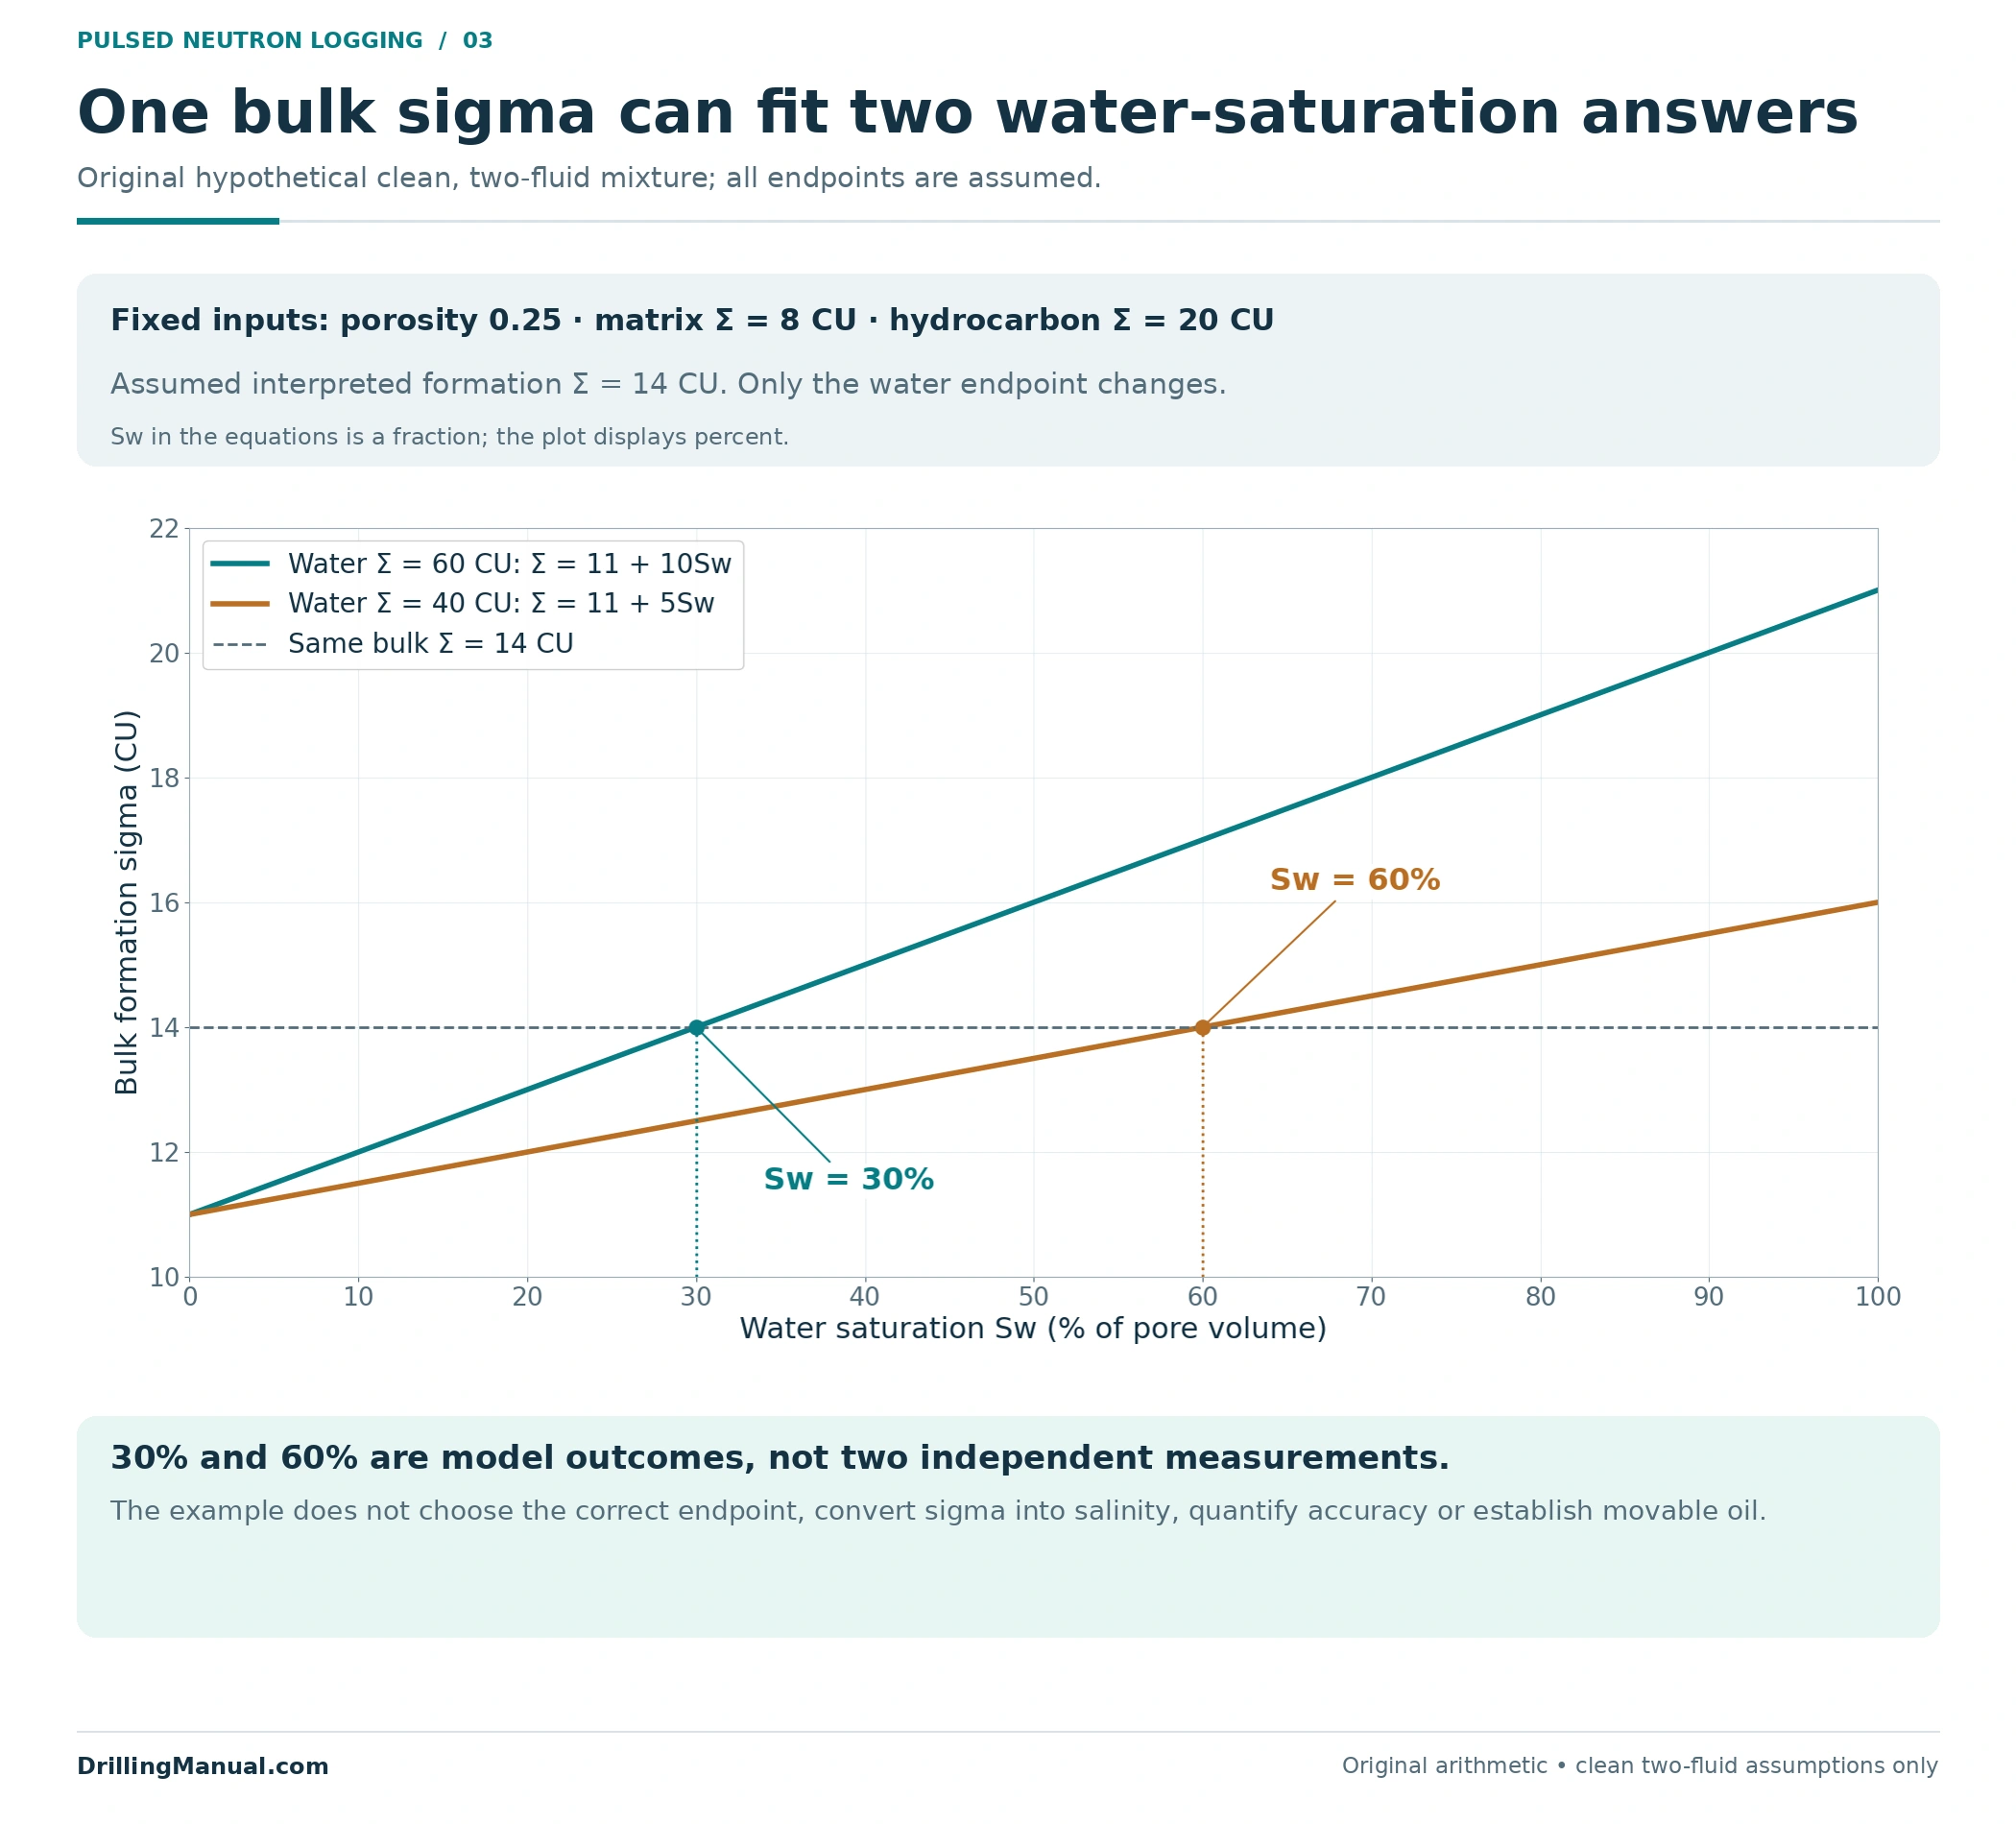
Consider an invented clean formation containing only water and one hydrocarbon phase. Assume porosity is 0.25, matrix sigma is 8 capture units (CU), hydrocarbon sigma is 20 CU and the interpreted bulk formation sigma is 14 CU. These are teaching inputs, not a recommended set of endpoints or a calibration for any logging tool. The arithmetic applies the book’s volume-weighted clean-formation model. [1, p. 3-27, Eq. 3-17]
Σ = (1 − φ)Σmatrix + φ[SwΣwater + (1 − Sw)Σhydrocarbon]
Here, φ is porosity and Sw is the water fraction of pore volume. Holding the other assumed inputs fixed gives two different saturation answers when the water endpoint changes:
| Assumed water sigma | Mixture equation | Calculated water saturation |
|---|---|---|
| 60 CU | 14 = 11 + 10Sw | 0.30, or 30% |
| 40 CU | 14 = 11 + 5Sw | 0.60, or 60% |
The same bulk measurement is consistent with either result under its respective assumptions. The calculation does not determine which water endpoint is correct. It also does not convert either endpoint to a particular salt concentration, quantify uncertainty or establish producibility. Its purpose is to expose an input that can materially alter the candidate assessment.
Low contrast creates a related difficulty: as water and hydrocarbon capture properties approach one another, saturation changes produce less separation in the mixture response. The source specifically requires sufficient contrast for capture-based water-saturation evaluation. Reporting extra decimal places cannot replace that physical sensitivity. [1, pp. 3-27 and 3-39]
Carbon/oxygen interpretation changes the question
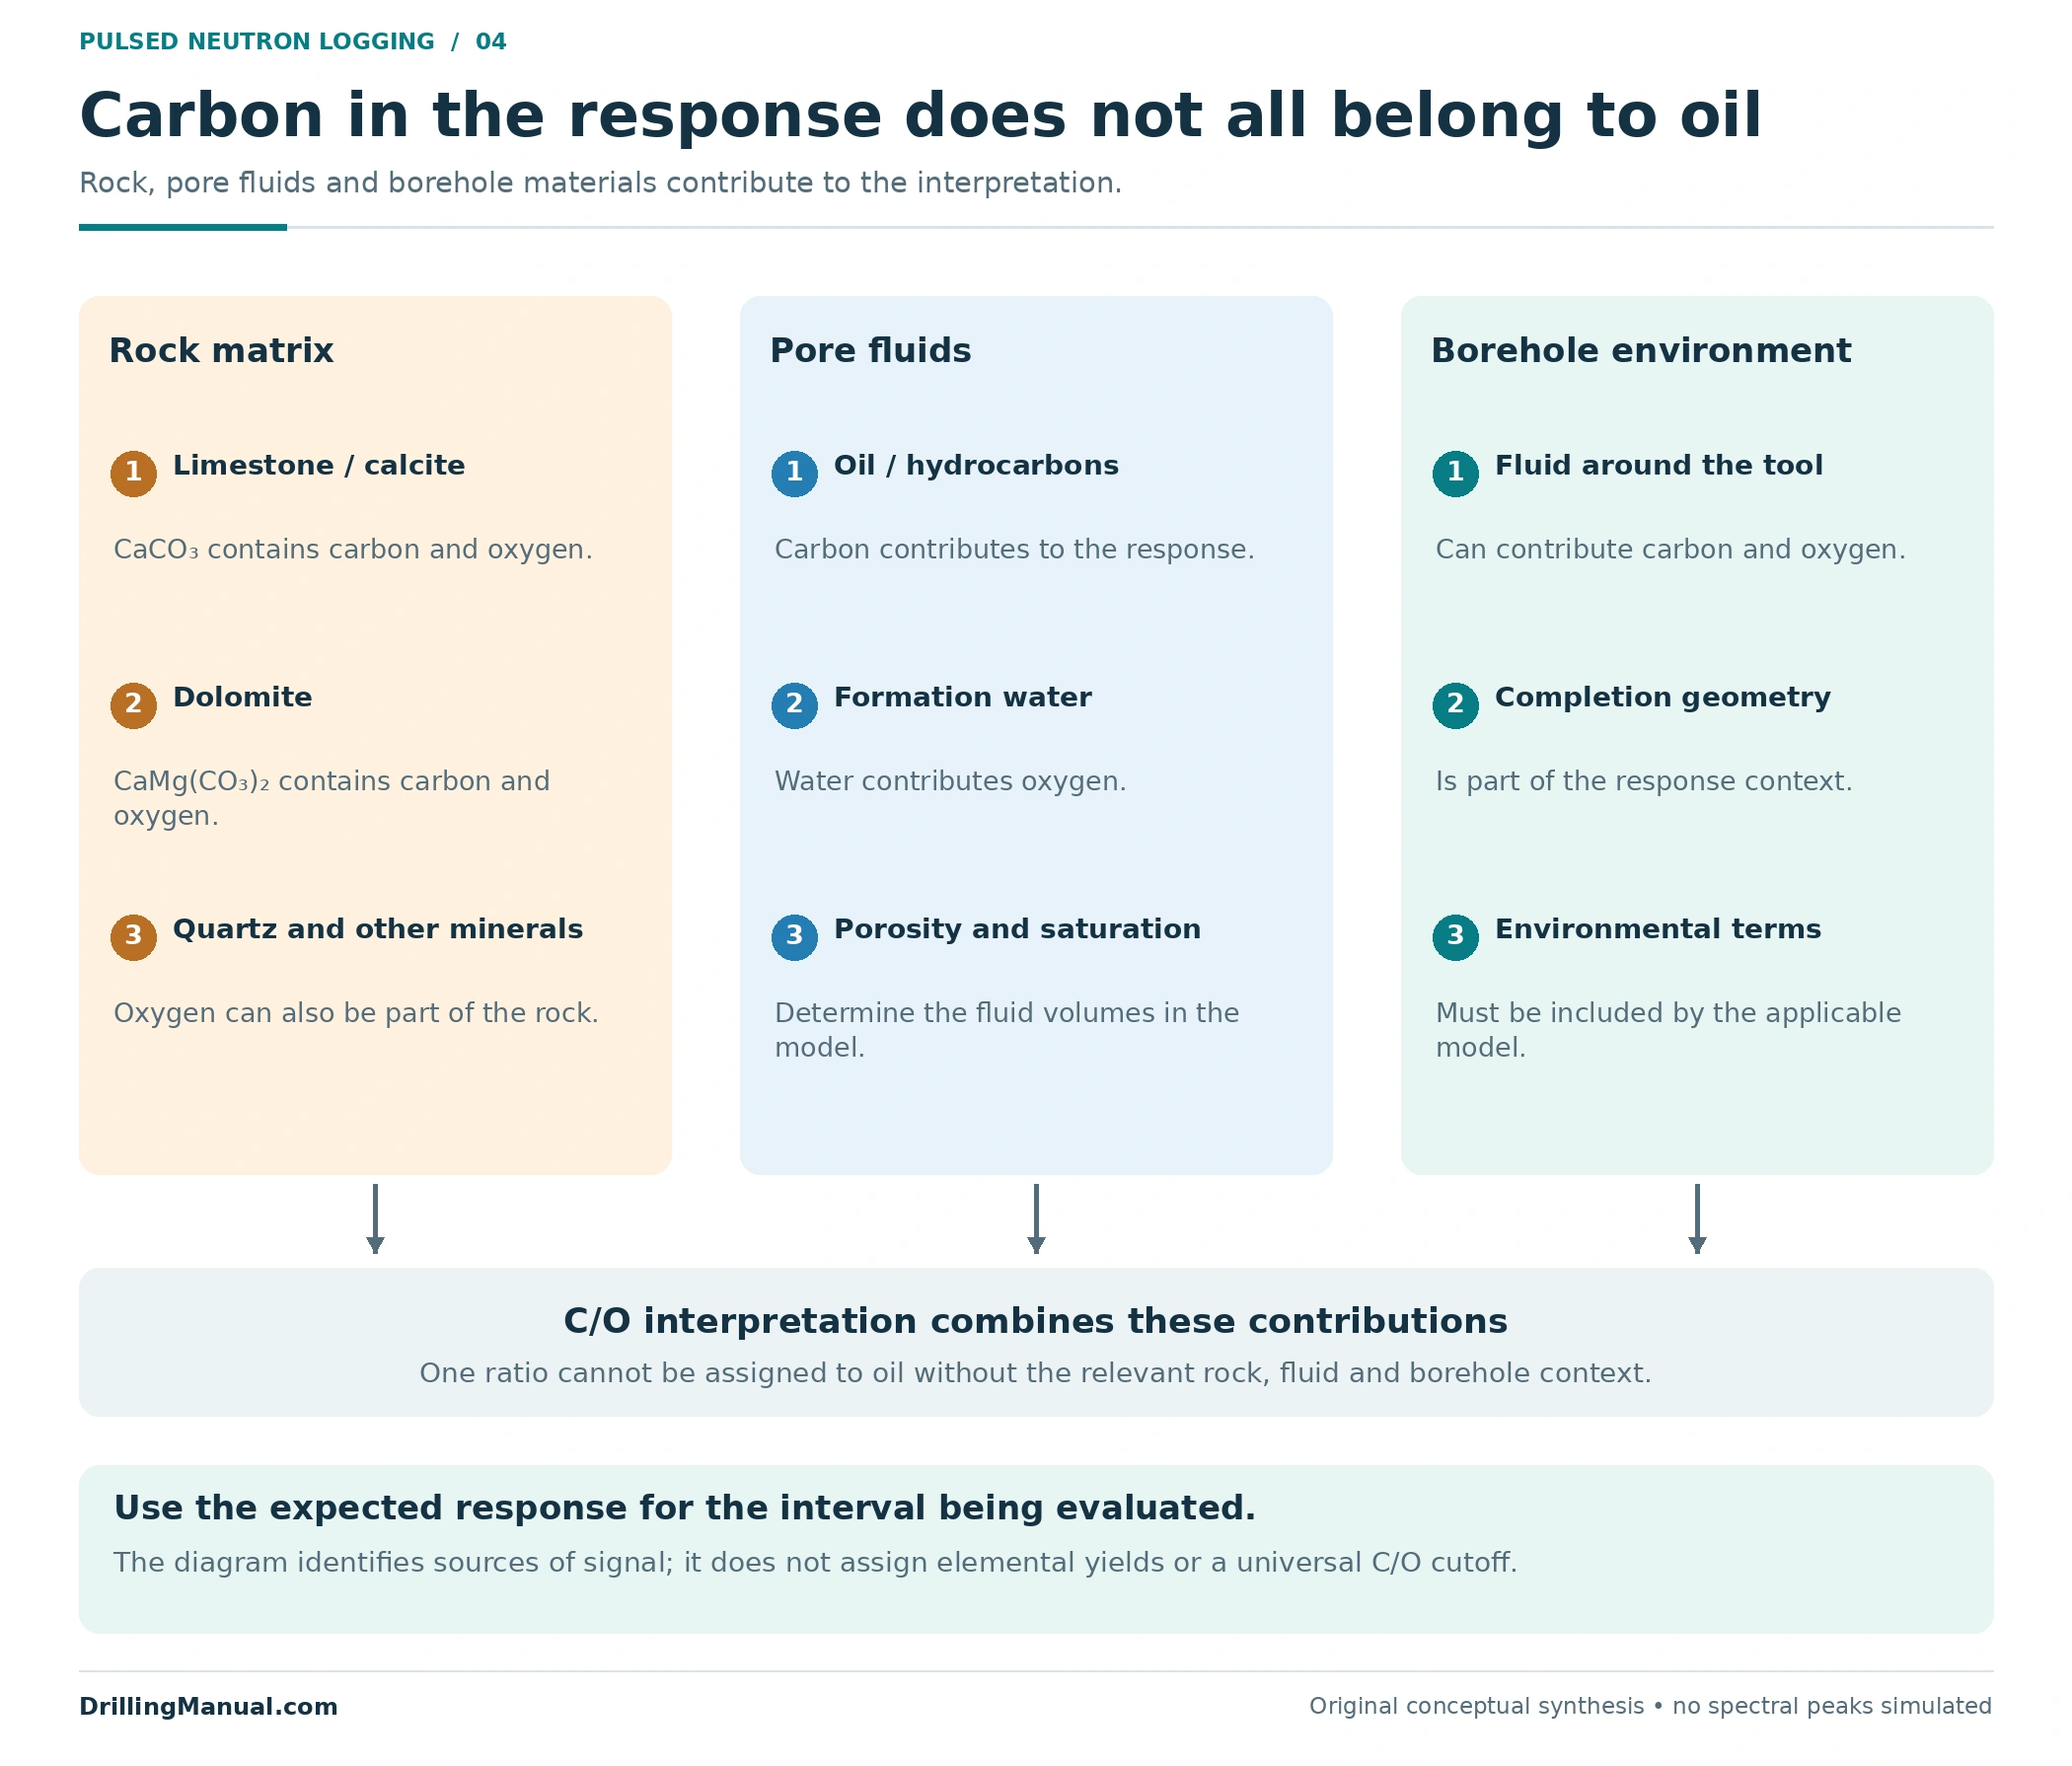
Carbon/oxygen, or C/O, interpretation uses elemental information from fast-neutron interactions. Carbon and oxygen gamma-ray yields help distinguish oil from water without relying on the same saline-water capture contrast. This makes the approach relevant when formation-water salinity is low, uncertain or changing. It does not remove the need for a formation and borehole model. [1, pp. 3-32, 3-34–3-37 and 3-39–3-40]
Carbon is present in hydrocarbon fluids, but also in carbonate minerals. Oxygen occurs in both fluids and rock. The book’s C/O response equation therefore includes matrix contributions, pore-fluid contributions and borehole terms. A high carbon-related response cannot be assigned entirely to oil without accounting for lithology and porosity. [1, pp. 3-35–3-37]
This distinction is especially relevant when a candidate crosses limestone, dolomite, sandstone or shale. The expected water-filled and oil-filled responses change with the modeled material. The source even cautions that simple interpolation between C/O endpoints is only a quick estimate because the underlying equation is not strictly linear in water saturation. A single generic C/O cutoff is therefore inappropriate here. [1, pp. 3-37 and 3-40]
| Interpretation route | Useful basis | Question that remains |
|---|---|---|
| Capture sigma | Capture contrast among matrix, water and hydrocarbons | Are water properties, porosity, shale and fluid endpoints adequately constrained? |
| C/O spectroscopy | Elemental response interpreted with mineral and fluid contributions | Does the model account for rock carbon, porosity and borehole contributions? |
| Combined assessment | Comparison of complementary measurements and supporting logs | Do differences reveal an incorrect assumption, different sensitivity or unresolved data quality? |
Agreement can support an interpretation when the inputs are sound. Disagreement deserves explanation rather than automatic preference for whichever curve shows more oil. Pulsed neutron logging is most useful when the report preserves that reasoning alongside the final saturation track. [1, pp. 3-32 and 3-36–3-40]
Also identify inputs shared by the two calculations. If capture and C/O interpretations both use the same porosity or mineral model, their agreement does not independently verify that shared input. This is a direct implication of the response equations: different measurements can still inherit a common interpretation error. Comparing the assumptions is therefore part of comparing the answers, especially where the available openhole information is limited. [1, pp. 3-27 and 3-36–3-38]
Which conditions can change the interpretation?
The measurement environment includes casing, cement and borehole fluid as well as formation. The historical tools in the reference handle these influences through different timing, detector and processing approaches. Their specific corrections, accuracy examples and operating envelopes are not universal specifications for other tools. For a candidate evaluation, identify the actual measurement and the environmental assumptions behind its processed output. [1, pp. 3-19–3-24 and 3-35–3-37]
Gas deserves separate attention. Some neutron-count behavior can be influenced by gas, porosity and lithology in ways that create ambiguous appearances. The source illustrates an interval that could resemble a gas effect on one comparison while supporting measurements indicate a different rock and porosity explanation. Do not transfer a two-liquid saturation model unchanged to a case with unresolved gas. [1, pp. 3-25–3-26]
Shale also changes the problem. Bound water and free formation water need not have identical salinity, and dry-clay constituents can contribute capture response. A shale correction is therefore more than subtracting a fixed water fraction from every interval. The interpretation should state which porosity and water volumes its reported saturation represents. [1, pp. 3-30–3-31 and 3-38–3-39]

Compare pulsed neutron logging surveys on a common basis
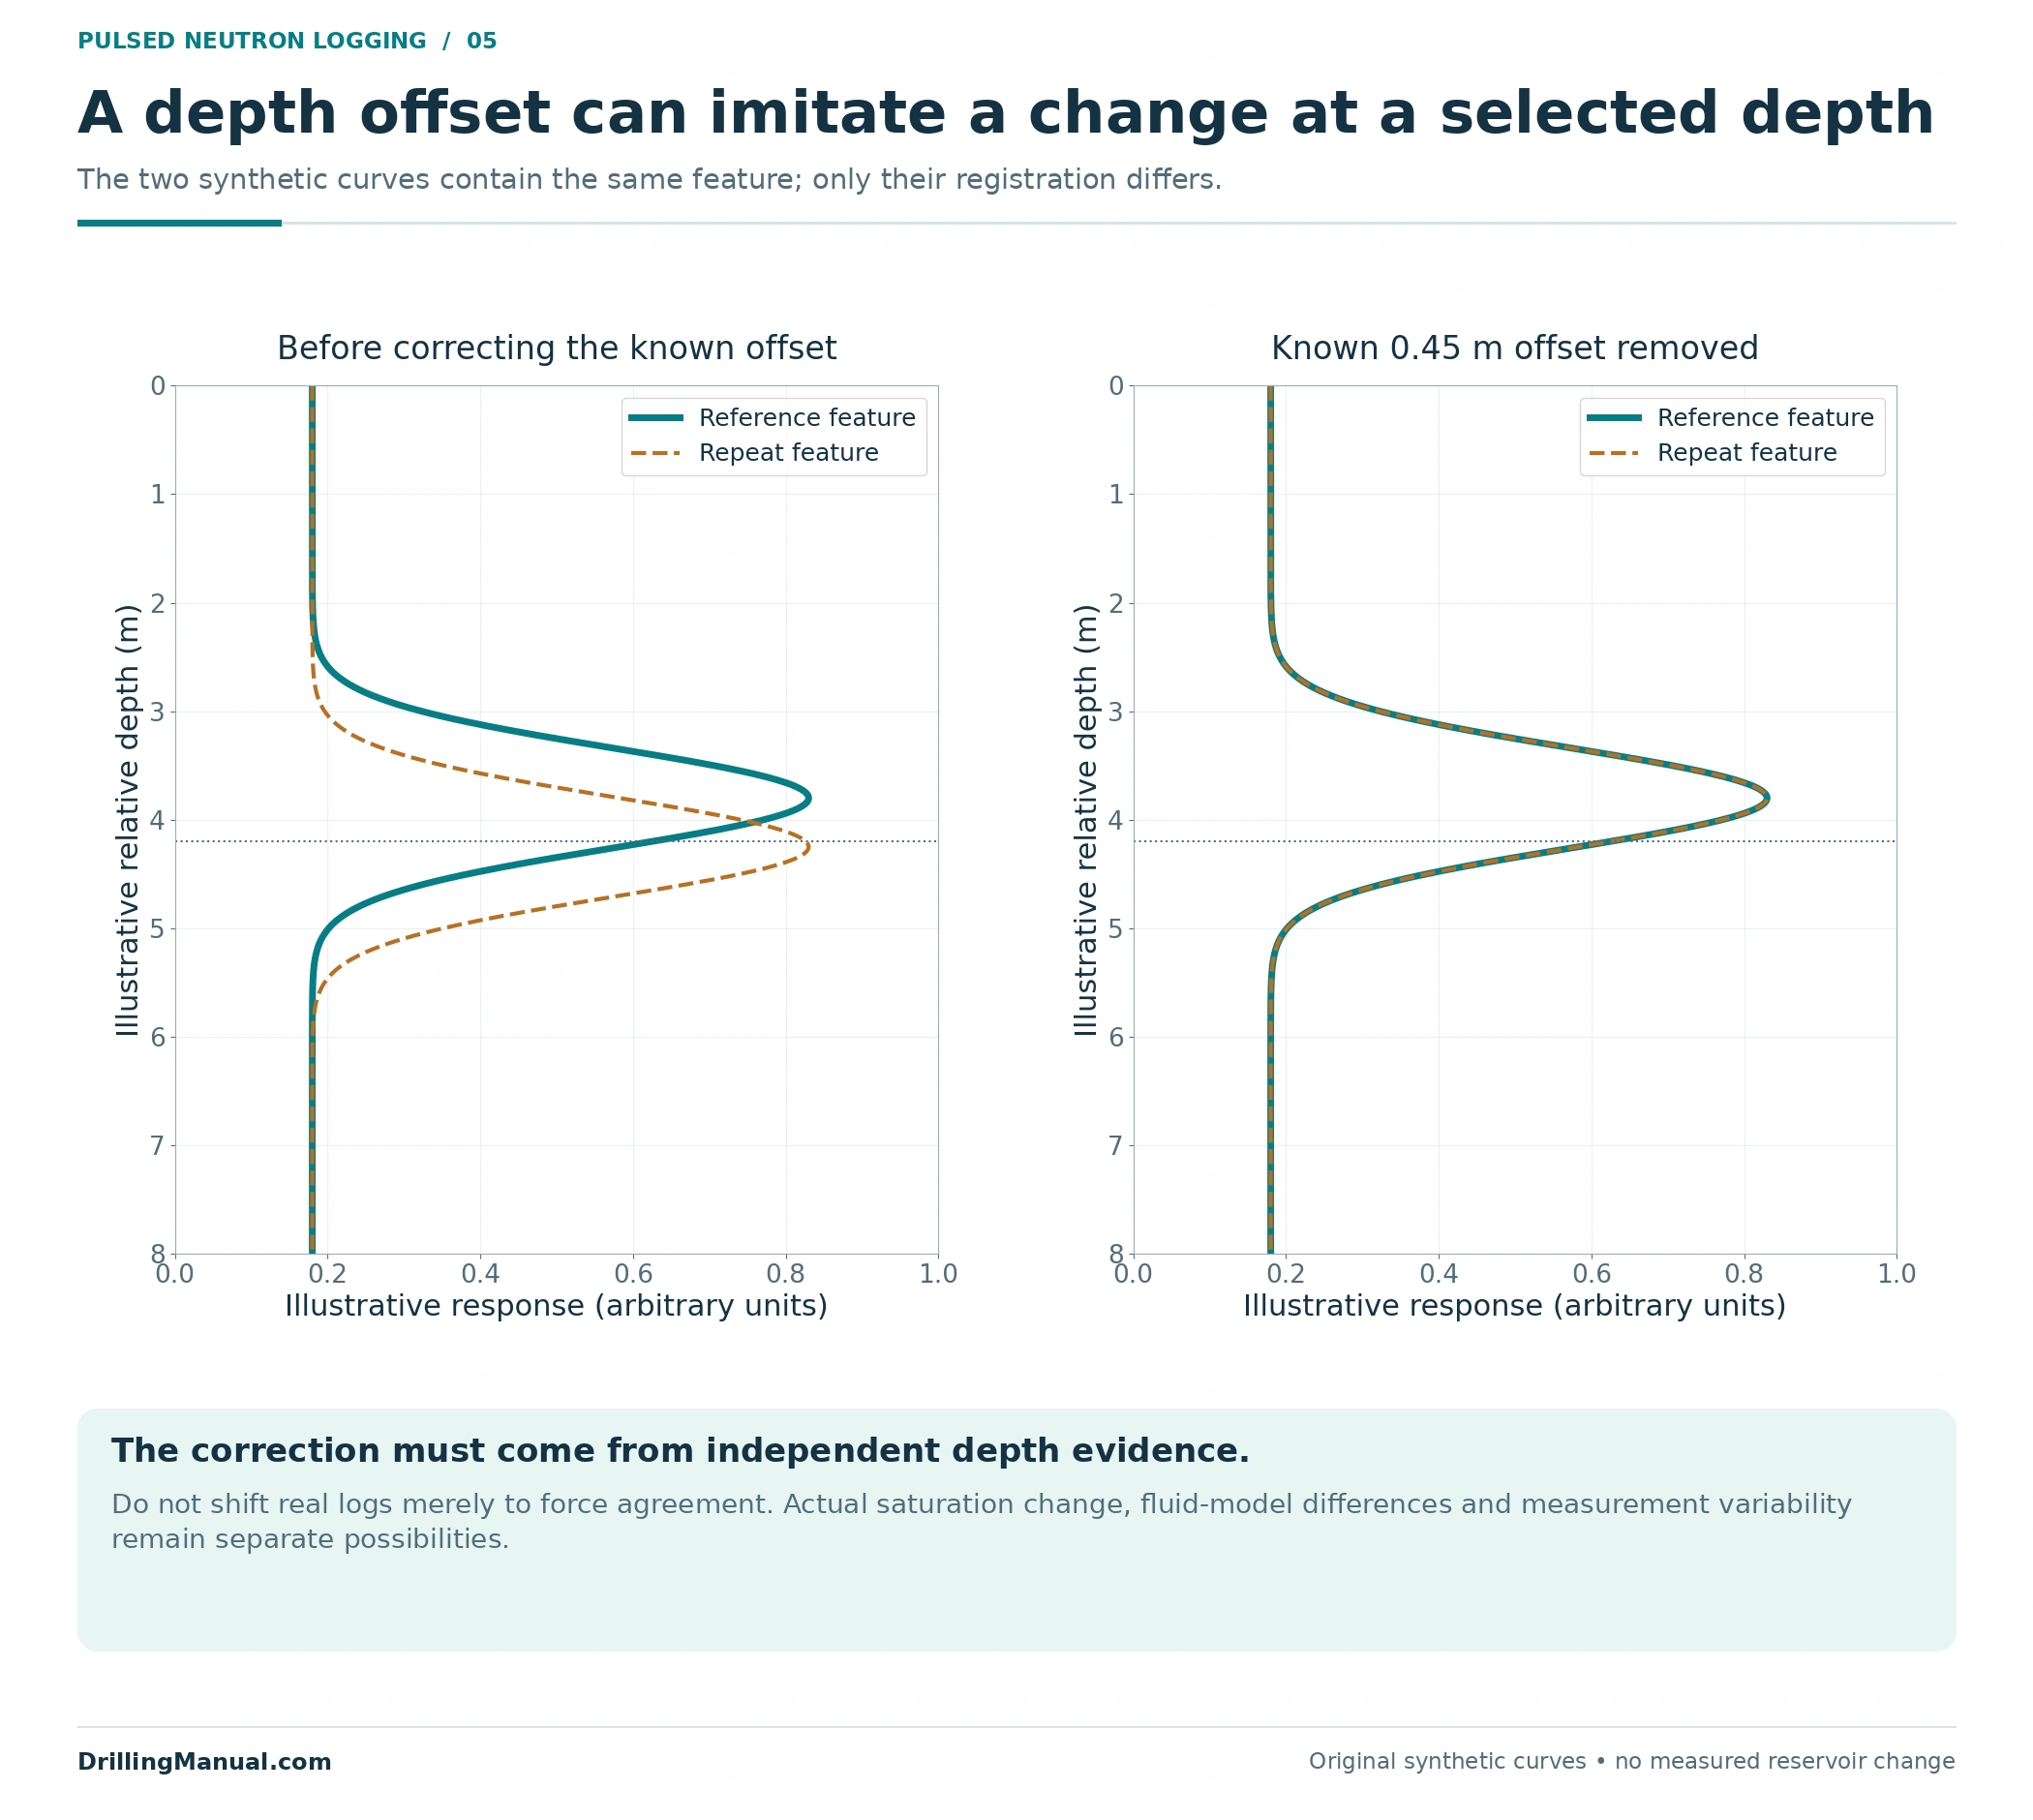
A repeat survey can help investigate depletion or waterfront movement, but two curves must describe comparable locations and measurement conditions before their difference is interpreted. Depth mismatch, tool orientation, statistical variation and processing choices can affect repeatability. The book also describes the tradeoff between stronger vertical averaging and the ability to resolve thin intervals. [1, pp. 3-17 and 3-23–3-24]
Repeatability and interpretation adequacy answer different questions in pulsed neutron logging. Closely agreeing passes support consistency of the measured response under the compared conditions. They do not establish that the chosen water composition or lithology is correct. Conversely, an unstable measurement can weaken confidence even when the geological model is reasonable. A review needs both measurement-quality evidence and an explanation of the model, rather than using either as a substitute for the other. [1, pp. 3-23–3-24 and 3-27]
Record the depth reference, well configuration, fluid context and processing basis with each survey. The separate guide to casing collar locator logs explains the reference-to-depth relationship. A saturation comparison still needs its own measurement and interpretation review; locating a curve accurately does not validate its fluid model. [1, pp. 3-22–3-24]
The original display example below shifts an otherwise identical synthetic feature along depth. It shows how a known registration error can create an apparent difference at a chosen depth. It is not permission to shift real logs until they match: the correction needs independent depth evidence, and genuine reservoir change must remain available as an explanation.
For pulsed neutron logging comparisons, retain the original measurements and the assumptions used to derive each saturation result. If salinity, lithology treatment or smoothing changed, explain the effect before labeling the difference as swept oil. A consistent curve format does not establish a consistent interpretation basis. [1, pp. 3-23–3-24, 3-30–3-32 and 3-39–3-40]
Two candidates for pulsed neutron logging follow-up
Consider two invented intervals in one candidate-review exercise. These descriptions are not measured well results, commercial cutoffs or forecasts. They apply the book’s separation between saturation, permeability and production conditions, and its cautions about water and mineral inputs. [1, pp. 2-1–2-3, 3-27 and 3-35–3-40]
| Candidate | Available evidence | Defensible conclusion | Unresolved production question |
|---|---|---|---|
| A: clean interval with constrained water properties | Repeatable capture result; supported porosity and matrix inputs; an interpreted hydrocarbon saturation of 45% | The stated model supports hydrocarbons remaining in pore space. | Are they mobile under the available pressure conditions, and can the completion obtain useful inflow? |
| B: mixed lithology with uncertain floodwater mixing | Carbon-related response; uncertain mineral contribution and changing water composition | A quantitative saturation conclusion still needs a defensible rock/fluid interpretation. | After resolving saturation, what evidence would establish mobility and a useful production connection? |
Candidate A has a more complete saturation argument, not an automatic approval to perforate. Some hydrocarbons can remain trapped in pore space, and permeability is not determined solely by how much pore volume exists. Candidate B has an earlier unresolved question: carbon response must first be separated from mineral and borehole contributions. Ranking them by color shading on a log would bypass both distinctions. [1, pp. 2-1–2-3 and 3-35–3-40]
The follow-up for pulsed neutron logging should therefore be tied to the individual candidate. Whole-well production demonstrates the performance of the connected system; it does not allocate that performance to an unopened interval. Where interval-level pressure or flow evidence exists, relate it to the same target and operating condition. Where it does not, keep the proposed production benefit as an unresolved part of the candidate case. [1, pp. 2-1–2-3 and 4-1–4-2]

Build the evidence for an intervention decision
The review should connect the interpreted interval to its reservoir and completion context. Relevant evidence includes reference logs and lithology, porosity, representative water information, known fluid types, pressure and production history, and the current well configuration. These inputs answer different questions; collecting one more saturation curve does not necessarily resolve the missing production evidence. [1, pp. 2-1–2-3, 3-17, 3-27 and 3-32]

If a proposed intervention would open an interval, carry the accepted formation interpretation into the perforation-method selection and completion review. A multiple-zone completion adds questions about how the individual intervals will be connected and evaluated. Neither link turns the saturation result into proof of an effective production path. [1, pp. 1-1 and 2-1–2-3]
If the objective is water shutoff, distinguish water occupying the formation from water actually entering through a particular wellbore path. Production measurements may be needed to establish interval contributions. Similarly, a cement bond log addresses a different measurement question from saturation. These evaluations can inform the same decision while retaining separate limits. [1, pp. 1-1, 2-1–2-2 and 4-1–4-2]
What should the final pulsed neutron logging conclusion say?
A useful conclusion names the interval, measurement route, interpretation model and inputs that materially influence the answer. It then separates what is supported from what remains uncertain. For example: the model supports remaining hydrocarbons, the result is sensitive to the water endpoint, or the C/O interpretation still depends on an unresolved carbonate contribution. Those statements are more useful than an unexplained “pay” label. [1, pp. 2-3, 3-27 and 3-35–3-40]

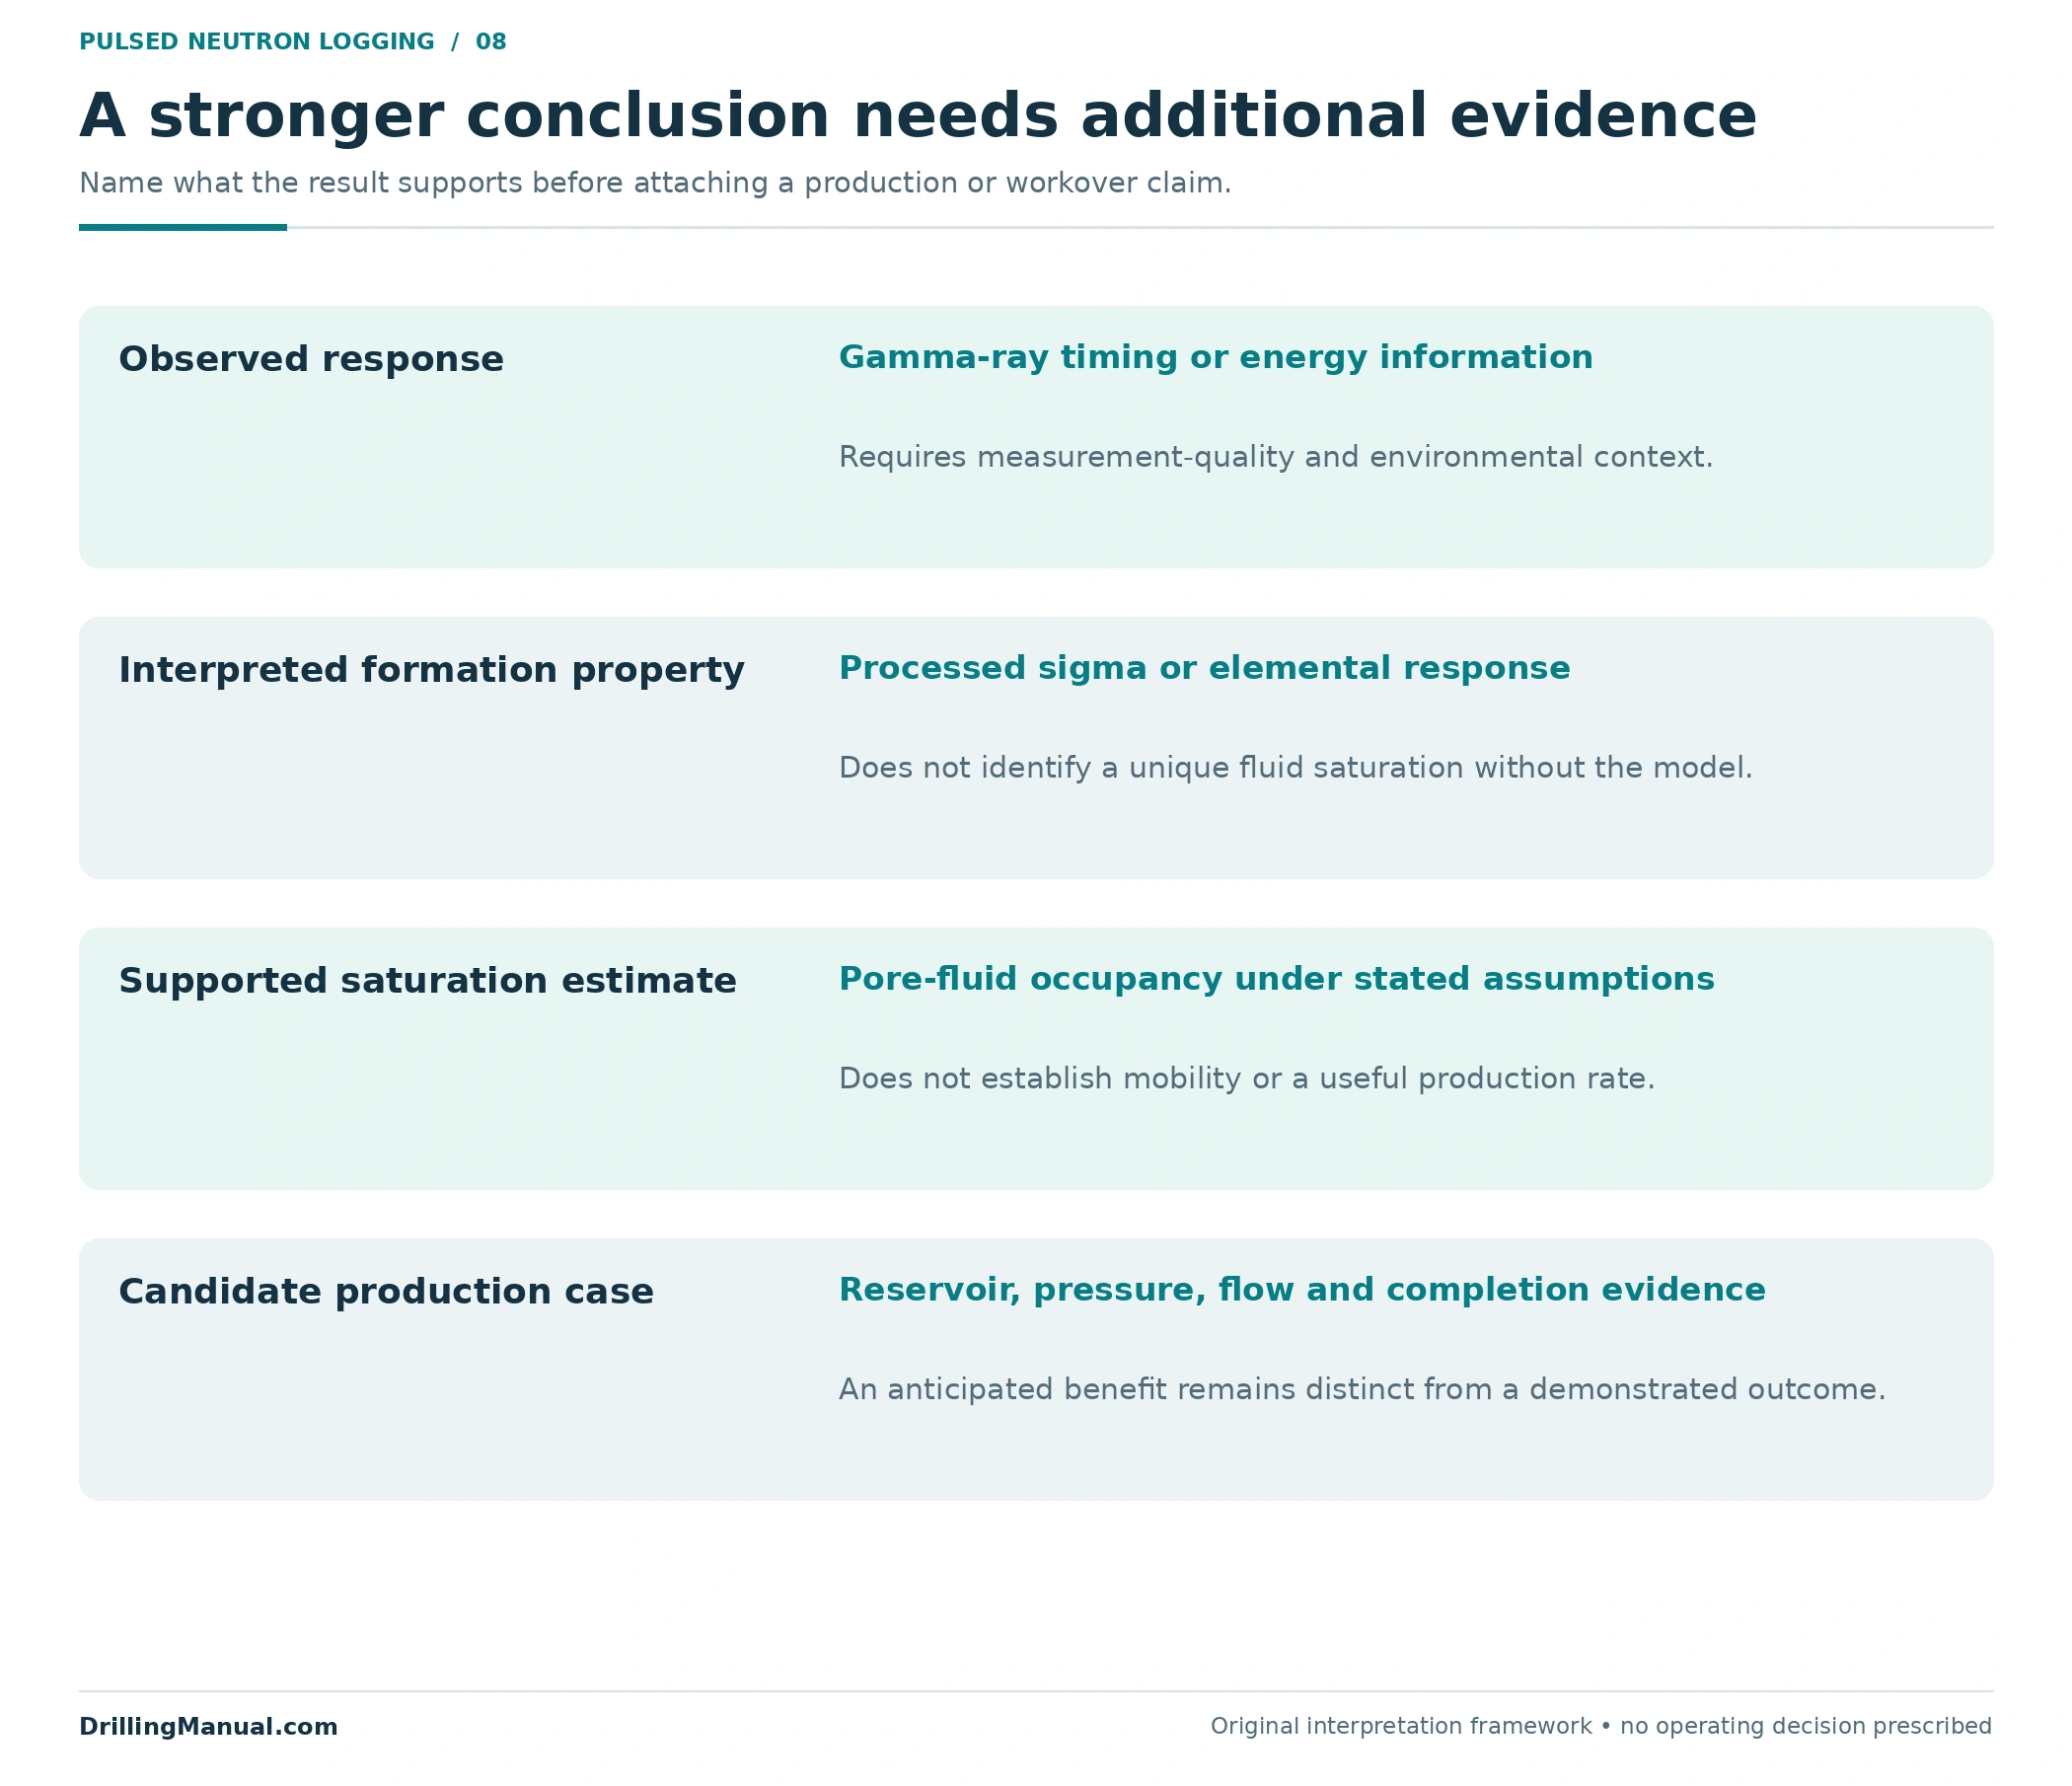
The proposed action should address the remaining question. Pulsed neutron logging may justify further candidate evaluation; pressure, flow and completion evidence are needed to establish the production case. Keep anticipated improvement separate from a result demonstrated after the intervention. The review framework below applies those distinctions without prescribing a logging program or a well operation.
Frequently asked questions
Does pulsed neutron logging prove movable pay?
No. It can support a saturation interpretation behind casing. The source separately identifies permeability, pressure, fluid behavior and reservoir geometry as production factors, and describes hydrocarbons that remain trapped after displacement. A candidate needs evidence about producibility in addition to evidence that hydrocarbons occupy pore space. [1, pp. 2-1–2-3]
Can the method help when formation water is fresh?
C/O interpretation can help where capture-based oil/water discrimination is limited by low or uncertain salinity. Its value comes from a different measurement basis, not from eliminating all interpretation inputs. Porosity, lithology and borehole contributions still matter, and the selected measurement must suit the actual conditions. [1, pp. 3-35–3-40]
Does a higher carbon/oxygen ratio always mean more oil?
No. Carbon-bearing minerals contribute to the response, and the expected endpoints vary with formation and borehole conditions. The same ratio cannot be interpreted using one universal oil cutoff across different rocks. The book’s worked carbonate example demonstrates why mineral carbon must be included before assigning a hydrocarbon saturation. [1, pp. 3-35–3-37 and 3-40]
Does a sigma change prove water breakthrough?
A change may be consistent with a saturation change, but water composition, rock/fluid assumptions and measurement comparability must also be assessed. Mixing native and injected waters can undermine an unchanged-salinity assumption. Depth and processing differences can also complicate repeat comparisons. [1, pp. 3-23–3-24 and 3-39–3-40]
Is this the same as cement bond logging?
No. Saturation interpretation concerns formation fluids and rock properties. Cement-bond evaluation uses a different physical measurement to assess cement-related response. A saturation result does not itself establish the condition of the cement or the success of an isolation arrangement. [1, pp. 1-1, 2-3 and 3-17]
Why keep the original openhole logs?
They can supply porosity, lithology, shale and earlier saturation context for pulsed neutron logging interpretation. Their usefulness depends on whether the relevant formation and saturation assumptions remain applicable. The source explicitly qualifies comparisons that assume saturation has not changed between logging dates. [1, pp. 3-17 and 3-30–3-32]
Book reference
- Schlumberger. Cased Hole Log Interpretation: Principles/Applications. Copyright 1989; fourth printing, March 1997. Schlumberger Educational Services / Schlumberger Wireline & Testing, SMP-7025. Chapter 1: printed p. 1-1 / PDF p. 12. Chapter 2, Fundamentals of Quantitative Log Interpretation: printed pp. 2-1–2-3 / PDF pp. 18–20. Chapter 3, Formation Evaluation in Cased Holes: printed pp. 3-16–3-27, 3-30–3-40 / PDF pp. 37–48, 51–61. Chapter 4, Completion Evaluation: printed pp. 4-1–4-2 / PDF pp. 68–69. The numerical cases, comparison drawings and review frameworks are original educational constructions based on these principles, not reproduced field results or equipment specifications.