Scale deposition in oil wells creates more than one kind of problem. Mineral deposits can narrow production tubing, obstruct the passage or operation of downhole equipment, or impair flow through the formation close to the well. A treatment selected only because production has fallen can miss that distinction. The useful starting point is to identify the material, locate the restriction or impairment, and establish how a proposed treatment would reach it. [1, printed pp. 11-82–11-83; PDF pp. 379–380]
The NOV CTES manual emphasizes sampling and testing the deposit before selecting a removal approach. It also separates a gauge observation in the wellbore from a diagnosis of the principal production problem. This guide follows that logic: material, location, access, removal route and the evidence needed afterward. It supplies no chemical concentration, contact-time prescription, tool setting or generic operating sequence. [1, printed p. 12-58; PDF p. 467]
What scale deposition in oil wells describes
In this context, scale means solid inorganic material precipitated from fluids. The manual describes deposition associated with changing conditions and with mixing incompatible waters. It also notes that the temperature relationship is not identical for every mineral: calcium carbonate is discussed as forming at high temperature. A general statement that “cooling causes all scale” would therefore be misleading even within the source’s overview. [1, printed pp. 11-82, 12-57; PDF pp. 379, 466]
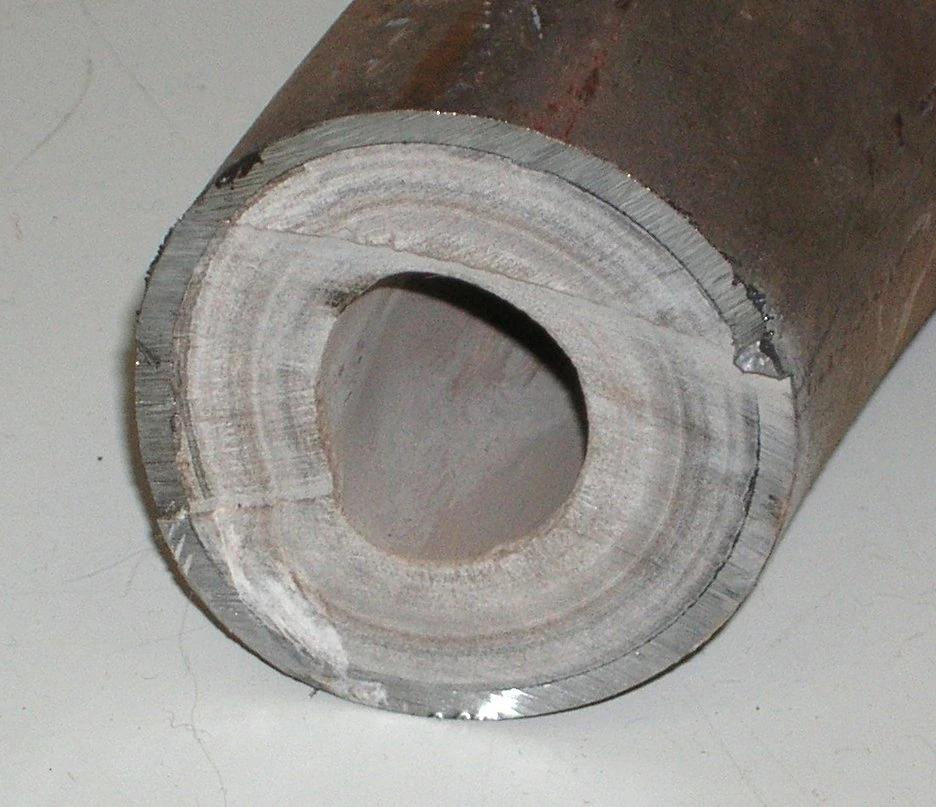
Deposit identity matters because the material may be carbonate, sulfate, chloride, iron-bearing or silica-rich, and it may contain a mixture of inorganic scale, organic material and formation fines. Appearance alone does not provide that composition. A hard crust is an observation; a particular mineral identification requires evidence. The manual’s treatment discussion varies with deposit type and explicitly calls for careful analysis of mixed material. [1, printed pp. 11-84, 12-58–12-59; PDF pp. 381, 467–468]
Scale deposition in oil wells should also be kept distinct from paraffin accumulation. The source addresses organic deposits separately, while recognizing that actual recovered material can be mixed. Naming every restriction “scale” can prematurely narrow the investigation. Record what is known about the sample and retain uncertainty where the material has not been identified.

Locate the effect of scale deposition in oil wells
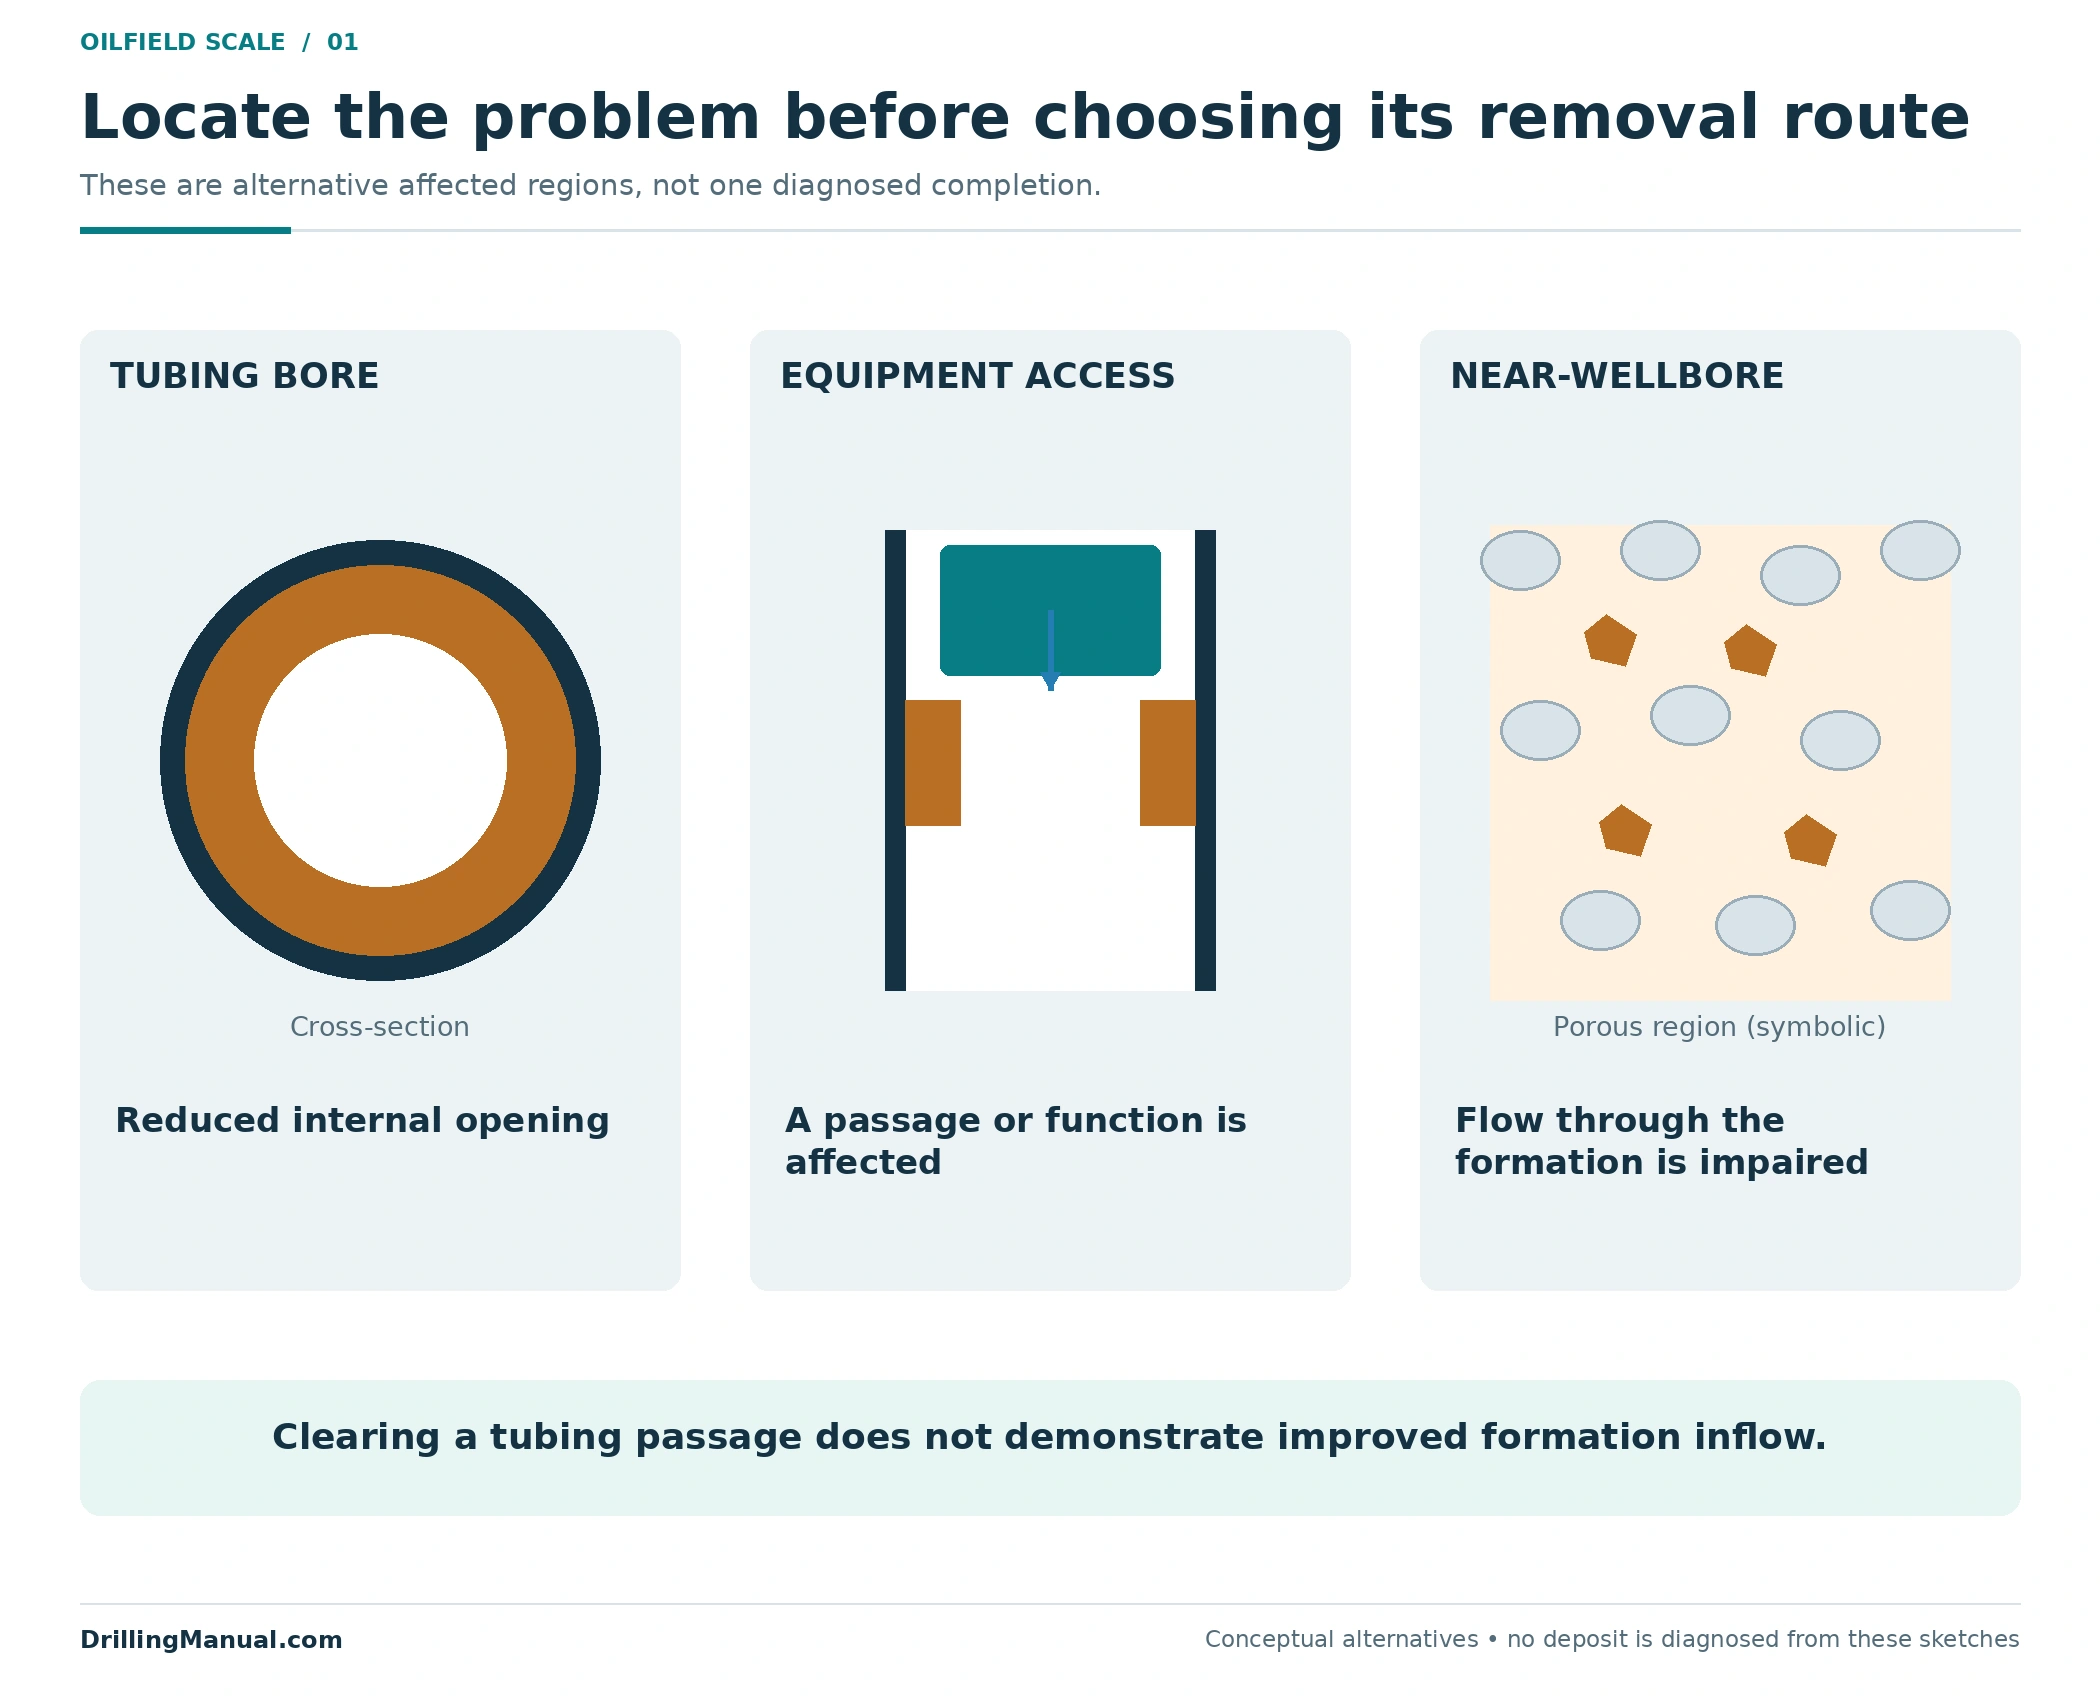
A deposit inside tubing reduces available flow area and can obstruct equipment. A deposit within the formation matrix can reduce inflow through a different mechanism. Both can be associated with poor production, but a tool that clears a central tubing passage does not automatically treat material in the surrounding formation. The separate formation-damage guide explains the wider diagnostic context for impaired inflow. [1, printed pp. 11-82–11-83; PDF pp. 379–380]
The distinction changes the objective. A job may aim to restore access for a particular assembly, remove an internal flow restriction, or address near-wellbore impairment. Those objectives can coexist, but they should be stated separately. The location sketch is a set of alternatives, not a claim that every well contains all the illustrated deposits.
| Possible affected location | Question to resolve | Unsupported shortcut |
|---|---|---|
| Production-tubing bore | Where is the restricted opening, and what material occupies it? | Assuming the percentage of lost area equals the percentage of lost production. |
| Completion hardware or an access restriction | Which required passage or equipment function is affected? | Assuming one small tool’s passage proves all later equipment can operate. |
| Formation close to the wellbore | What evidence supports deposit-related inflow impairment? | Assuming a cleared tubing bore proves that formation impairment has been removed. |
A gauge survey can reveal a restricted bore or deposits along the surveyed route. The manual cautions that this does not identify the main cause of reduced production. For scale deposition in oil wells, preserve both statements: what was observed in the bore and what remains unresolved about the production loss. A restriction deserves attention without being assigned every symptom in the well. [1, printed pp. 11-83, 12-58; PDF pp. 380, 467]
Identify scale deposition in oil wells from evidence
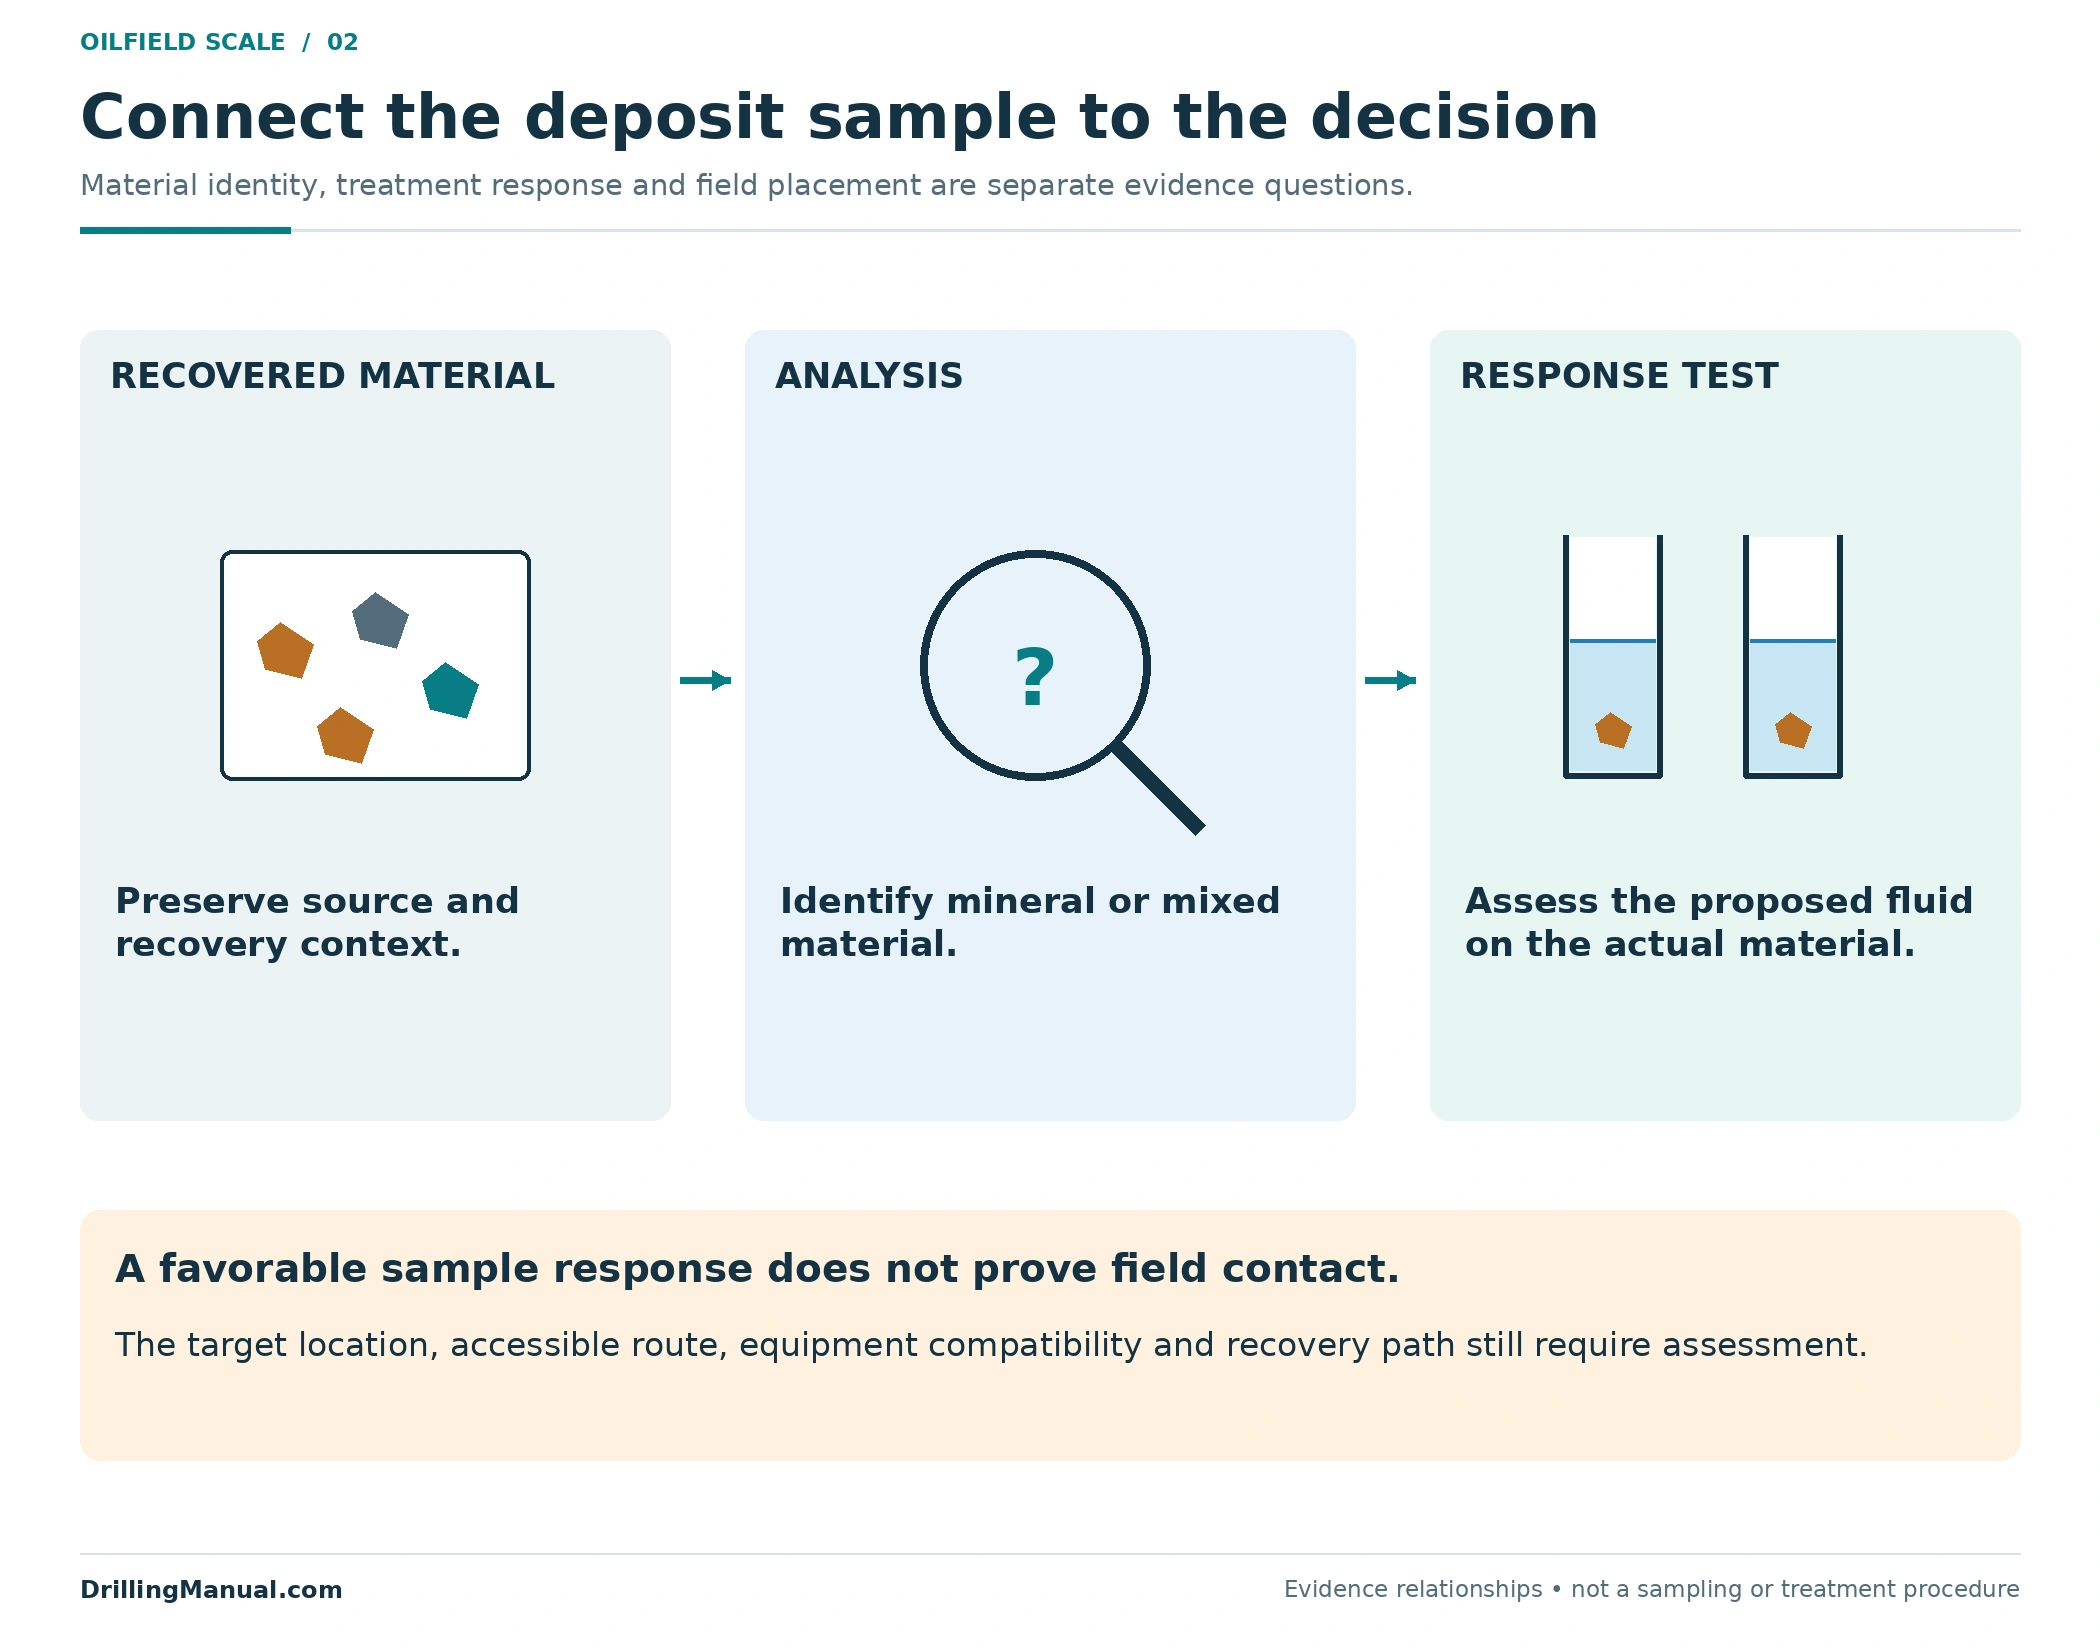
The source recommends obtaining deposit material for analysis and testing it against candidate treatment fluids. That provides a much stronger basis for selection than assigning chemistry from color or a pressure response. Retain the sample’s origin and recovery context with the result so that the analysis can be related to the proposed target. A well can contain material from more than one location or operation. [1, printed pp. 11-83, 12-58; PDF pp. 380, 467]
The following comparison is deliberately qualitative. The source contains treatment examples, but their presence in a table does not establish that a particular fluid system is suitable for every well containing that mineral. The selected material, completion, reservoir and fluid conditions still govern the job.
| Deposit evidence | Selection implication | What remains to establish |
|---|---|---|
| Carbonate material identified | The manual describes a chemical-dissolution route for carbonates. | Whether the proposed treatment works on the actual sample and is suitable for the well. |
| Sulfate material identified | Different sulfate deposits have different removal difficulties; the source discusses both chemical and mechanical approaches. | The specific mineral and applicable treatment response, rather than a generic sulfate label. |
| Iron-bearing or silica-rich material identified | The treatment question differs from the carbonate case. | Appropriate fluid selection and control of undesirable treatment effects. |
| Mixed or incompletely identified material | A single assumed reaction may address only part of the deposit. | Composition, relevant response tests and whether a combined approach is justified. |
This is not a chemical recipe. In particular, a favorable response to one candidate fluid does not demonstrate that the fluid can reach all of the deposit in the well, that the equipment is compatible, or that the spent material has a suitable recovery path. Laboratory evidence helps answer the material question; placement and removal remain separate design questions. [1, printed pp. 11-83–11-84, 12-58–12-61; PDF pp. 380–381, 467–470]
A smaller bore: calculate geometry before claiming production loss
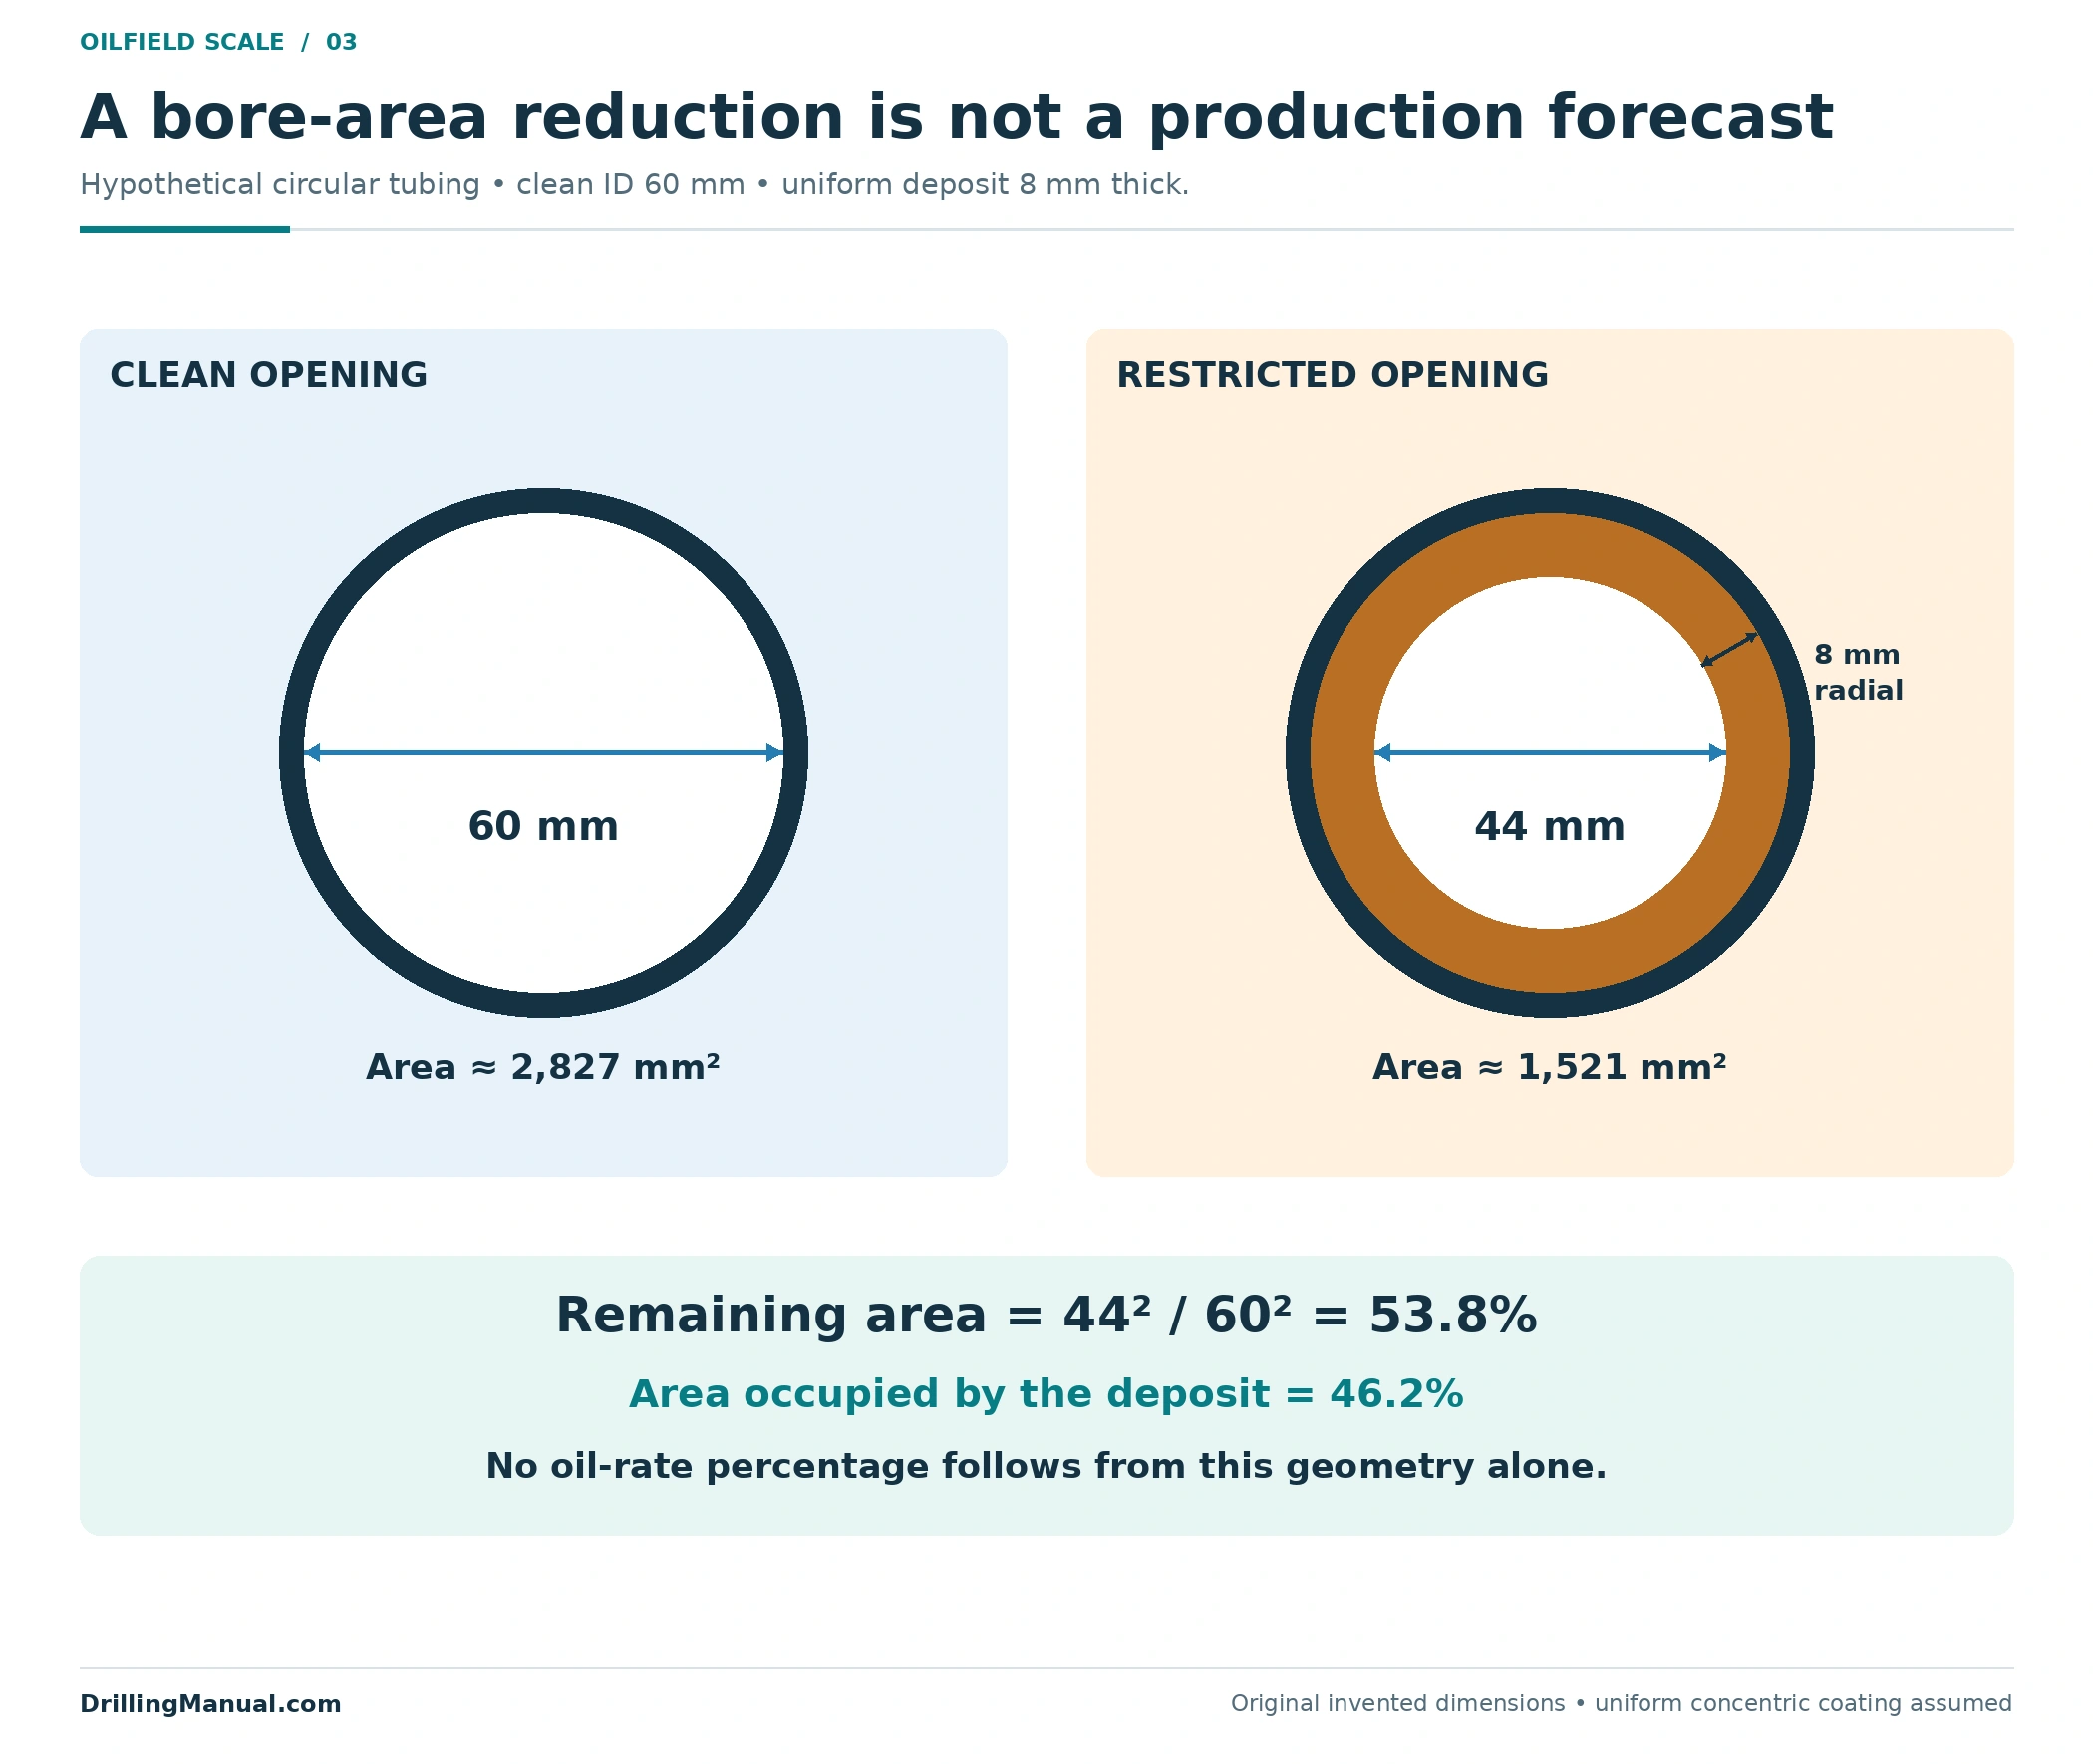
Consider an original hypothetical section of circular tubing with a clean internal diameter of 60 mm. Assume a uniform, concentric deposit 8 mm thick on the inside wall. The remaining opening is 60 − 2 × 8 = 44 mm. These are teaching dimensions, not a tubing specification or a measured well.
For a circular opening, area is proportional to diameter squared. The remaining-area fraction is therefore 44²/60² = 0.538, approximately 53.8%. The deposit occupies approximately 46.2% of the original cross-sectional opening. That result describes the stated geometry only. It is not a flow-capacity calculation and does not predict the well’s oil-rate reduction.
| Quantity | Calculation | Result |
|---|---|---|
| Remaining diameter | 60 − 2 × 8 | 44 mm |
| Clean opening area | π × 60² / 4 | Approximately 2,827 mm² |
| Restricted opening area | π × 44² / 4 | Approximately 1,521 mm² |
| Fraction of original area still open | 44² / 60² | Approximately 53.8% |
The example explains one consequence of scale deposition in oil wells without equating it to the whole production problem. Actual deposits can be irregular and vary with depth; a real assessment needs the geometry and conditions relevant to the well. Even a correctly measured opening does not quantify a separate formation impairment. The manual’s distinction between a gauge finding and a production diagnosis remains essential. [1, printed pp. 11-83, 12-58; PDF pp. 380, 467]
The cross-section also contains no information about the deposit’s length. A short local restriction and a long coated interval could share that same minimum opening while presenting different quantities of material to remove. Do not convert the drawing into a waste-volume estimate without the missing extent and geometry. Nor does a single recovered piece establish that the coating is uniform. The simplifying assumptions make the arithmetic transparent; they must remain visible when the example is compared with an actual survey. A useful field record distinguishes the measured minimum opening, the interval over which evidence exists and any unmeasured region.
Choose a route for scale deposition in oil wells
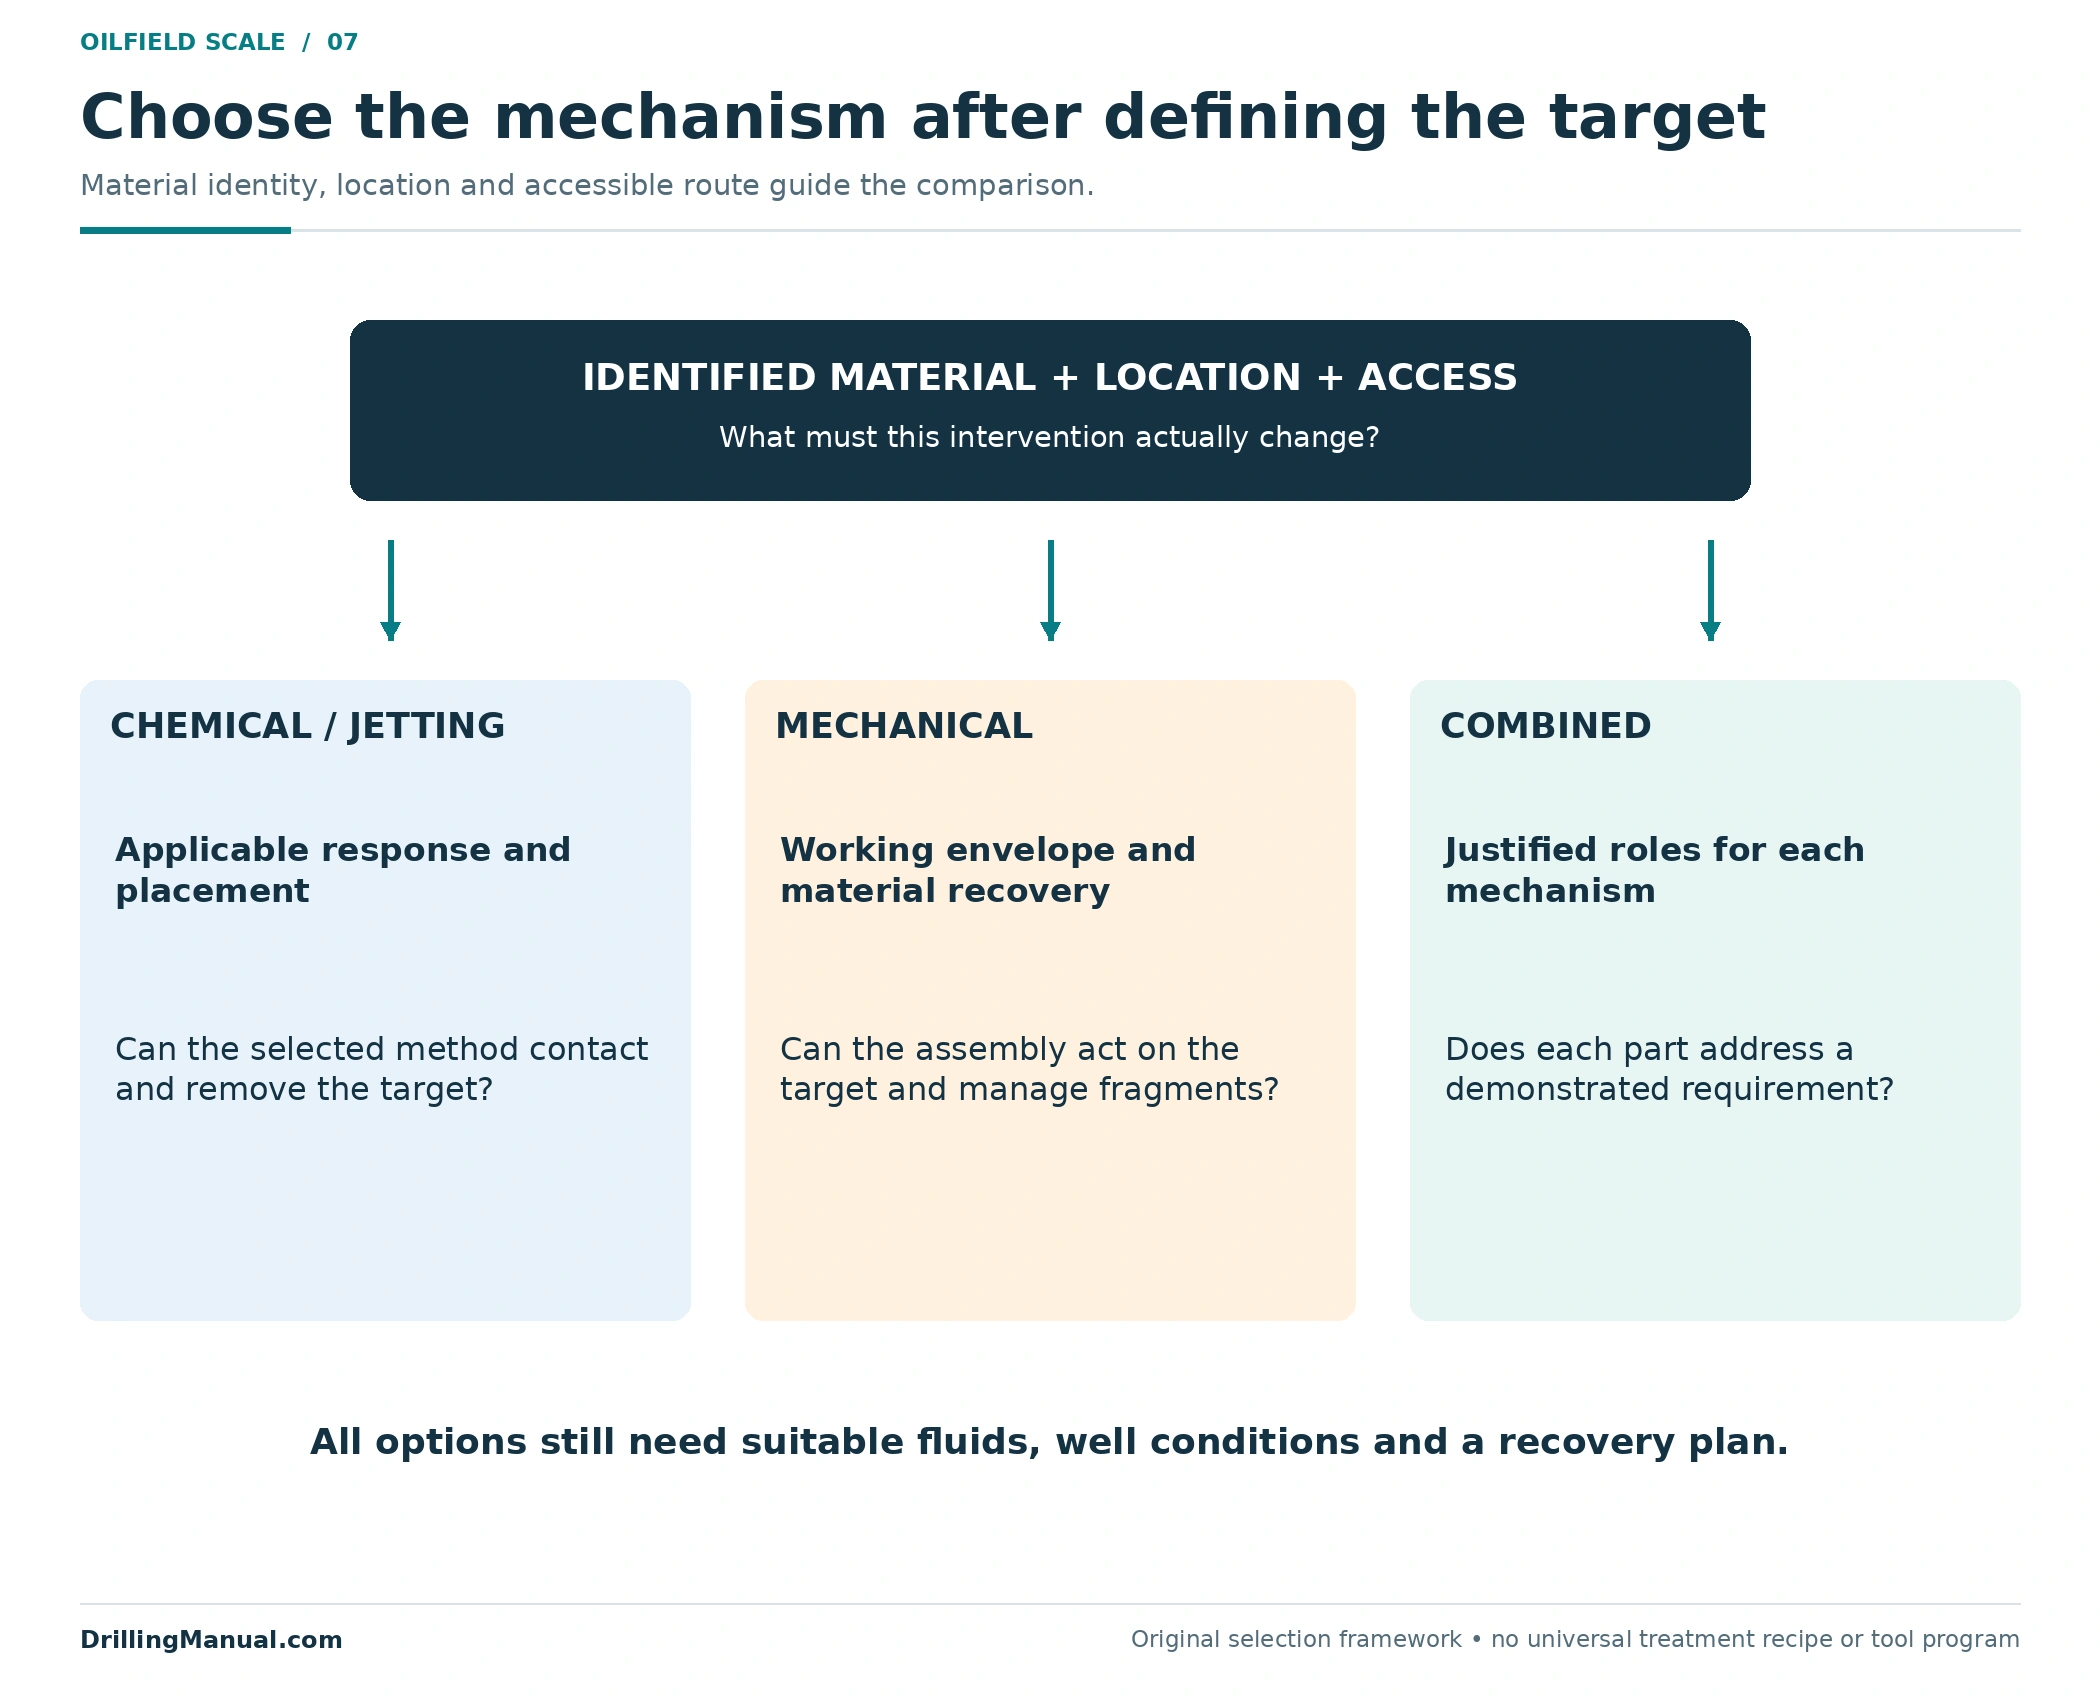
The manual describes localized chemical treatment, hydraulic jetting, motor-driven drilling or milling, and impact tools. These are removal mechanisms with different requirements, not interchangeable names for the same job. Selection starts with the identified material and intended result, then considers the reservoir, tubular geometry, available access and fluid behavior. [1, printed pp. 11-82–11-83, 12-57–12-61; PDF pp. 379–380, 466–470]
A chemical route needs evidence that the selected system addresses the deposit under the relevant conditions. A mechanical route needs a tool that can reach and act on the target, with a means of managing the material it generates. Jetting likewise requires suitable placement and a defined removal objective. A combined approach may be justified by the deposit and application, but should not be chosen merely because more methods sound more comprehensive.
The coiled-tubing guide provides the surrounding conveyance and equipment context. Using CT does not settle the removal choice by itself: the fluid, tool and target have to work as one application. The source also identifies compatibility between the circulating fluid, the downhole assembly and wellbore fluids as a requirement. [1, printed p. 12-61; PDF p. 470]
Check passage and working reach separately
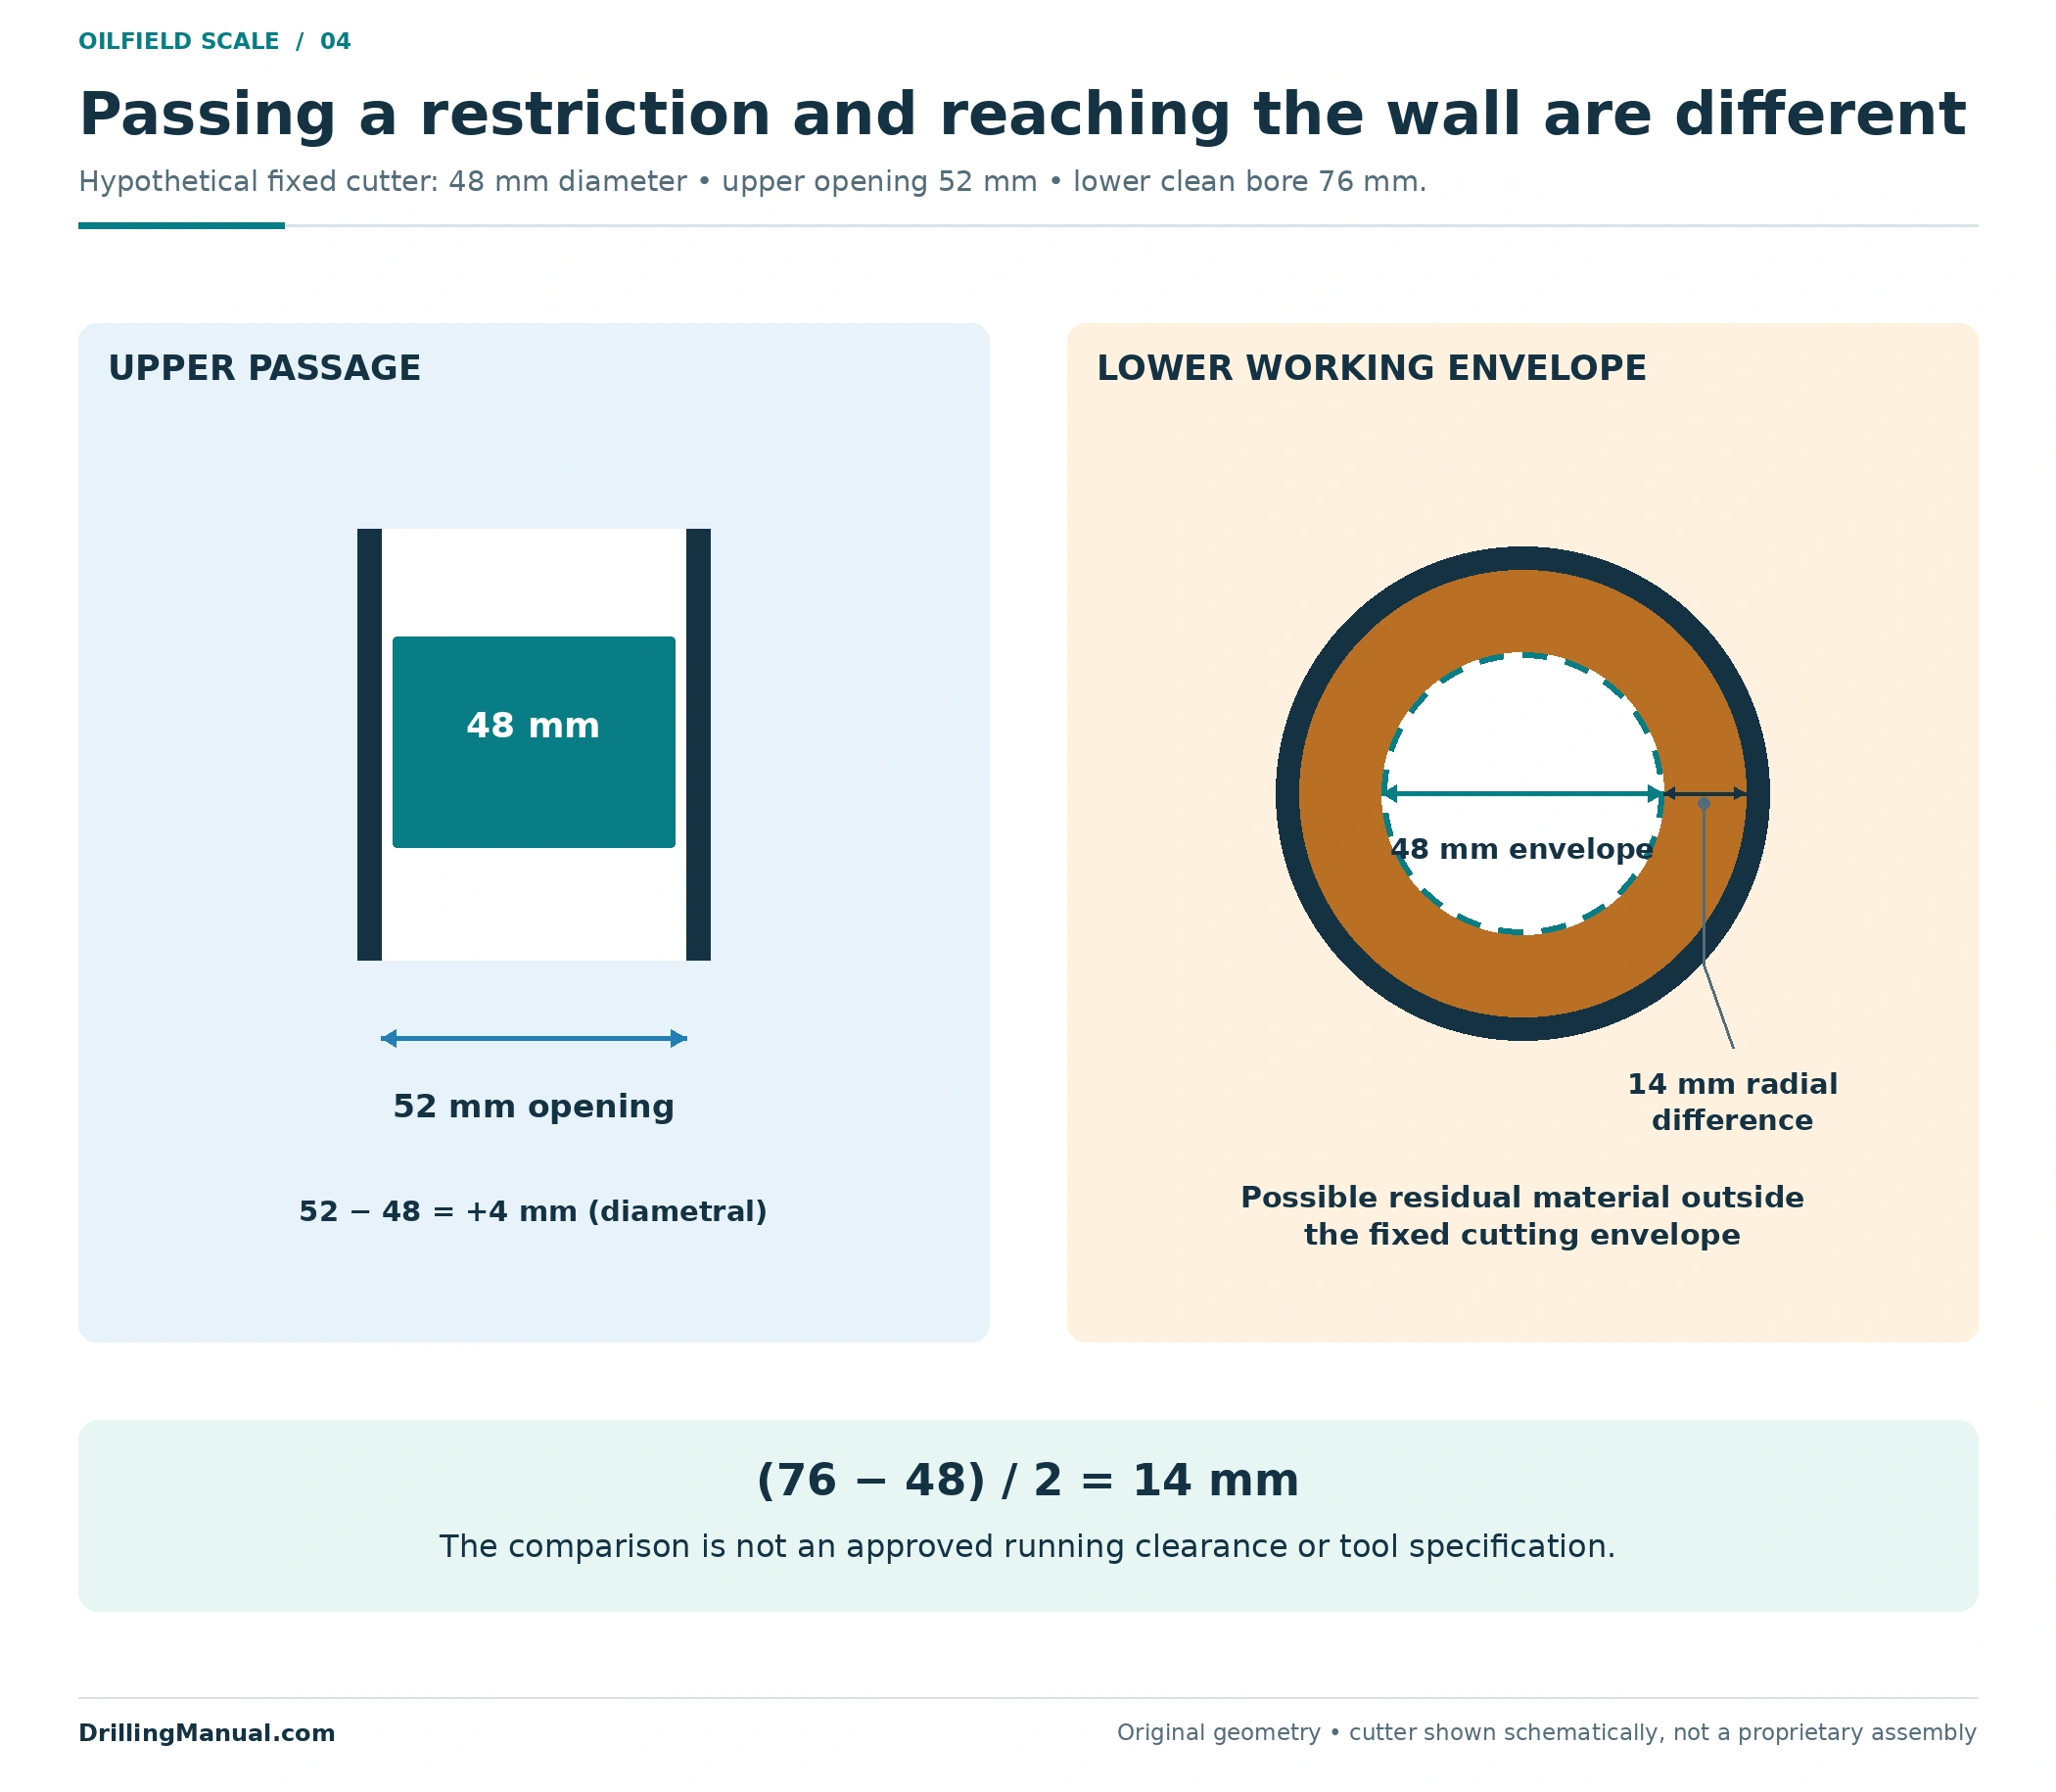
The tool must first reach the deposit. Once there, its working envelope must suit the surface to be treated. A fixed-diameter cutter small enough to pass through a narrow upper restriction may leave material against the wall of a larger bore below. The manual discusses underreaming for that access problem and notes that toolstring length affects deployment and pressure-control arrangements. This is a geometry principle, not approval of a particular assembly. [1, printed p. 12-60; PDF p. 469]
For a second hypothetical illustration, consider a 52 mm upper restriction, a fixed 48 mm cutter and a 76 mm clean bore below. The cutter is smaller than the upper opening by 4 mm in diameter. Its 48 mm cutting envelope nevertheless cannot sweep a 76 mm bore. The radial difference between that envelope and the clean lower wall is (76 − 48)/2 = 14 mm. These comparisons identify a geometric limitation; they supply neither an approved running clearance nor an expandable-tool specification.
Access planning for scale deposition in oil wells must also consider the return journey and the actual assembly, not just the cutting element. The manual lists possible problems involving stuck assemblies and tools that fail to extend or retract. A proposed treatment should account for those application-specific limitations before a nominal tool diameter is taken as proof of suitability. [1, printed p. 12-63; PDF p. 472]

The separate wellbore-cleanout guide addresses readiness for new completion equipment. This article uses the access distinction to evaluate deposit removal, while that guide owns the broader wall-preparation and installation-evidence review.
Scale deposition in oil wells and the return path
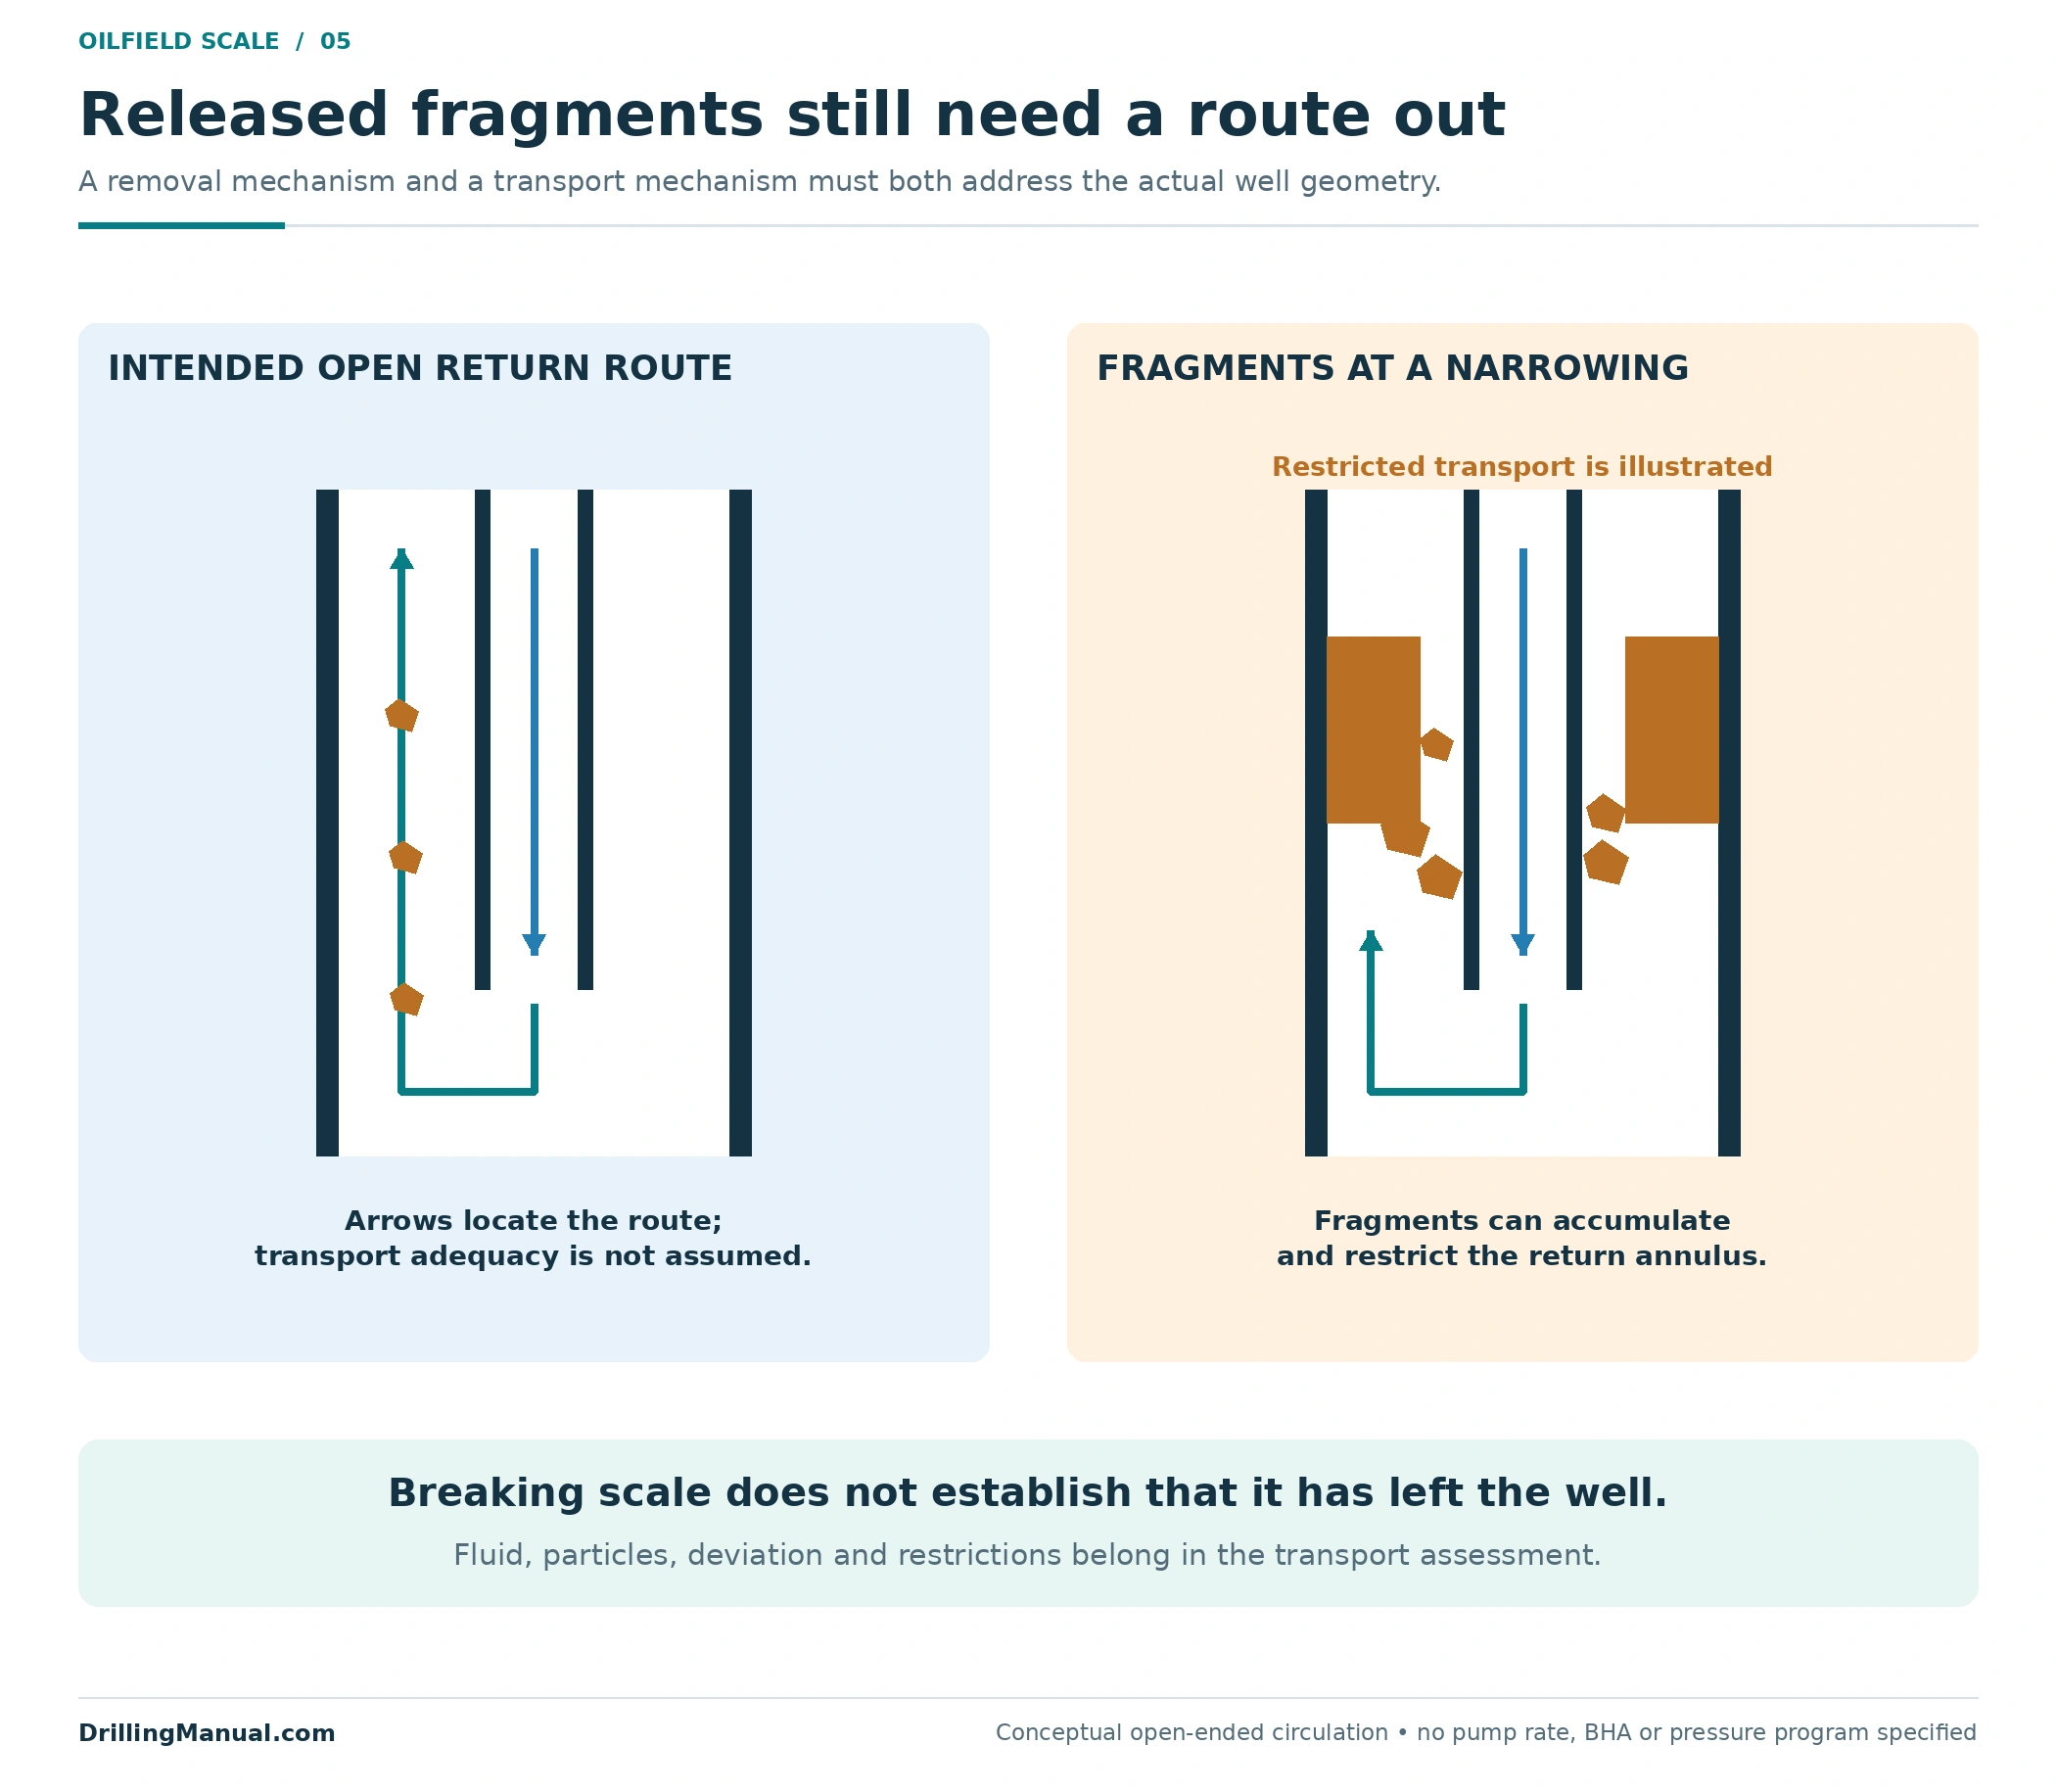
Breaking a deposit changes its form and location; it does not automatically remove it from the well. The manual describes fragments and flakes generated during mechanical removal that can accumulate at restricted sections. Such accumulation can impede annular flow and increase the risk of a stuck assembly. The circulation and recovery design therefore belongs beside the cutting or dissolution choice. [1, printed p. 12-59; PDF p. 468]
The original return-path diagram shows a simple open route around a workstring and a separate condition with fragments at a narrowing. Arrows identify the intended fluid route; they do not certify adequate transport. Whether the selected fluid can carry the actual particles through the full route requires the applicable hydraulic and well-geometry assessment. The source specifically treats deviation and the volume of generated material as relevant considerations. [1, printed pp. 12-59, 12-61; PDF pp. 468, 470]
For scale deposition in oil wells, surface recovery is part of the treatment design. The manual includes handling spent fluid and recovered material, and recognizes that some scale waste can contain low-specific-activity radioactive material. That is a reason to establish the waste’s actual characteristics and the appropriate handling arrangements; it is not a claim that every scale sample is radioactive. [1, printed pp. 11-82, 12-58–12-59; PDF pp. 379, 467–468]
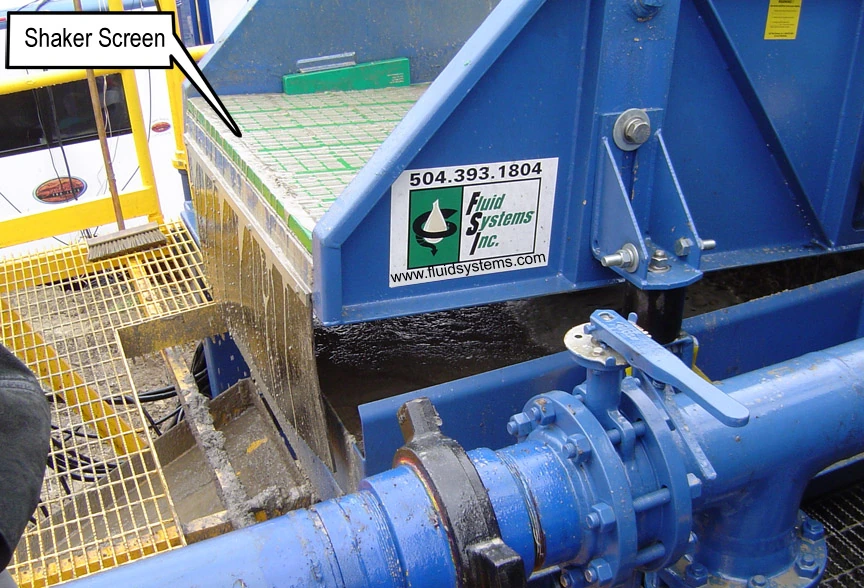

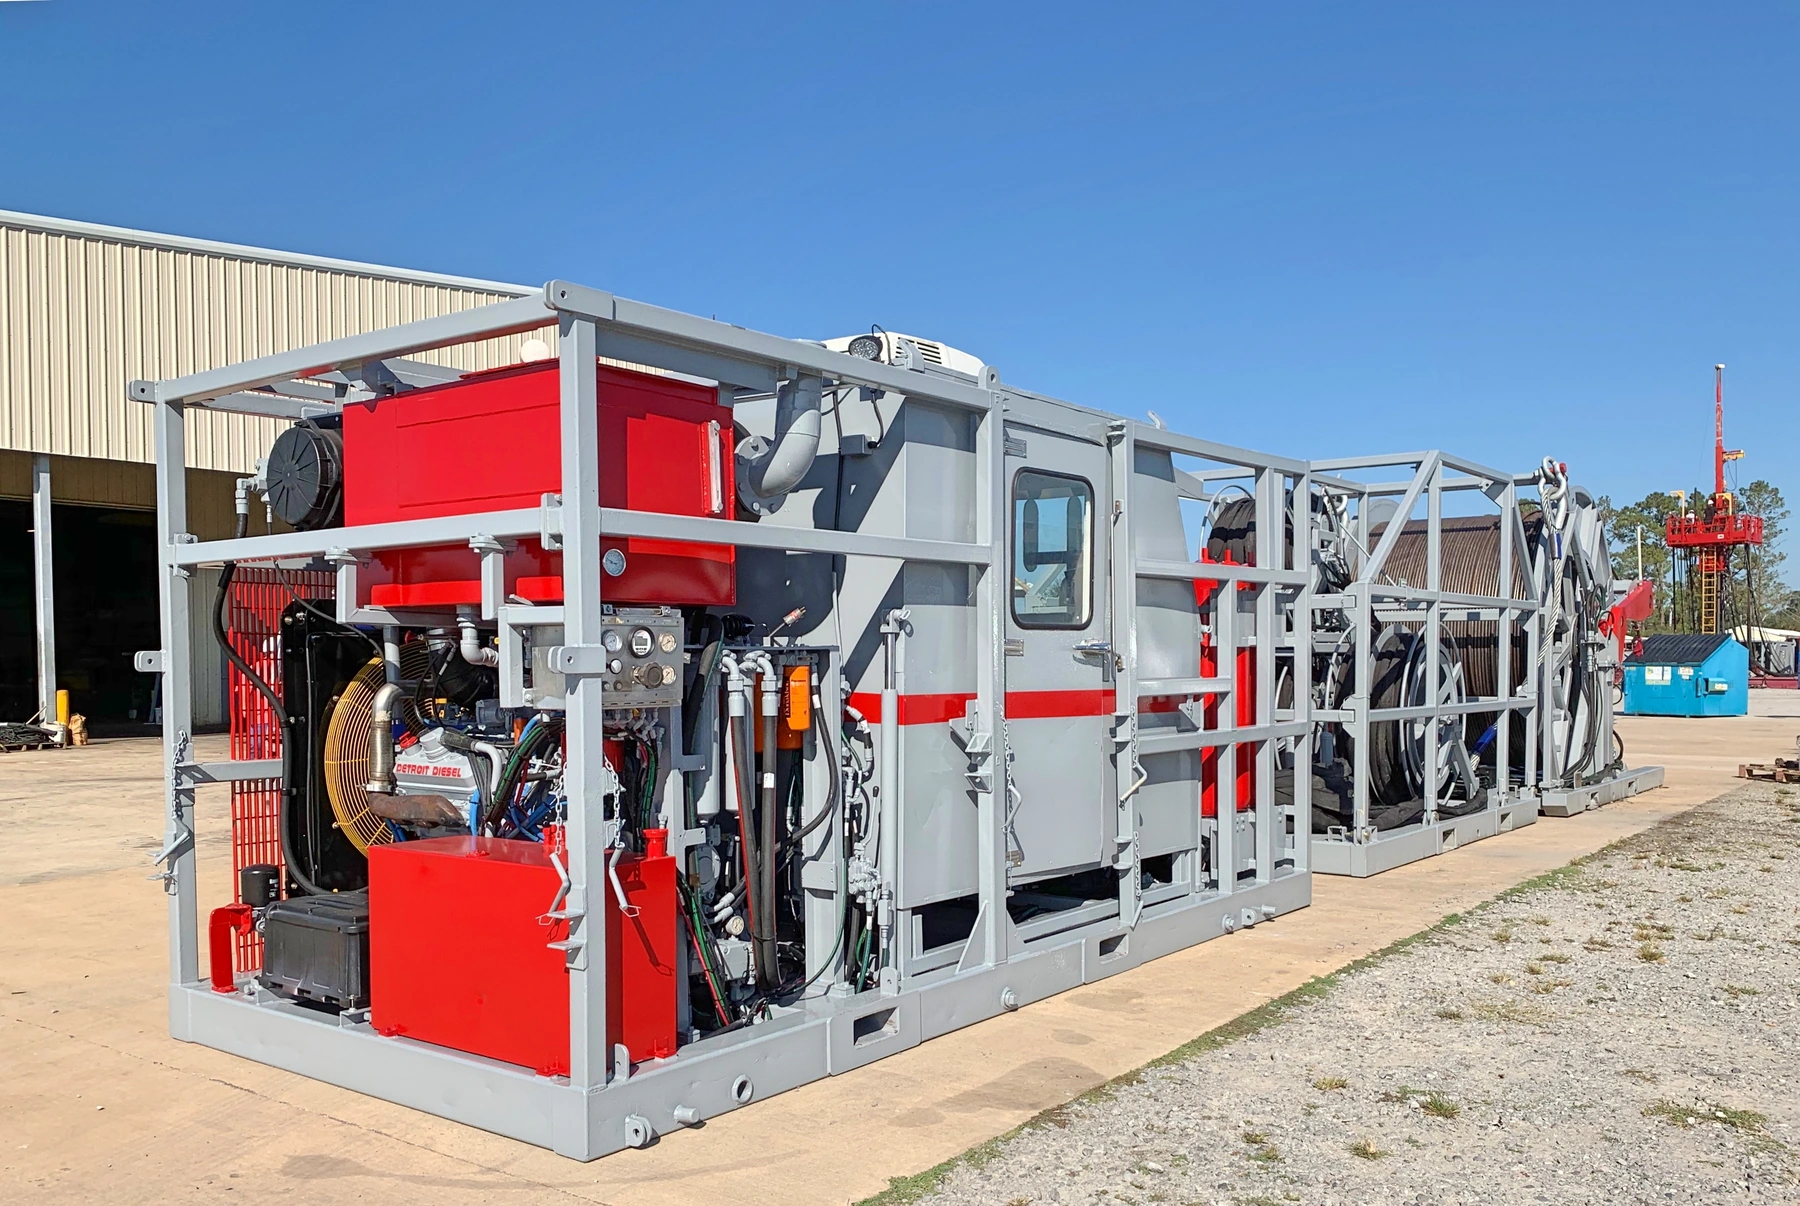
The coiled-tubing sand-cleanout guide develops the separate transport problem for fill. It should not be used to identify a hard deposit or to assume that a sand-cleanout design will remove an adherent scale layer. The pictured shaker provides solids-handling context, not evidence that the illustrated well’s scale was recovered.
Separate removal, restored access and improved inflow
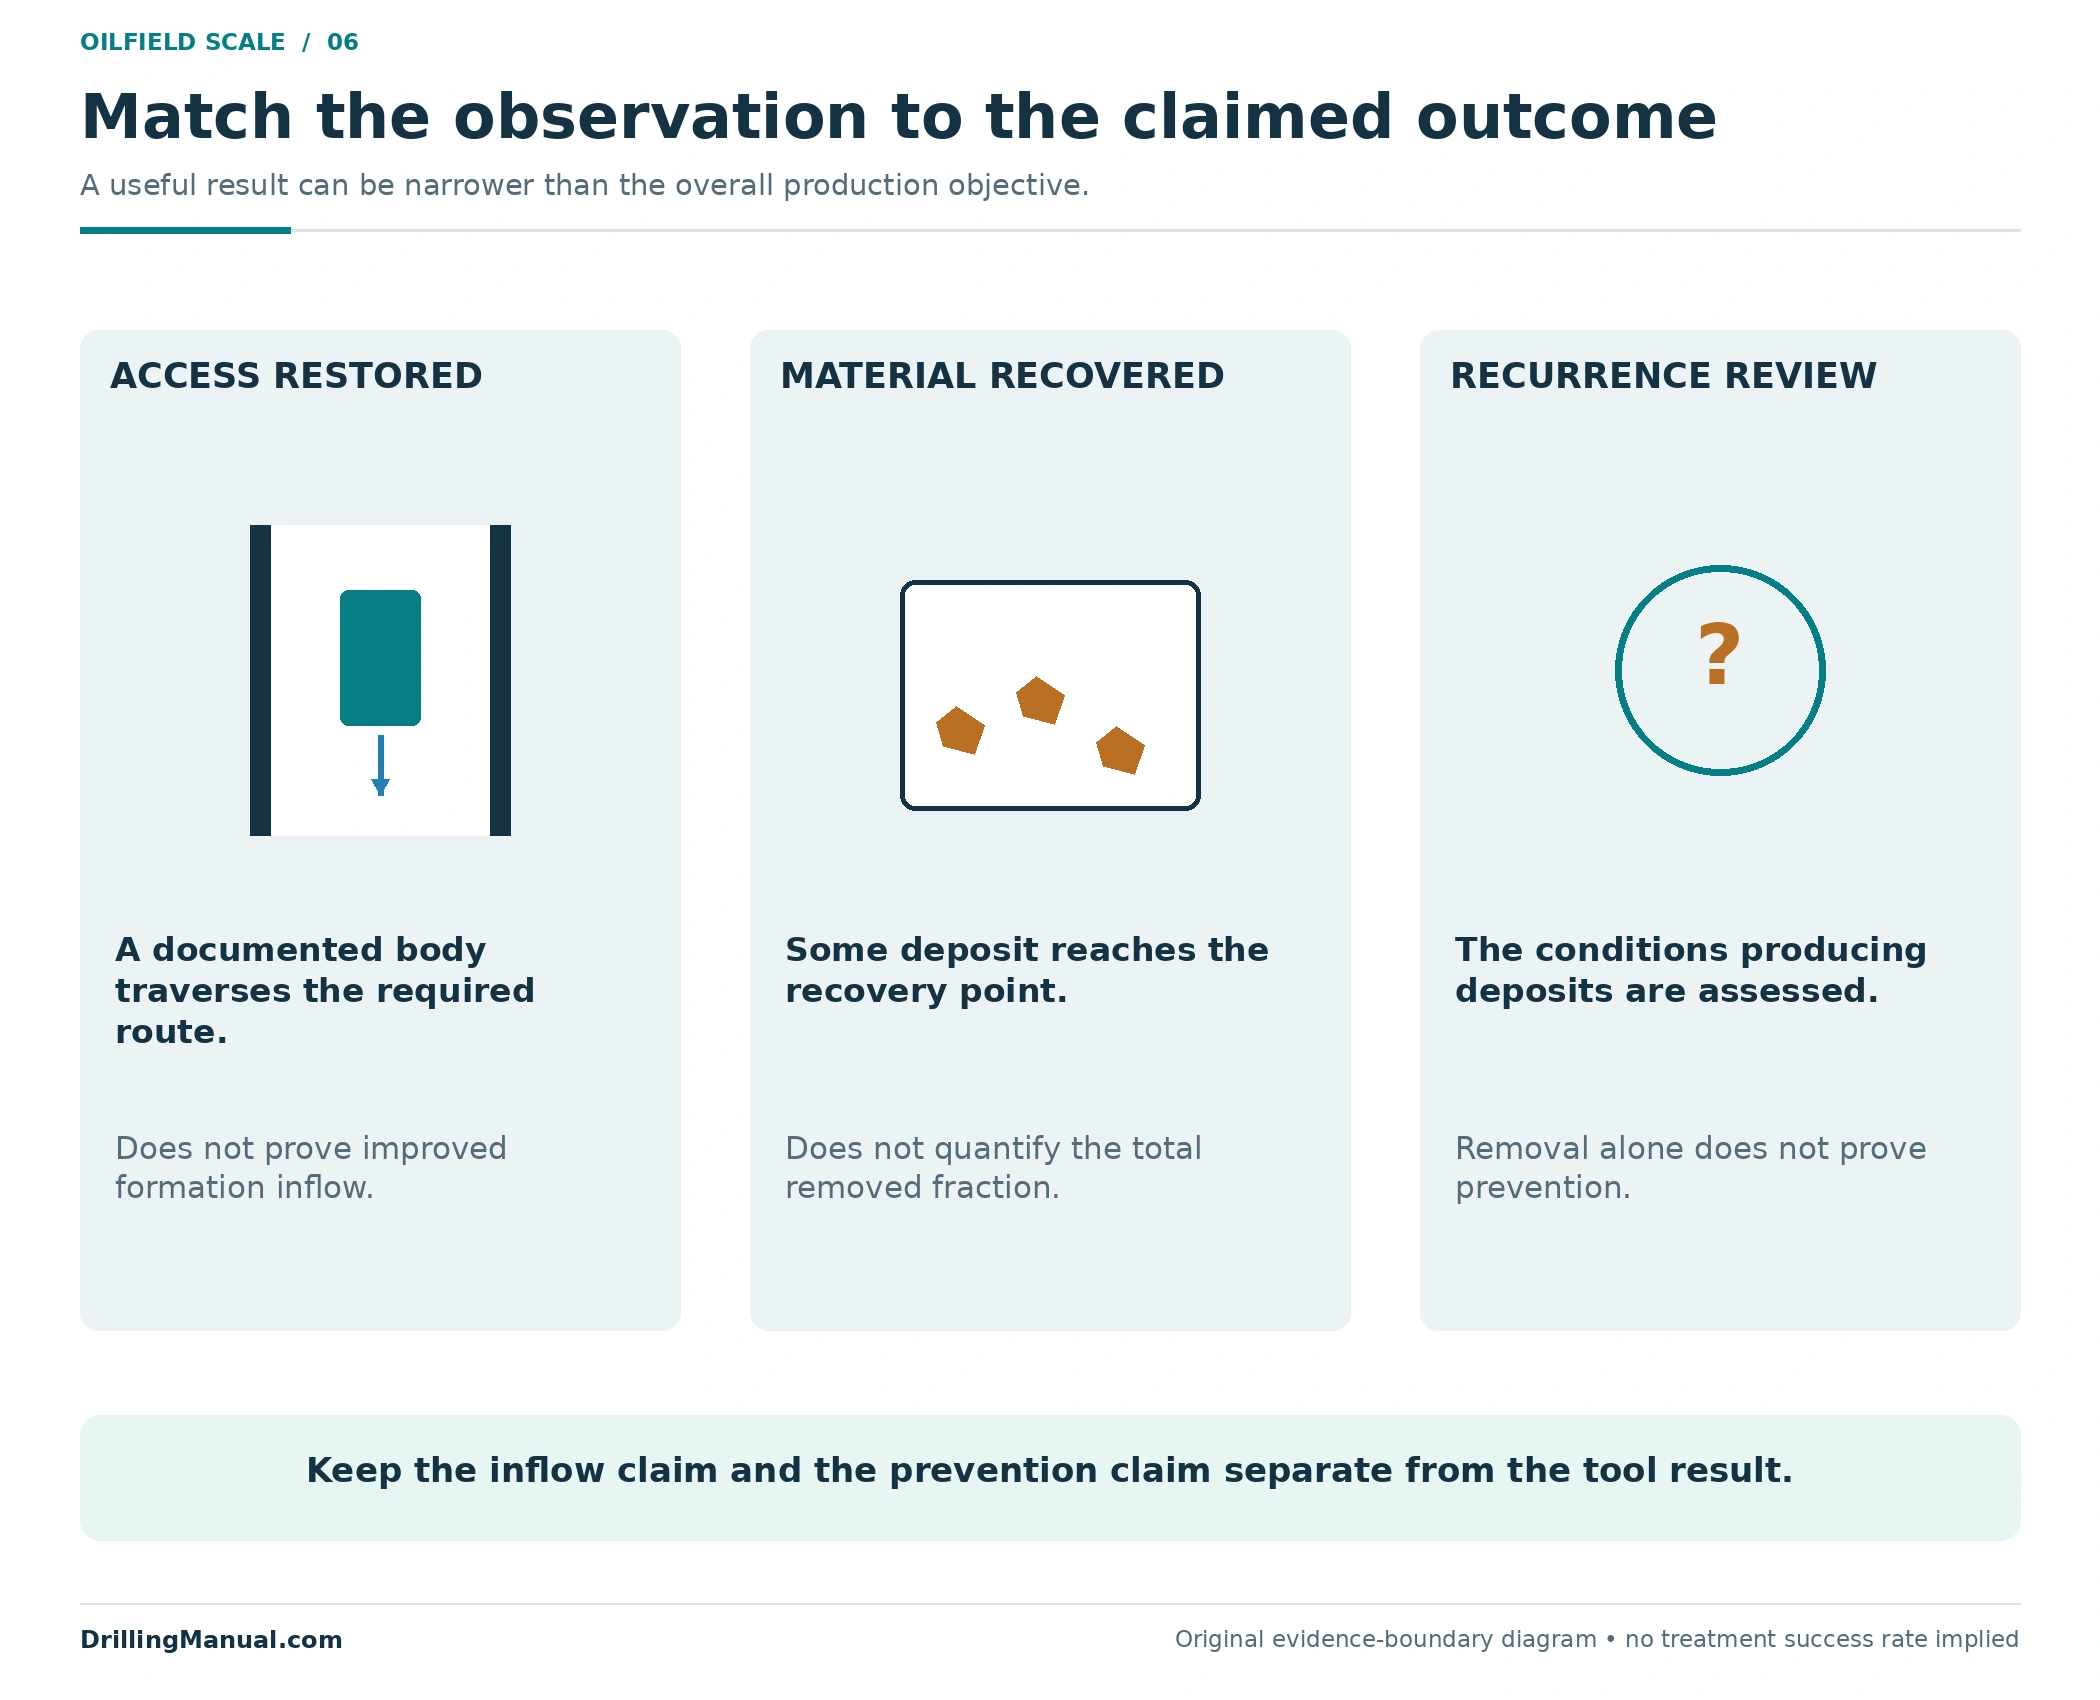
Success needs an objective that can be checked. If the purpose is access, the record should identify the required route and equipment. If the purpose is removal of a flow restriction, the evidence should address the targeted interval. If the proposal also claims improved formation inflow, that claim needs relevant production or inflow evidence rather than the access result alone. The source’s distinction between bore deposits and matrix impairment supports keeping these outcomes separate. [1, printed pp. 11-83, 12-58; PDF pp. 380, 467]
A recovered fragment proves that some material reached the recovery point. It does not establish a removal percentage unless the original inventory and the recovered amount are known on a comparable basis. Similarly, an open central passage can coexist with residual material outside the treated envelope. These are limits on the conclusion drawn from the observation, not reasons to discard useful evidence.
A treatment for scale deposition in oil wells also does not demonstrate that the tendency to deposit has ended. The manual discusses inhibition after removal and describes its design as dependent on the well. Retain prevention as a separate question: what conditions produced the deposit, and what justified measures address recurrence? A successful cleanout is not evidence of permanent prevention. [1, printed p. 12-62; PDF p. 471]
A reviewable plan for scale deposition in oil wells
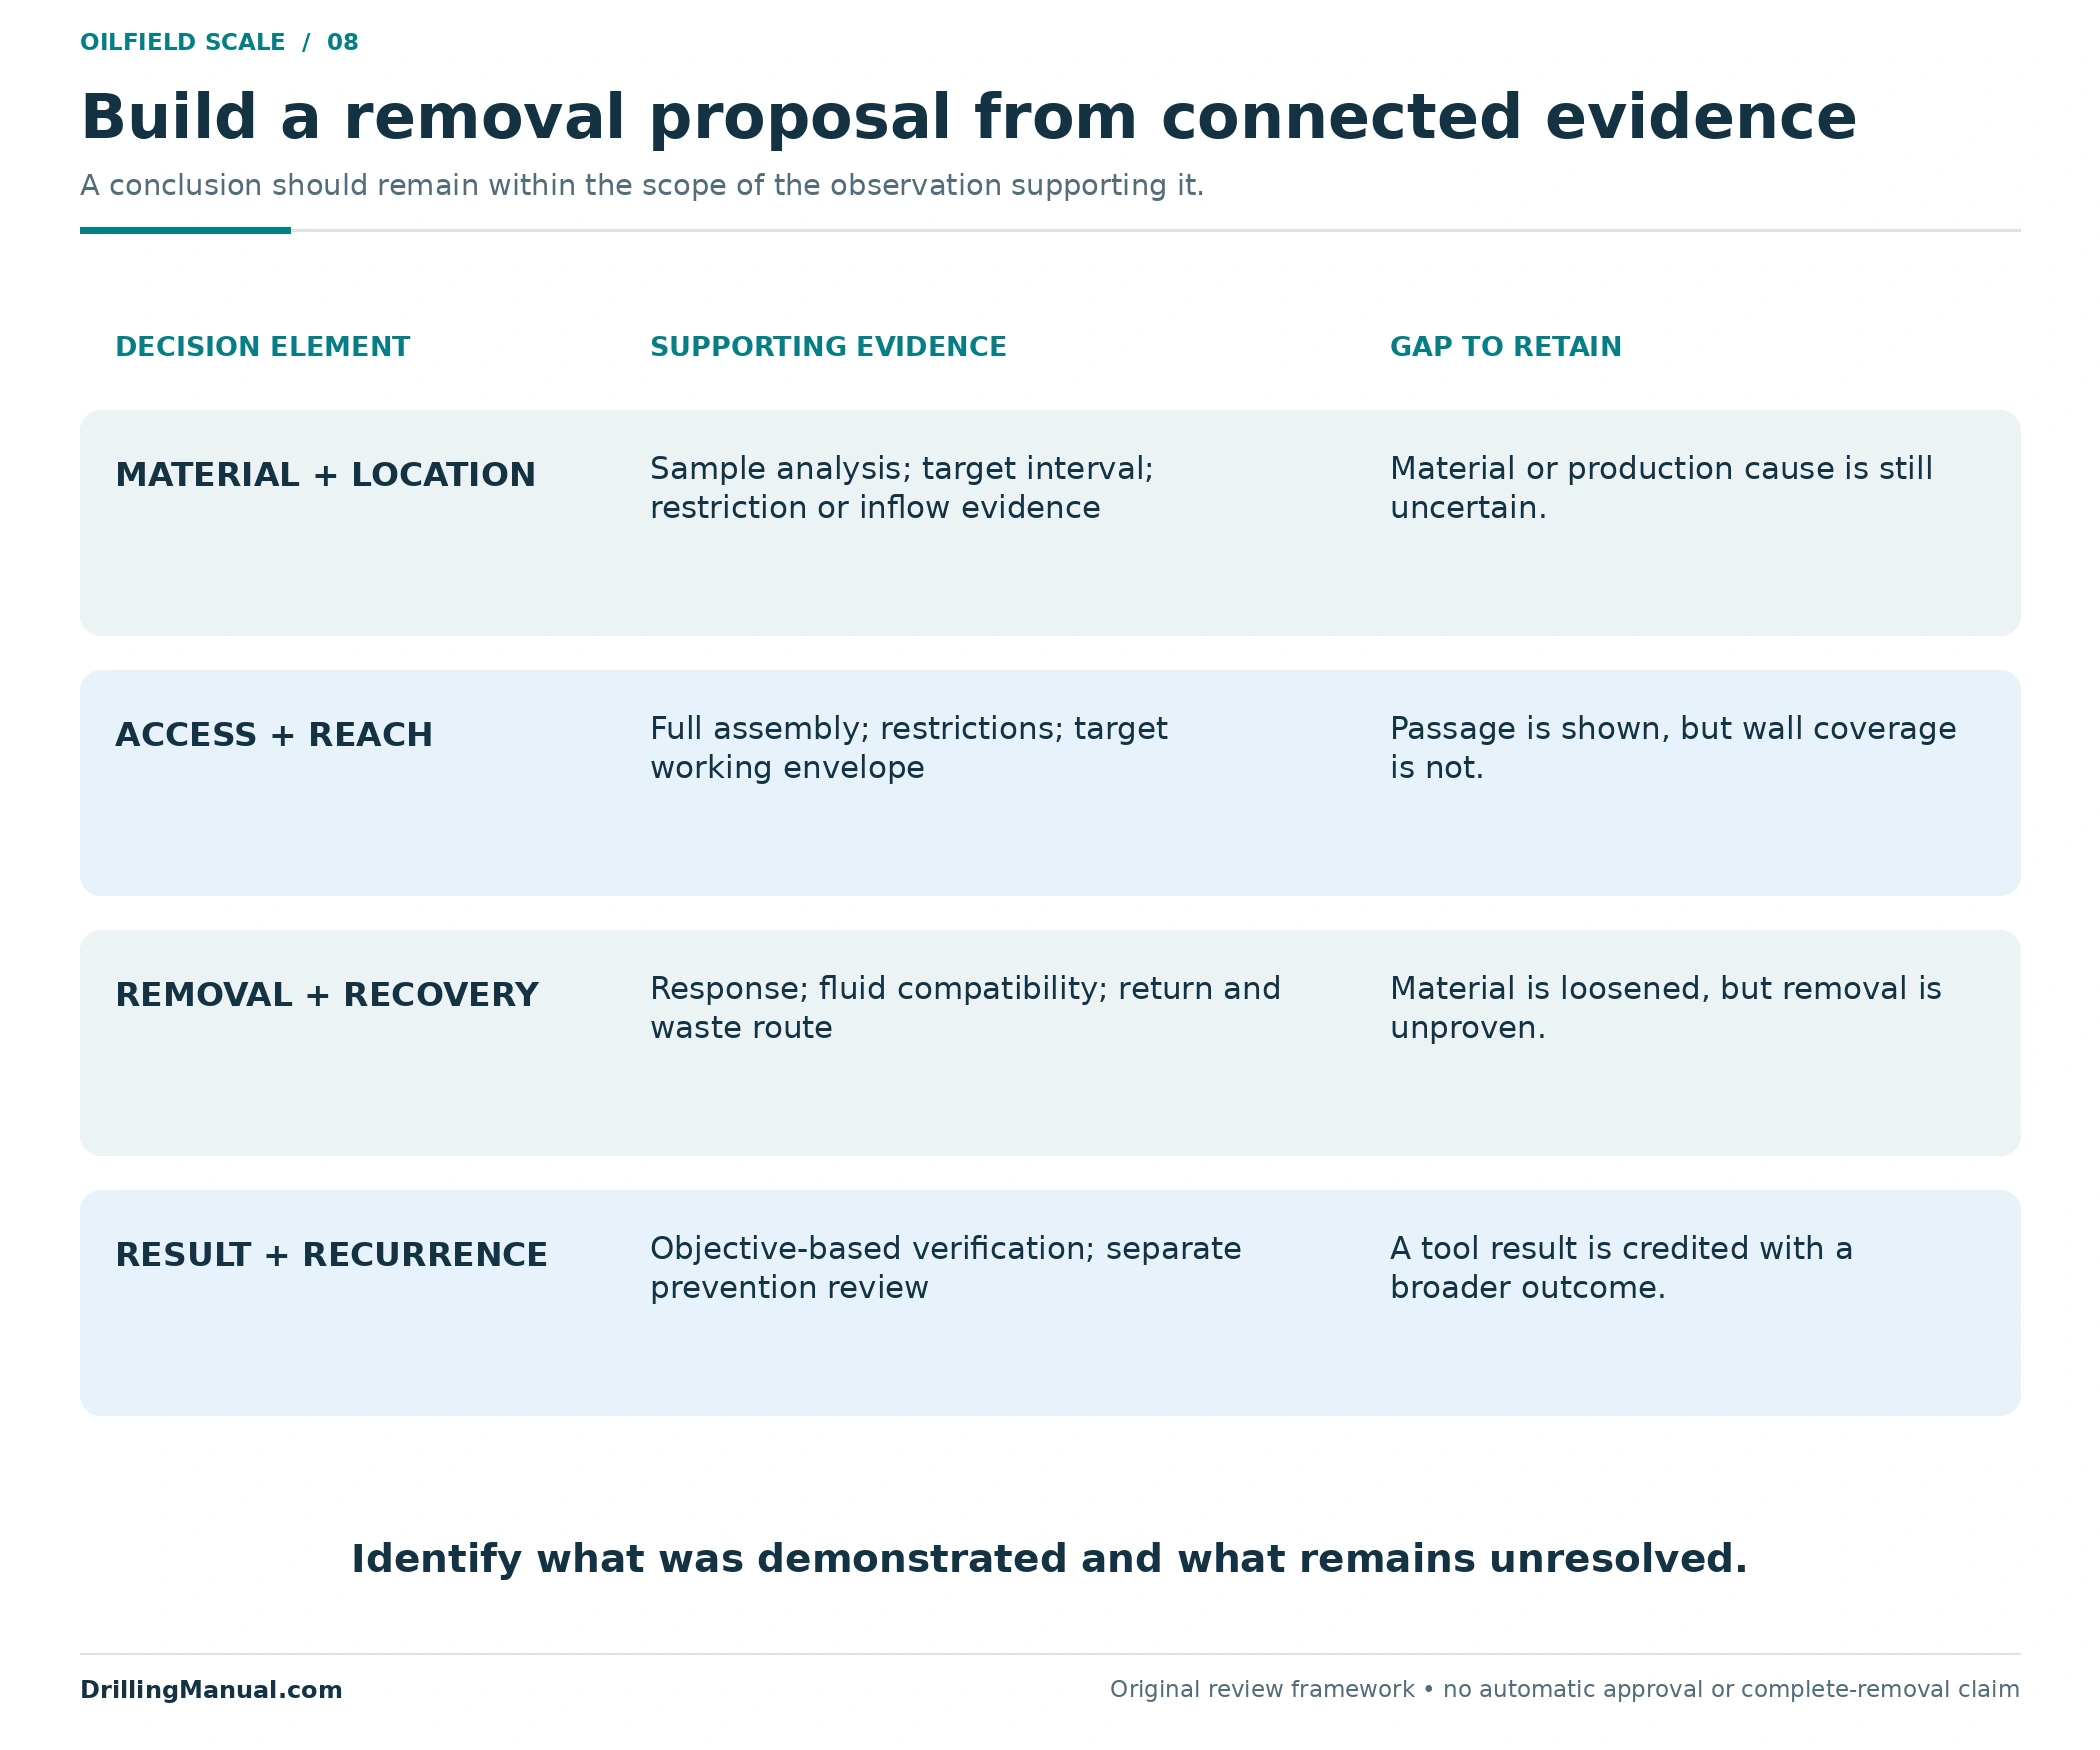
A useful proposal connects each assumption to evidence. It should state the target location, what is known about the material, the route and restrictions, the reason for the chosen mechanism, and how treatment products will be managed. The source’s planning inputs include the completion geometry, directional survey, fluid properties, deposit properties, target conditions and surface configuration. The following framework organizes those inputs around the decision. [1, printed pp. 11-83, 12-57–12-58; PDF pp. 380, 466–467]
| Decision element | Evidence to connect | Gap to make explicit |
|---|---|---|
| Material and location | Recovered sample analysis, observed restriction and relevant history. | Uncertain identity or an unconfirmed connection to the production loss. |
| Access and working envelope | Completion dimensions, target depth and full assembly requirements. | A tool that can pass but cannot treat the intended surface. |
| Removal and recovery | Applicable treatment response, fluid compatibility and the complete return route. | Unresolved placement, transport or waste-handling requirements. |
| Outcome and recurrence | Evidence tied to the original objective and a separate recurrence assessment. | Access restoration presented as proof of improved inflow or permanent prevention. |
The final decision on scale deposition in oil wells should explain why the proposed intervention addresses the identified problem. The workover-operations guide places that intervention within the wider access and equipment decision. A well-defined removal objective helps prevent a technically successful tool run from being credited with a result it never measured.
Oilfield scale questions
Does falling production prove scale deposition in oil wells?
No. The manual specifically distinguishes a bore-deposit or gauge finding from the principal cause of reduced production. Connect the observation to the proposed mechanism and target location before choosing a treatment. [1, printed pp. 11-83, 12-58; PDF pp. 380, 467]
Can the deposit be identified by appearance?
Appearance can describe the recovered material, but it does not establish its exact composition. The source recommends sample analysis and treatment-fluid testing, with particular attention to mixed deposits. [1, printed pp. 12-58–12-59; PDF pp. 467–468]
Will one acid treatment remove every scale type?
No single treatment is established for every deposit. The source distinguishes mineral families and mixed material, with different response and removal considerations. The actual sample and well application must guide selection. No universal acid recipe is supplied here. [1, printed pp. 11-84, 12-58–12-59; PDF pp. 381, 467–468]
Does a passing gauge prove complete scale removal?
It demonstrates passage of that body over its documented route. Material can remain outside the opening it traversed, especially where the target bore is larger than the treated envelope. Passage alone also does not establish the condition of the surrounding formation. [1, printed pp. 12-58, 12-60; PDF pp. 467, 469]
Does a 46% area reduction mean a 46% oil-rate loss?
No. The worked example is a geometric calculation for an assumed circular opening. It does not model well performance. The production effect requires the actual flow conditions and the other possible restrictions or impairments.
Can scale deposition in oil wells recur after removal?
Removal and prevention are separate objectives. The source discusses well-specific inhibition after scale removal, so a successful removal result should not be treated as proof that future deposition has been prevented. [1, printed p. 12-62; PDF p. 471]
Book reference
- NOV CTES. Coiled Tubing Manual. Copyright 2007–2013; selected pages revised June 27, 2014. “Removing Scale Hydraulically,” printed pp. 11-82–11-84, PDF pp. 379–381; “Removing Scale Mechanically,” printed pp. 12-57–12-63, PDF pp. 466–472. The discussion uses deposit identity, planning inputs, removal mechanisms, access and recovery principles. Historical operating settings, generic procedures and equipment-performance generalizations are not adopted as universal requirements.