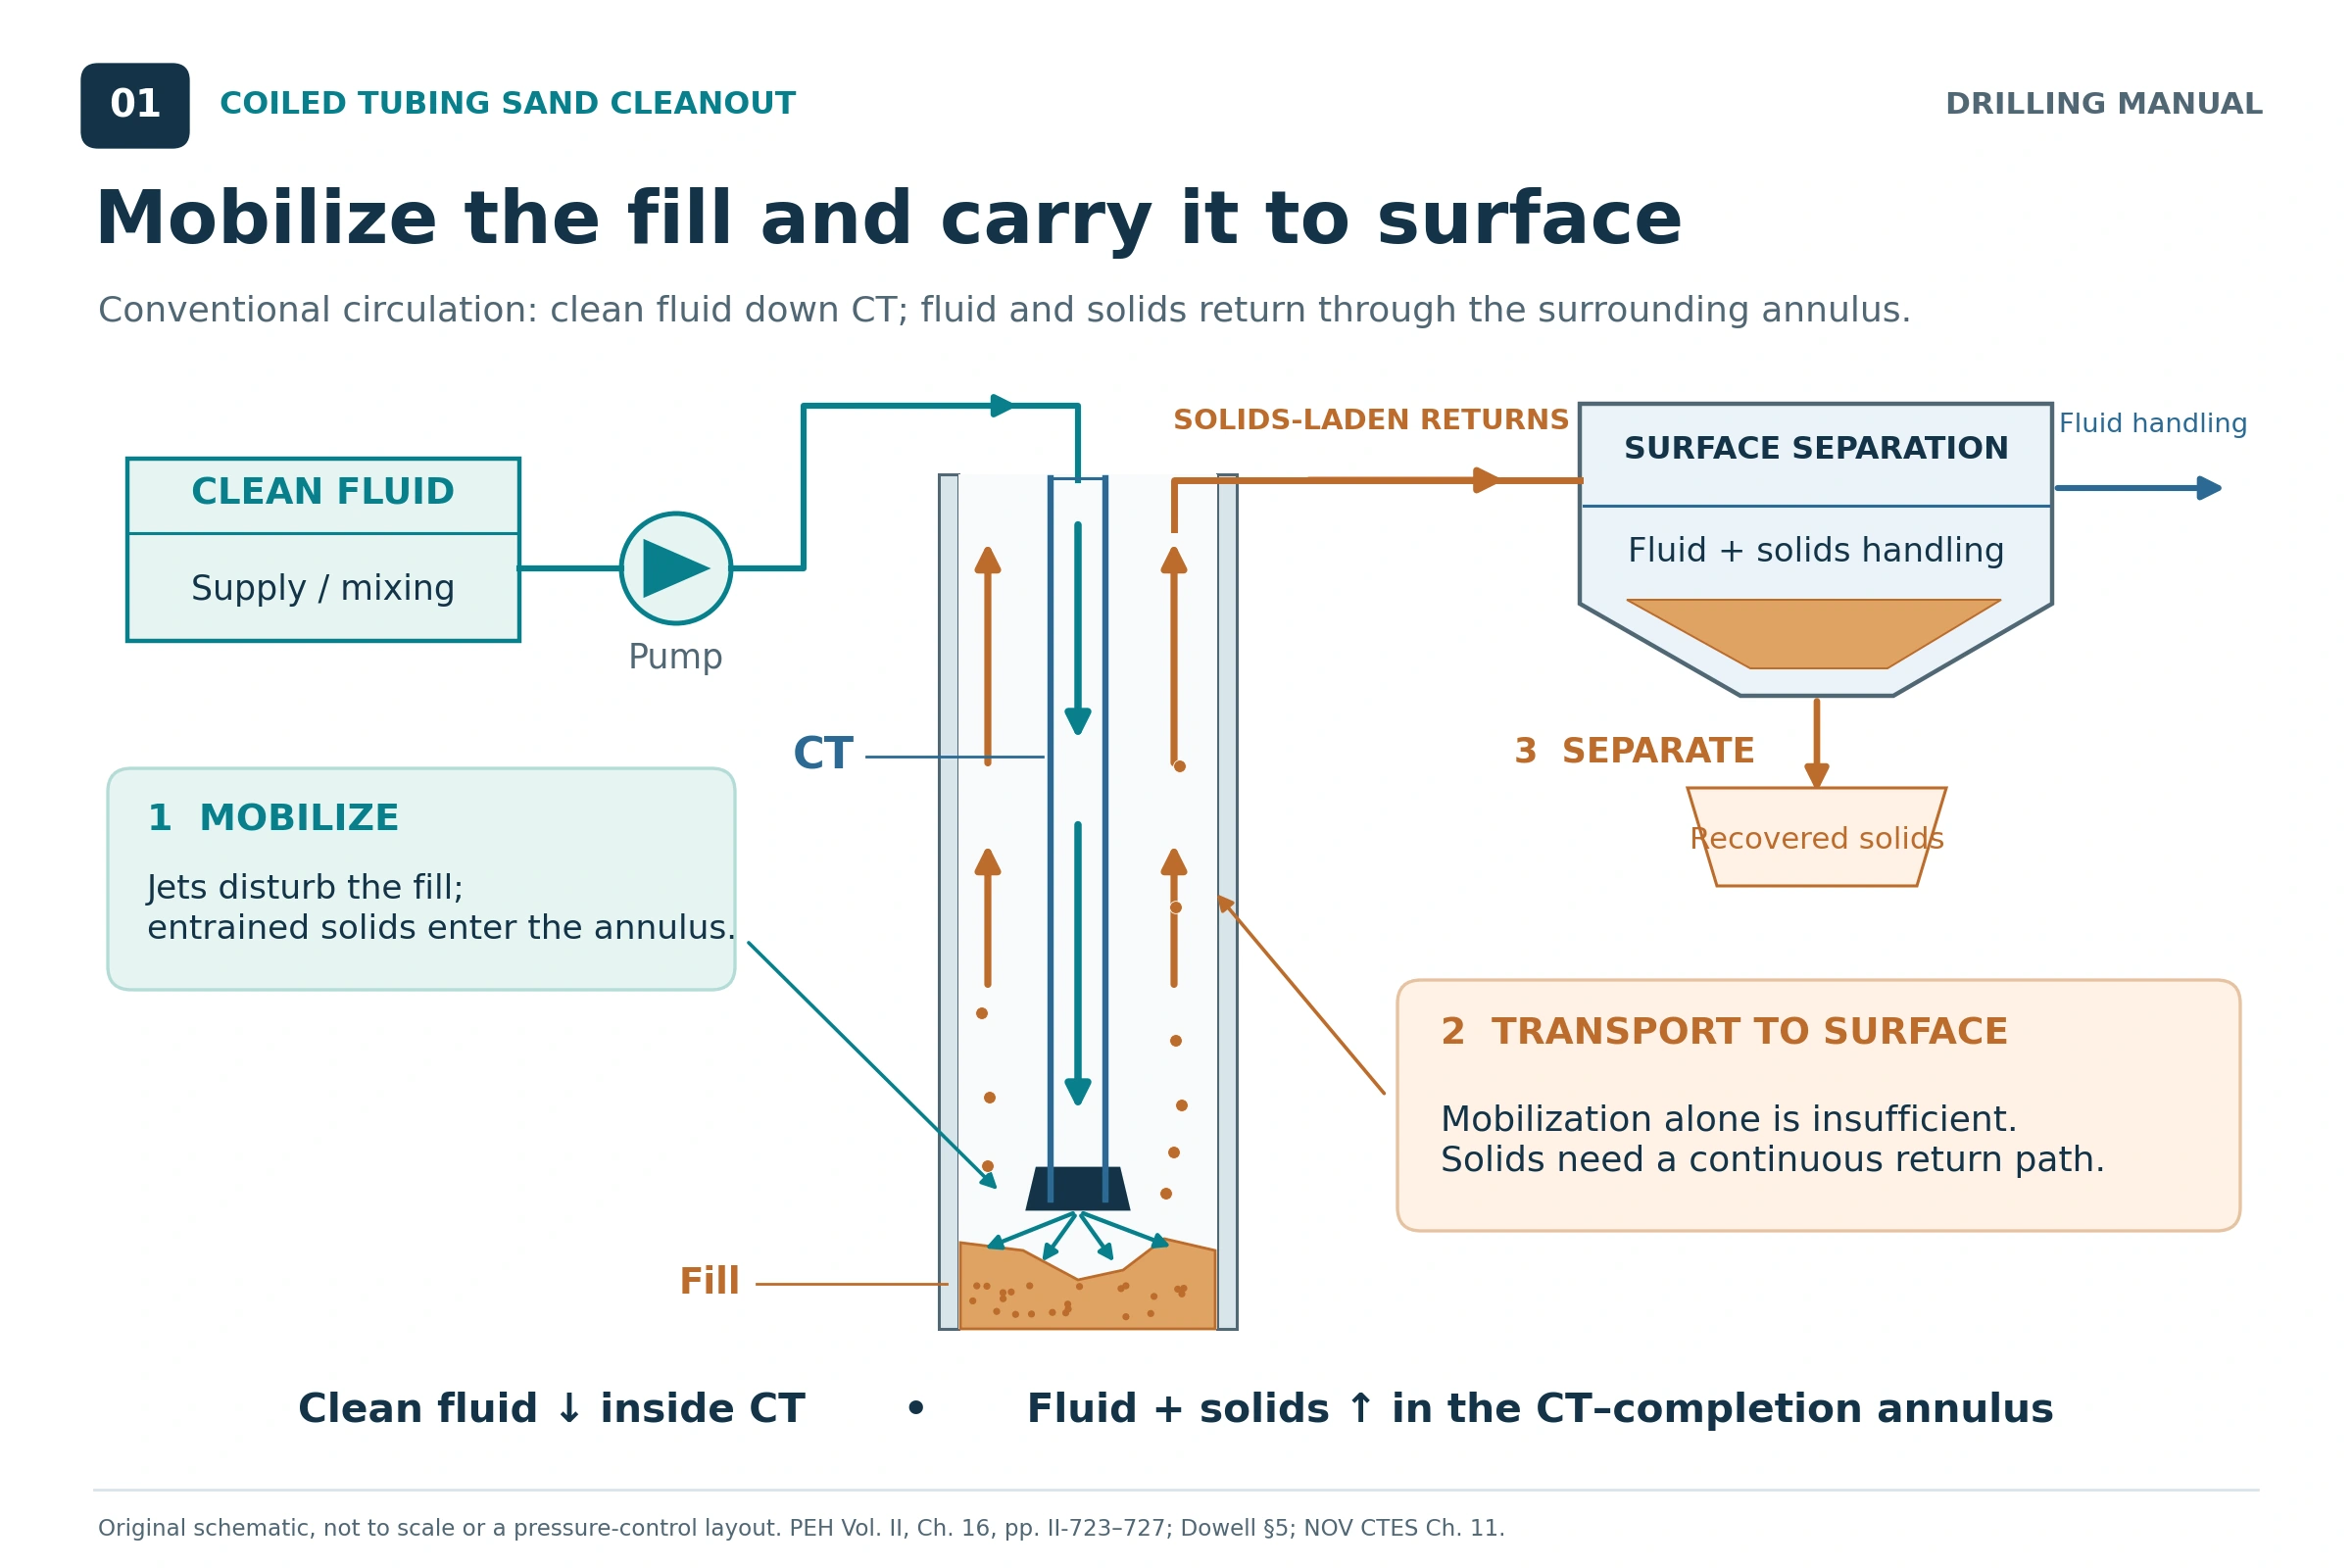
Coiled tubing sand cleanout removes accumulated fill by loosening it, entraining it in a circulating fluid and carrying it through the return path to surface. In addition, a successful treatment needs enough transport capacity throughout the well, a fluid compatible with the completion and formation, and operating pressures that preserve the planned circulation system. However, strong jetting at the nozzle is only one part of that job [1, 2, 3].
Therefore, the practical challenge is matching the rate at which sand enters the fluid to the rate at which the complete system can remove it. A tool may advance through a deposit while solids accumulate elsewhere. This article focuses on that planning problem; the coiled tubing guide covers the wider equipment and application background.
What a Complete Sand Cleanout Requires
A conventional cleanout has three connected functions: first mobilize the fill at the tool, then transport it through every return-flow section, and finally separate or handle it at surface. A failure in any one can limit the operation. For example, the nozzle may leave material outside its effective coverage, a larger annulus may allow particles to settle, or surface equipment may be unable to process the incoming solids [1, 2].
Define the completion objective before selecting the treatment. Specifically, restoring passage for a particular tool, clearing a producing interval and removing a substantial bed from a deviated section are different objectives. Reaching the intended depth provides useful evidence, but does not by itself demonstrate full-bore clearance [1, 2].
Applications of Coiled Tubing Sand Cleanout
The cited references identify several applications, including restoring production, reopening access for wireline or service tools and clearing material around flow-control devices. Fill removal can also maintain space below a producing interval and prepare the well for subsequent intervention. For example, fill may include formation sand, fines, returned proppant, material associated with a failed gravel pack, or workover debris [1, 2].
Before selecting a removal method, characterize the deposit. For instance, loose sand, compacted fill and a mixture containing large pieces of junk do not require the same treatment. Compacted material may therefore need mechanical assistance; particles that cannot pass through the available flow path may require a different recovery method. Investigate the source of the fill as well as its location, because removing the deposit does not necessarily prevent it from returning [1, 2].
Planning Data for Coiled Tubing Sand Cleanout
Build the design around a depth-by-depth description of both the well and the proposed work string. The useful inputs are: [1, 2]
- Flow geometry: completion IDs and depths, CT OD and ID, BHA dimensions, restrictions, changes in bore size and the intended return route.
- Well trajectory: measured depth, vertical depth, inclination and build sections where a bed may accumulate.
- Pressure and temperature: reservoir conditions, existing fluids, expected circulating conditions and the pressure limits applicable to the formation and equipment.
- Fill properties: estimated top and extent, particle-size distribution, shape, density, degree of consolidation and possible junk content.
- Fluid behavior: compatibility, density and rheology at anticipated conditions, including changes caused by contamination or gas.
- Equipment and verification: pump capability, CT mechanical condition, surface processing capacity, available fluid volume and the evidence required to confirm completion.
A sample recovered in produced fluid can be biased because it may favor particles that were easiest to transport. It may underrepresent the larger or heavier material still downhole. Use samples together with the well history, and make uncertainty in the remaining fill explicit [1, Section 5, p. 5].
Factors Affecting Sand Cleanout Performance
| Factor | Effect on the operation | Planning consequence |
|---|---|---|
| Annular area | A larger area reduces mean velocity at the same local volumetric rate. | Calculate each section, including the larger bore below production tubing. |
| Particle properties | Size, density and shape affect settling and the difficulty of transport. | Evaluate the relevant particle range, including material that is difficult to recover. |
| Deviation and CT position | Low-side beds and uneven flow complicate transport in inclined and horizontal sections. | Assess the build section and eccentric flow, rather than relying only on a vertical calculation. |
| Fluid rheology and temperature | Viscosity affects carrying capacity and pressure loss; temperature can change that behavior. | Use suitable rheology data at the expected operating conditions. |
| Nozzle pressure drop | A restrictive nozzle can consume pressure capacity and reduce attainable circulation. | Check that jetting performance and return transport can be achieved together. |
| Fill penetration rate | Faster advance can add solids faster than the fluid can remove them. | Link advance rate to the transport and pressure assessment. |
| Losses or formation inflow | Local return flow can differ from the surface injection rate. | Reassess hydraulics when the circulation balance changes. |
| Surface processing | Solids separation, fluid handling and disposal can limit sustained operation. | Include the surface system in the design capacity. |
The transport and equipment relationships above are described in the Dowell and NOV CTES cleanout chapters; the SPE handbook also explains how losses, inflow and solids loading alter the circulation system [1, 2, 3].
Vertical and Deviated Solids Transport
Vertical Transport
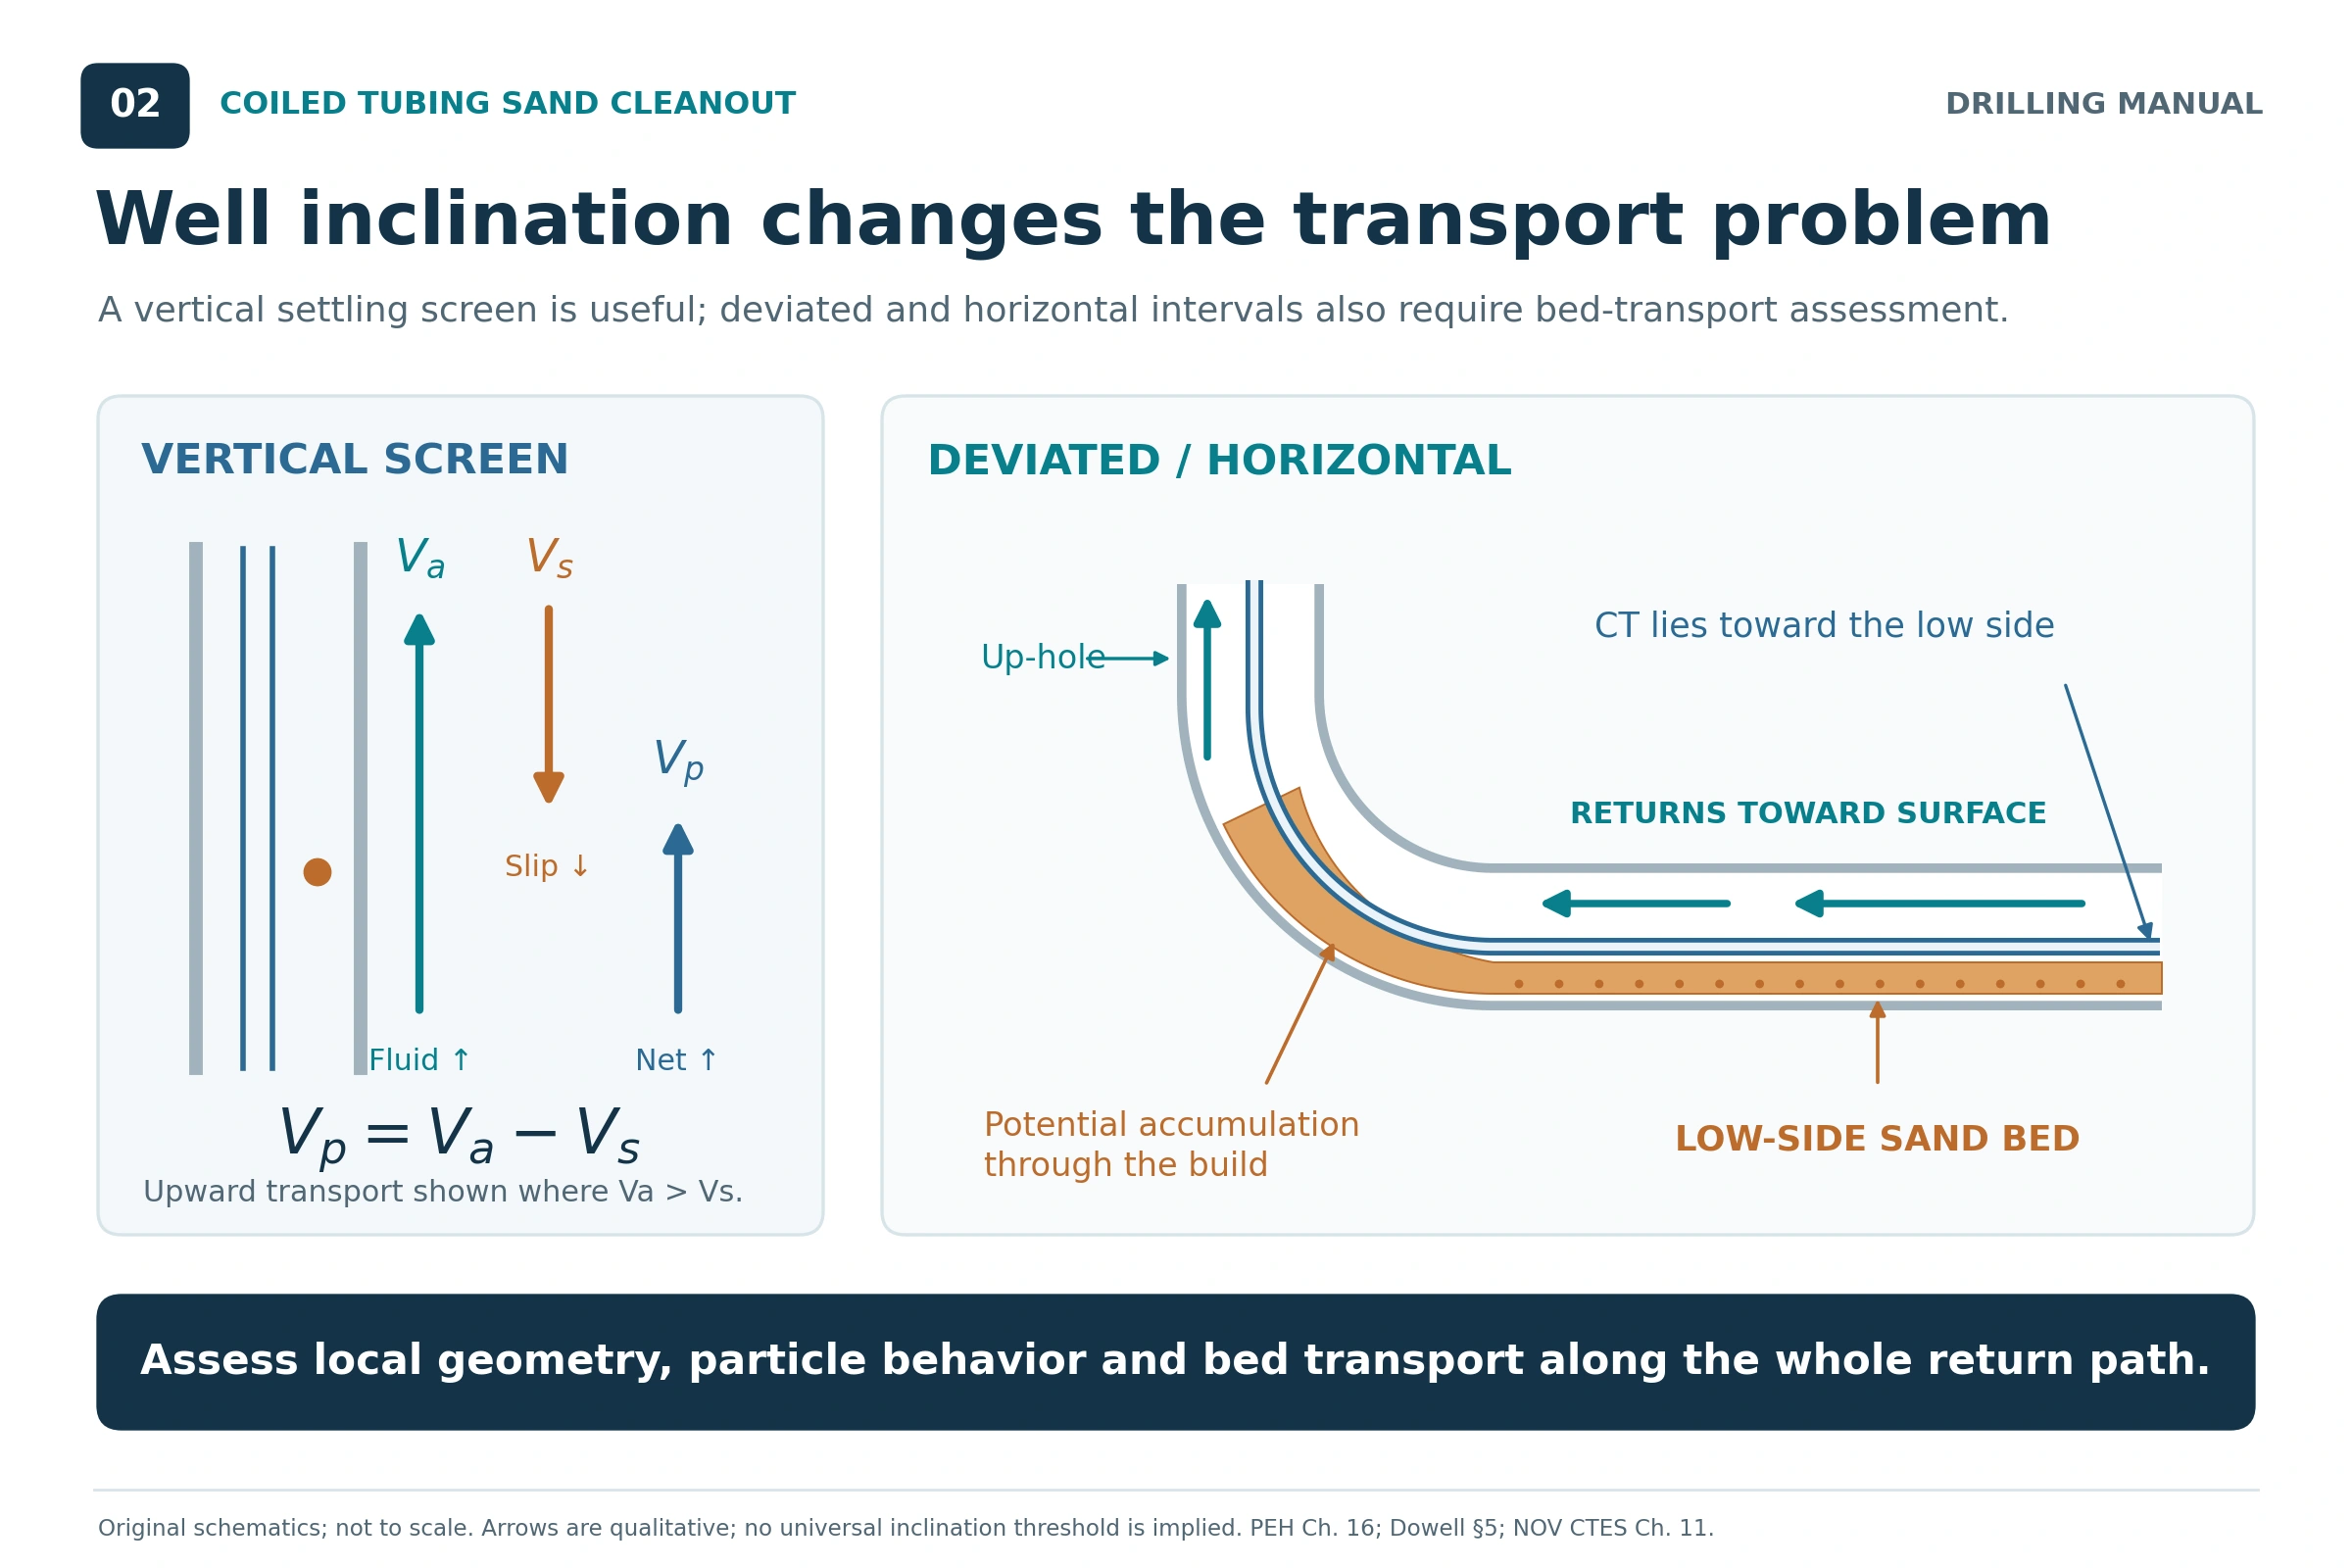
A simplified vertical model of coiled tubing sand cleanout compares upward fluid motion with downward particle slip. Therefore, the mean fluid velocity must exceed the relevant settling velocity for a positive upward particle-velocity estimate. That comparison is a useful first check, but it does not account for all effects of particle concentration, irregular geometry or the fluid’s velocity profile [1, 2].
Beds and Build Sections
In an inclined well, particles need to move only a short distance across the fluid stream before they can settle onto the low side. For example, material may travel along a horizontal section yet accumulate where it must be lifted through the build. When a bed forms, re-establishing transport can be difficult [1, 2].
Consequently, subtracting a vertical settling velocity from the mean annular velocity is not a horizontal-cleaning model. Instead, evaluate bed formation, erosion and transport along the actual trajectory. The references discuss the benefit of turbulent flow in horizontal cleaning, while also recognizing that CT pressure losses and noncentralized tubing may prevent that flow condition throughout the interval. The flow-regime discussion provides background terminology [1, 2].
Fluid Selection for Coiled Tubing Sand Cleanout
Select the fluid by considering both carrying ability and pressure behavior, together with compatibility and handling. However, a fluid that carries particles well may impose an unacceptable pressure loss; a low-density fluid may require more complex returns handling [1, 2, 3].
| Fluid system | Potential use | Main limitation to evaluate |
|---|---|---|
| Water or light brine | Jetting and circulation where the pressure conditions, compatibility and achievable velocity are suitable. | No static suspension of sand should be assumed. A wide annulus can defeat the available transport rate. |
| Gelled liquid | Improved carrying or suspension where a low-viscosity liquid is inadequate. | Added viscosity can increase friction and restrict flow; formulation and temperature affect performance. |
| Suitable oil-based liquid | Applications where density or compatibility favors a selected nonaqueous fluid. | Compatibility still requires assessment; flammability, friction and handling constrain selection. |
| Stable foam | Low-pressure or large-annulus cases requiring lower effective density and strong carrying capability. | Pressure, temperature and contamination affect stability; jetting against compacted fill and processing returns need attention. |
| Alternating liquid and nitrogen stages | Selected jobs where a single liquid system cannot satisfy pressure or velocity requirements. | The liquid stage provides the carrying capability. Stage timing and tubing movement must be coordinated. |
These are selection considerations from the cited manuals. Therefore, test the proposed fluid against the anticipated temperature and contacting fluids. The references specifically describe degradation of aqueous foams when they encounter hydrocarbons; the actual formulation and well fluids must therefore be evaluated [1, 2, 3].
Understanding Foam Quality and Local Flow
Foam quality is the gas fraction of the combined gas-and-liquid volume:
Foam quality (%) = 100 × Vgas / (Vgas + Vliquid)
Both volumes must refer to the same pressure and temperature. As the gas expands, both quality and volumetric velocity change along the return path. Therefore, a surface gas volume at standard conditions cannot be inserted directly into a downhole annular-velocity calculation. Compressible cleanouts require a pressure-and-temperature-dependent model, including the effects on friction and transport [1, 2, 3].
Coiled Tubing Sand Cleanout Calculations
1. Annular Area and Mean Velocity
For an unobstructed circular annulus, calculate area from the outer tubular’s ID and the CT’s OD. In coherent units:
Aa = π(D² − d²)/4 and va = Q/Aa
With D and d in inches, Q in US gal/min and va in ft/min:
va ≈ 24.51Q/(D² − d²)
This is a geometry-and-continuity calculation. The SPE handbook also gives the corresponding field-unit relationship in Eq. 11.5; 24.51 is the rounded unit-conversion factor used here. Use local in-situ flow. However, assuming the injection rate applies everywhere requires steady, approximately incompressible flow without losses or inflow. See the annular velocity calculation guide for related background [3].
2. A Vertical Particle-Velocity Screen
Before estimating particle movement, define vslip as downward particle velocity relative to the liquid. Then use this deliberately simplified, dilute-particle vertical estimate:
vparticle ≈ va − vslip
In other words, the subtraction is an illustrative relative-velocity model based on the manuals’ vertical settling comparison. If its result is zero or negative, it predicts no net upward transport. However, a positive result is not proof of complete cleaning: the assumed slip must be appropriate, and the model excludes beds and concentrated slurry effects [1, 2].
3. Check Every Return-Flow Section
For a constant-rate liquid system, each section has its own area and transport requirement. A derived screening relationship is:
Qrequired = max(Aj × vrequired,j)
Use consistent units and take the largest product over all sections. The section with the highest required velocity does not automatically determine the required rate because its area matters too. This is an algebraic interpretation of the manuals’ section-by-section planning approach, not a complete transport correlation [2, 3].
Coiled Tubing Sand Cleanout Example: Two Return Annuli
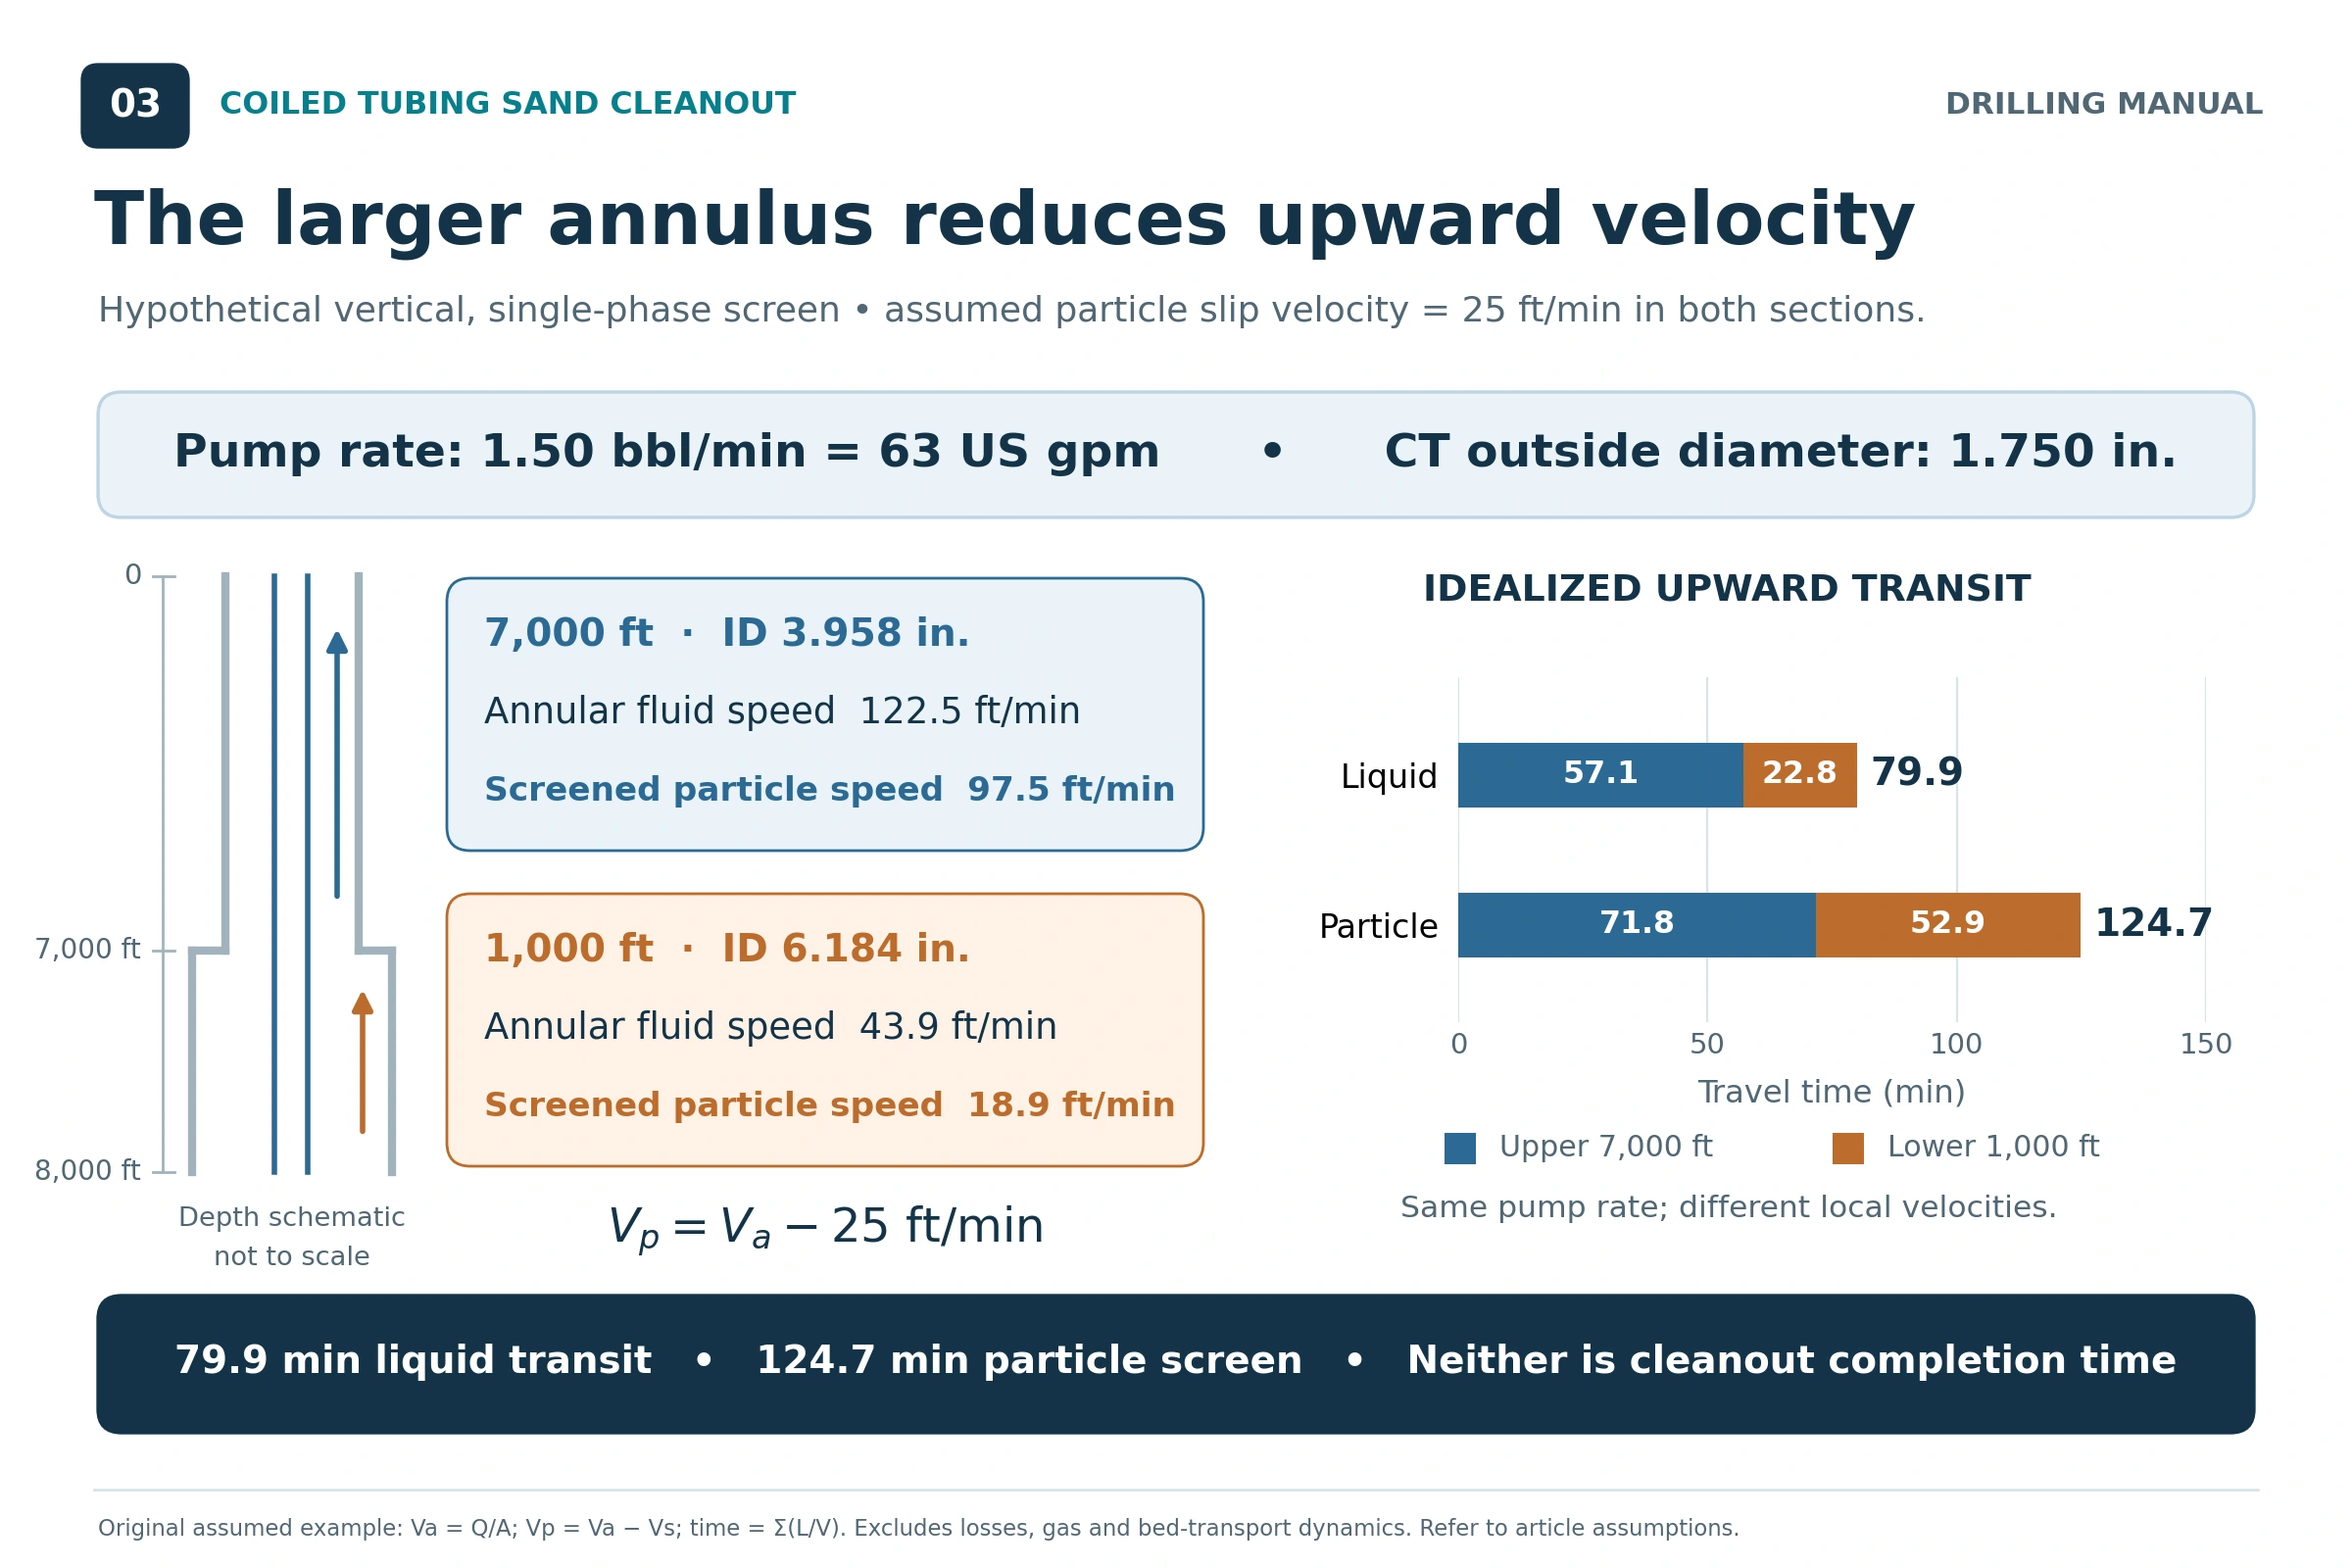
All inputs in this example are hypothetical teaching assumptions. In other words, they are not field measurements, recommended settings or book test data. Specifically, assume a vertical well, stationary CT, steady single-phase liquid, full returns and negligible solids concentration. The assumed downward slip velocity of 25 ft/min is supplied solely to demonstrate the calculation; it has not been established for a particular sand or fluid.
In this case, the CT OD is 1.75 in and the circulation rate is 1.50 bbl/min, equal to 63 US gal/min. The return path includes both a lower 1,000 ft section with 6.184 in ID and an upper 7,000 ft section with 3.958 in ID.
| Quantity | Upper tubing section | Lower casing section |
|---|---|---|
| Section length | 7,000 ft | 1,000 ft |
| Outer tubular ID | 3.958 in | 6.184 in |
| CT OD | 1.750 in | 1.750 in |
| Annular area | 0.068740 ft² | 0.191874 ft² |
| Mean upward liquid velocity | 122.5 ft/min | 43.9 ft/min |
| Assumed downward slip | 25.0 ft/min | 25.0 ft/min |
| Screened upward particle velocity | 97.5 ft/min | 18.9 ft/min |
Step 1: Calculate the Two Velocities
Upper section: va ≈ 24.51 × 63/(3.958² − 1.750²) = 122.5 ft/min
Lower section: va ≈ 24.51 × 63/(6.184² − 1.750²) = 43.9 ft/min
The lower section has approximately 2.79 times the annular area, so its mean velocity is only about 36% of the upper-section velocity. A good result inside the production tubing therefore does not establish adequate transport below it.
Step 2: Compare Liquid and Particle Transit
For the idealized return path, calculate liquid transit time from section volume divided by rate. Alternatively, sum each section length divided by its velocity. The annular capacity calculation is useful for this volume check.
tliquid = Σ(Lj/va,j) = 57.1 + 22.8 = 79.9 min
Applying the assumed particle-slip model gives:
tparticle ≈ Σ[Lj/(va,j − vslip,j)] = 71.8 + 52.9 = 124.7 min
These are bottom-to-surface return-path estimates after entry into the annulus; therefore, they exclude pumping down the CT, time to loosen the fill and additional passes. Consequently, the example shows why one liquid annular volume cannot establish that all particles have reached surface. However, the particle result is a teaching screen, not a predicted job duration.
Step 3: Apply a Qualified Screening Rule
The Dowell manual offers annular velocity of at least twice particle settling velocity as a screening guideline within its discussion of particle transport. The same discussion identifies effects that its simplified model does not cover, including particle loading [1, Section 5, p. 6].
For the assumed 25 ft/min slip, that screen becomes 50 ft/min. The upper section exceeds it, but the lower section does not. Reaching 50 ft/min in the lower annulus would require approximately 1.71 bbl/min by geometry alone. However, that number is not a pump-rate recommendation: pressure losses, formation response, solids loading and equipment capacity have not been evaluated.
Advance Rate and Solids Loading in Coiled Tubing Sand Cleanout
In coiled tubing sand cleanout, allowable penetration into fill depends on the fluid’s ability to transport the released solids within the pressure constraints. To illustrate that relationship, use a separate mass-balance calculation: [1, 2, 3]
ṁsolids = ρbulk,dry × Afill × U
Here, ρbulk,dry is dry-solids mass per bulk deposit volume, Afill is the fill cross-sectional area and U is advance rate. For example, using lbm/ft³, ft² and ft/min gives lbm/min. Then divide by carrier flow in US gal/min to obtain mass introduced per gallon of carrier.
For a hypothetical full-bore deposit in 6.184 in ID, Afill is 0.208577 ft². Assume 100 lbm of dry solids per ft³ of bulk deposit, complete removal of the penetrated volume and 63 US gal/min of carrier:
| Assumed advance rate | Calculated solids feed | Mass added per carrier gallon |
|---|---|---|
| 2 ft/min | 41.7 lbm/min | 0.662 lbm/US gal |
| 4 ft/min | 83.4 lbm/min | 1.324 lbm/US gal |
As a result, doubling advance doubles the calculated solids feed without increasing carrier flow. These values describe generation at the fill; they are neither allowable loadings nor predicted surface concentrations. Slip, accumulation, losses and the volume occupied by solids also alter the returning mixture. However, this moving-tool comparison is separate from the stationary-CT transit example.
Pressure and Equipment Limits for Coiled Tubing Sand Cleanout
For a conventional, liquid-filled return path, the pressure at an exposed interval can be viewed as the combination of surface return pressure and hydrostatic pressure, together with annular friction between that interval and surface. For example, increasing rate or adding solids can change that balance. A liquid column that appears acceptable statically may behave differently while circulating [1, 3].
Use vertical depth for the hydrostatic pressure component; use the actual flow-path geometry and length for friction. If more injected fluid is lost into the formation, a higher surface pump rate may fail to produce the intended increase in returning flow. Evaluate pressure at the relevant exposed intervals, rather than treating a surface gauge as the complete downhole assessment [1, 3].
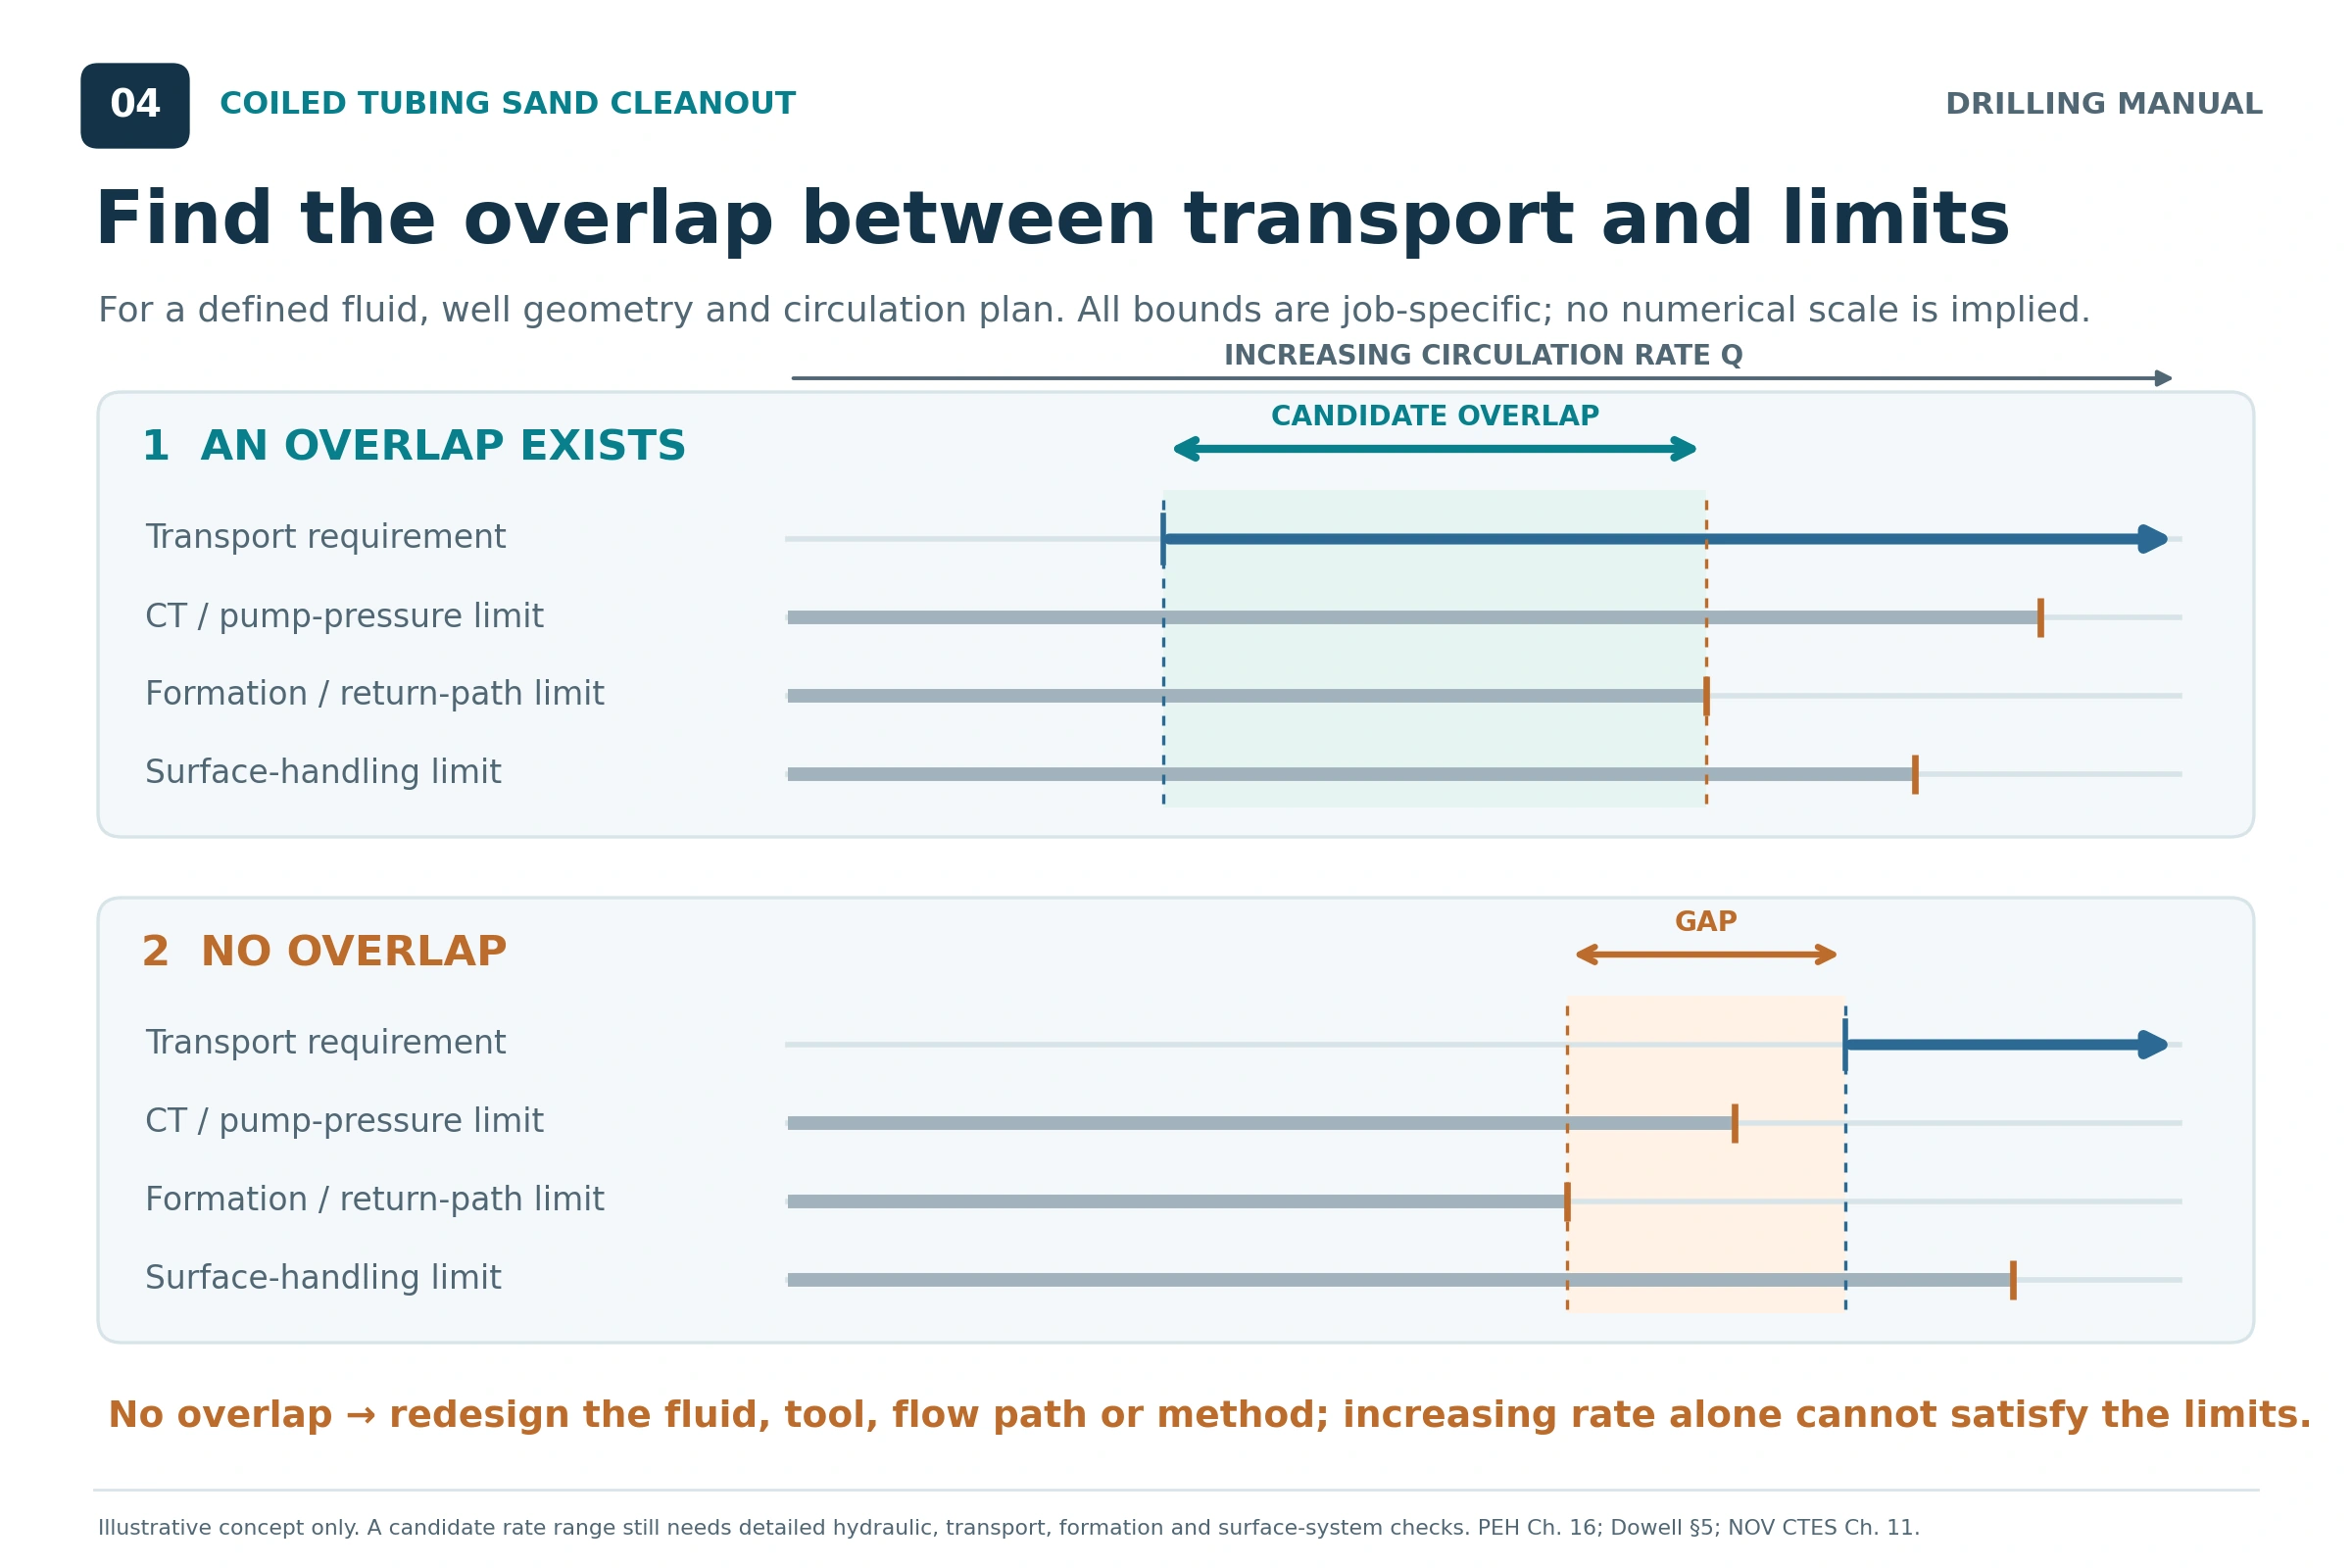
A coiled tubing sand cleanout design needs an overlap between the rate required for transport and the rate permitted by the complete system. NOV CTES describes checking minimum transport in every section, maximum flow at the allowed circulating conditions, and solids loading at that flow. CT pressure and mechanical capability, nozzle restrictions and surface processing also influence feasibility [2].
If the requirements do not overlap, reconsider the fluid, CT size, nozzle, solids feed or removal method. The larger CT option must still fit the completion and satisfy mechanical and annular-pressure constraints. Repeated local cycling also consumes CT fatigue life, so repeated passes have a mechanical consequence as well as a time cost [1, 2, 3].
Conventional and Reverse Circulation
Conventional circulation sends clean fluid down the CT while returning solids through the surrounding annulus. It is the principal arrangement discussed in this article. In contrast, reverse circulation sends fluid down the annulus and brings solids up the CT bore, potentially obtaining a higher return velocity in that smaller area [3].
The SPE handbook generally limits reverse cleanouts to incompressible-fluid applications, so the foam and gas-stage options above should not be assumed suitable for that flow path. Reverse circulation is a separate engineered configuration, with plugging, internal friction and external-pressure collapse as significant considerations. Therefore, the BHA and the CT pressure-control arrangement must support the intended flow path and barrier requirements. However, a better velocity calculation alone does not authorize changing circulation direction or altering check valves [3].
Monitoring Coiled Tubing Sand Cleanout Results
Record pump rate and pressure, return behavior, CT depth and weight, fluid properties and the solids recovered. Interpret trends together because the same pressure change can have several causes; consider recovered material alongside the transport delay. The following are planning interpretations of the source relationships, not a substitute for a job-specific response procedure [1, 2, 3].
| Observation | Possible significance | Check against |
|---|---|---|
| Advance with little recovered sand | Transport lag, incomplete entrainment or accumulation elsewhere may explain the mismatch. | Expected delay, fill estimate, return rate and the complete flow path. |
| Rising pressure at similar rate | Loading, changing rheology or a developing restriction may be contributing. | Fluid properties, CT/BHA behavior, returns and pressure limits. |
| Declining returns | The circulation balance may have changed. | Injected and returned volumes, pressure behavior and formation communication. |
| Increasing drag or abnormal CT weight | Mechanical interaction or accumulating solids may be affecting movement. | Predicted forces and the agreed operating envelope. |
| Surface solids exceed processing capacity | The surface system has become a limiting part of the job. | Separation throughput, storage and the planned solids-generation rate. |
Choose the verification method for coiled tubing sand cleanout to match the original objective. For example, the Dowell manual discusses a drift or gauge run as one means of assessing passage. Clearer returns and achieved depth are supporting observations, but neither establishes complete removal from every part of a deviated bore. Document what was demonstrated, what material was recovered and any remaining uncertainty [1, 2].
Coiled Tubing Sand Cleanout: Rules of Thumb and Limits
- Check the largest return-flow areas. This matters because, at a constant liquid rate, greater area means lower mean velocity. Restrictions also deserve attention because they can increase friction, bridging and erosion risk [1, 2, 3].
- Keep jetting and transport in the same calculation. A nozzle pressure drop that limits circulation may undermine removal even when it improves local breakup [2].
- Treat the twice-settling rule as a limited screen. The historical Dowell guideline does not establish a universal cleaning rate or validate horizontal bed transport [1].
- Do not equate liquid lag with solids removal time. For example, the original worked example shows how particle slip lengthens the estimated return journey.
- Match advance to removal capacity. Faster penetration increases the solids feed, but the limiting loading depends on the actual hydraulic and pressure assessment [1, 2].
- Do not rely on water or light brine to hold sand stationary. Because their transport capability depends on continuing fluid motion, interruptions require the planned contingency [1, 2].
- Use actual downhole conditions for foam and gas. Surface settings do not define a uniform gas fraction or velocity throughout the well [1, 2, 3].
- Include surface separation in the capacity check. The surface equipment must handle the return rate and solids delivered to it [1, 2].
Limitations of Coiled Tubing Sand Cleanout Calculations
The simplified coiled tubing sand cleanout calculations establish geometry, mean velocity and the consequences of stated assumptions. However, they do not predict bed erosion, particle-size segregation, concentrated-slurry behavior, changing rheology, transient losses or influx, multiphase flow, CT fatigue life or a complete pressure-control program. The source manuals use hydraulic and mechanical modeling to address the broader design [1, 2, 3].
Average annular velocity also conceals local differences around eccentric CT. A positive vertical particle-velocity estimate cannot prove that a low-side bed will move. These limitations are particularly relevant to solids accumulation and sticking. Each example here is an instructional calculation, with no universal minimum rate, allowable solids concentration or penetration speed implied [1, 2].
Frequently Asked Questions
What Is the Best Fluid for Coiled Tubing Sand Cleanout?
There is no single best fluid for every well. Instead, select for transport, pressure conditions, temperature, compatibility and surface handling. Water or brine can work when adequate velocity is achievable; gels, foam or staged systems introduce different carrying benefits and constraints [1, 2, 3].
Does a Higher Pump Rate Always Improve Cleanout?
It increases mean velocity when the same liquid rate reaches the return path. However, the practical benefit can be limited by friction, pressure capacity, losses, erosion or processing capacity. The complete circulation response determines whether the increase helps [1, 2, 3].
Can the Tool Reach Bottom While Sand Remains?
Yes. For example, the references caution that jetting does not assure full-bore cleaning, and material can remain in beds or outside the effective tool coverage. Define and verify the required clearance rather than using depth alone as the acceptance criterion [1, 2].
Technical References
[1] Schlumberger Dowell, Coiled Tubing Client School Manual, Section 5, “Conventional Coiled Tubing Applications,” wellbore fill removal, pp. 1–16. The cited material covers design data, settling, deviation, fluids, tubing movement and evaluation.
[2] NOV CTES, Coiled Tubing Manual, revision dated 27 June 2014, Chapter 11, “Removing Fill or Sand From a Wellbore,” pp. 11-7–11-25. NOV CTES manual request.
[3] Petroleum Engineering Handbook, Volume II: Drilling Engineering, Robert F. Mitchell, editor, Society of Petroleum Engineers, 2006. Chapter 3, p. II-120, Eq. 3.1; Chapter 11, p. II-487, Eq. 11.5; and Chapter 16 by Alex Sas-Jaworsky II, Curtis Blount and Steve M. Tipton, pp. II-723–II-727.
The technical discussion is based on the cited editions of these references. The worked numbers, mass-balance comparison and diagrams are original instructional material derived from the stated principles and assumptions. Historical manual guidance is identified where used; equipment-specific limits require the applicable job data.