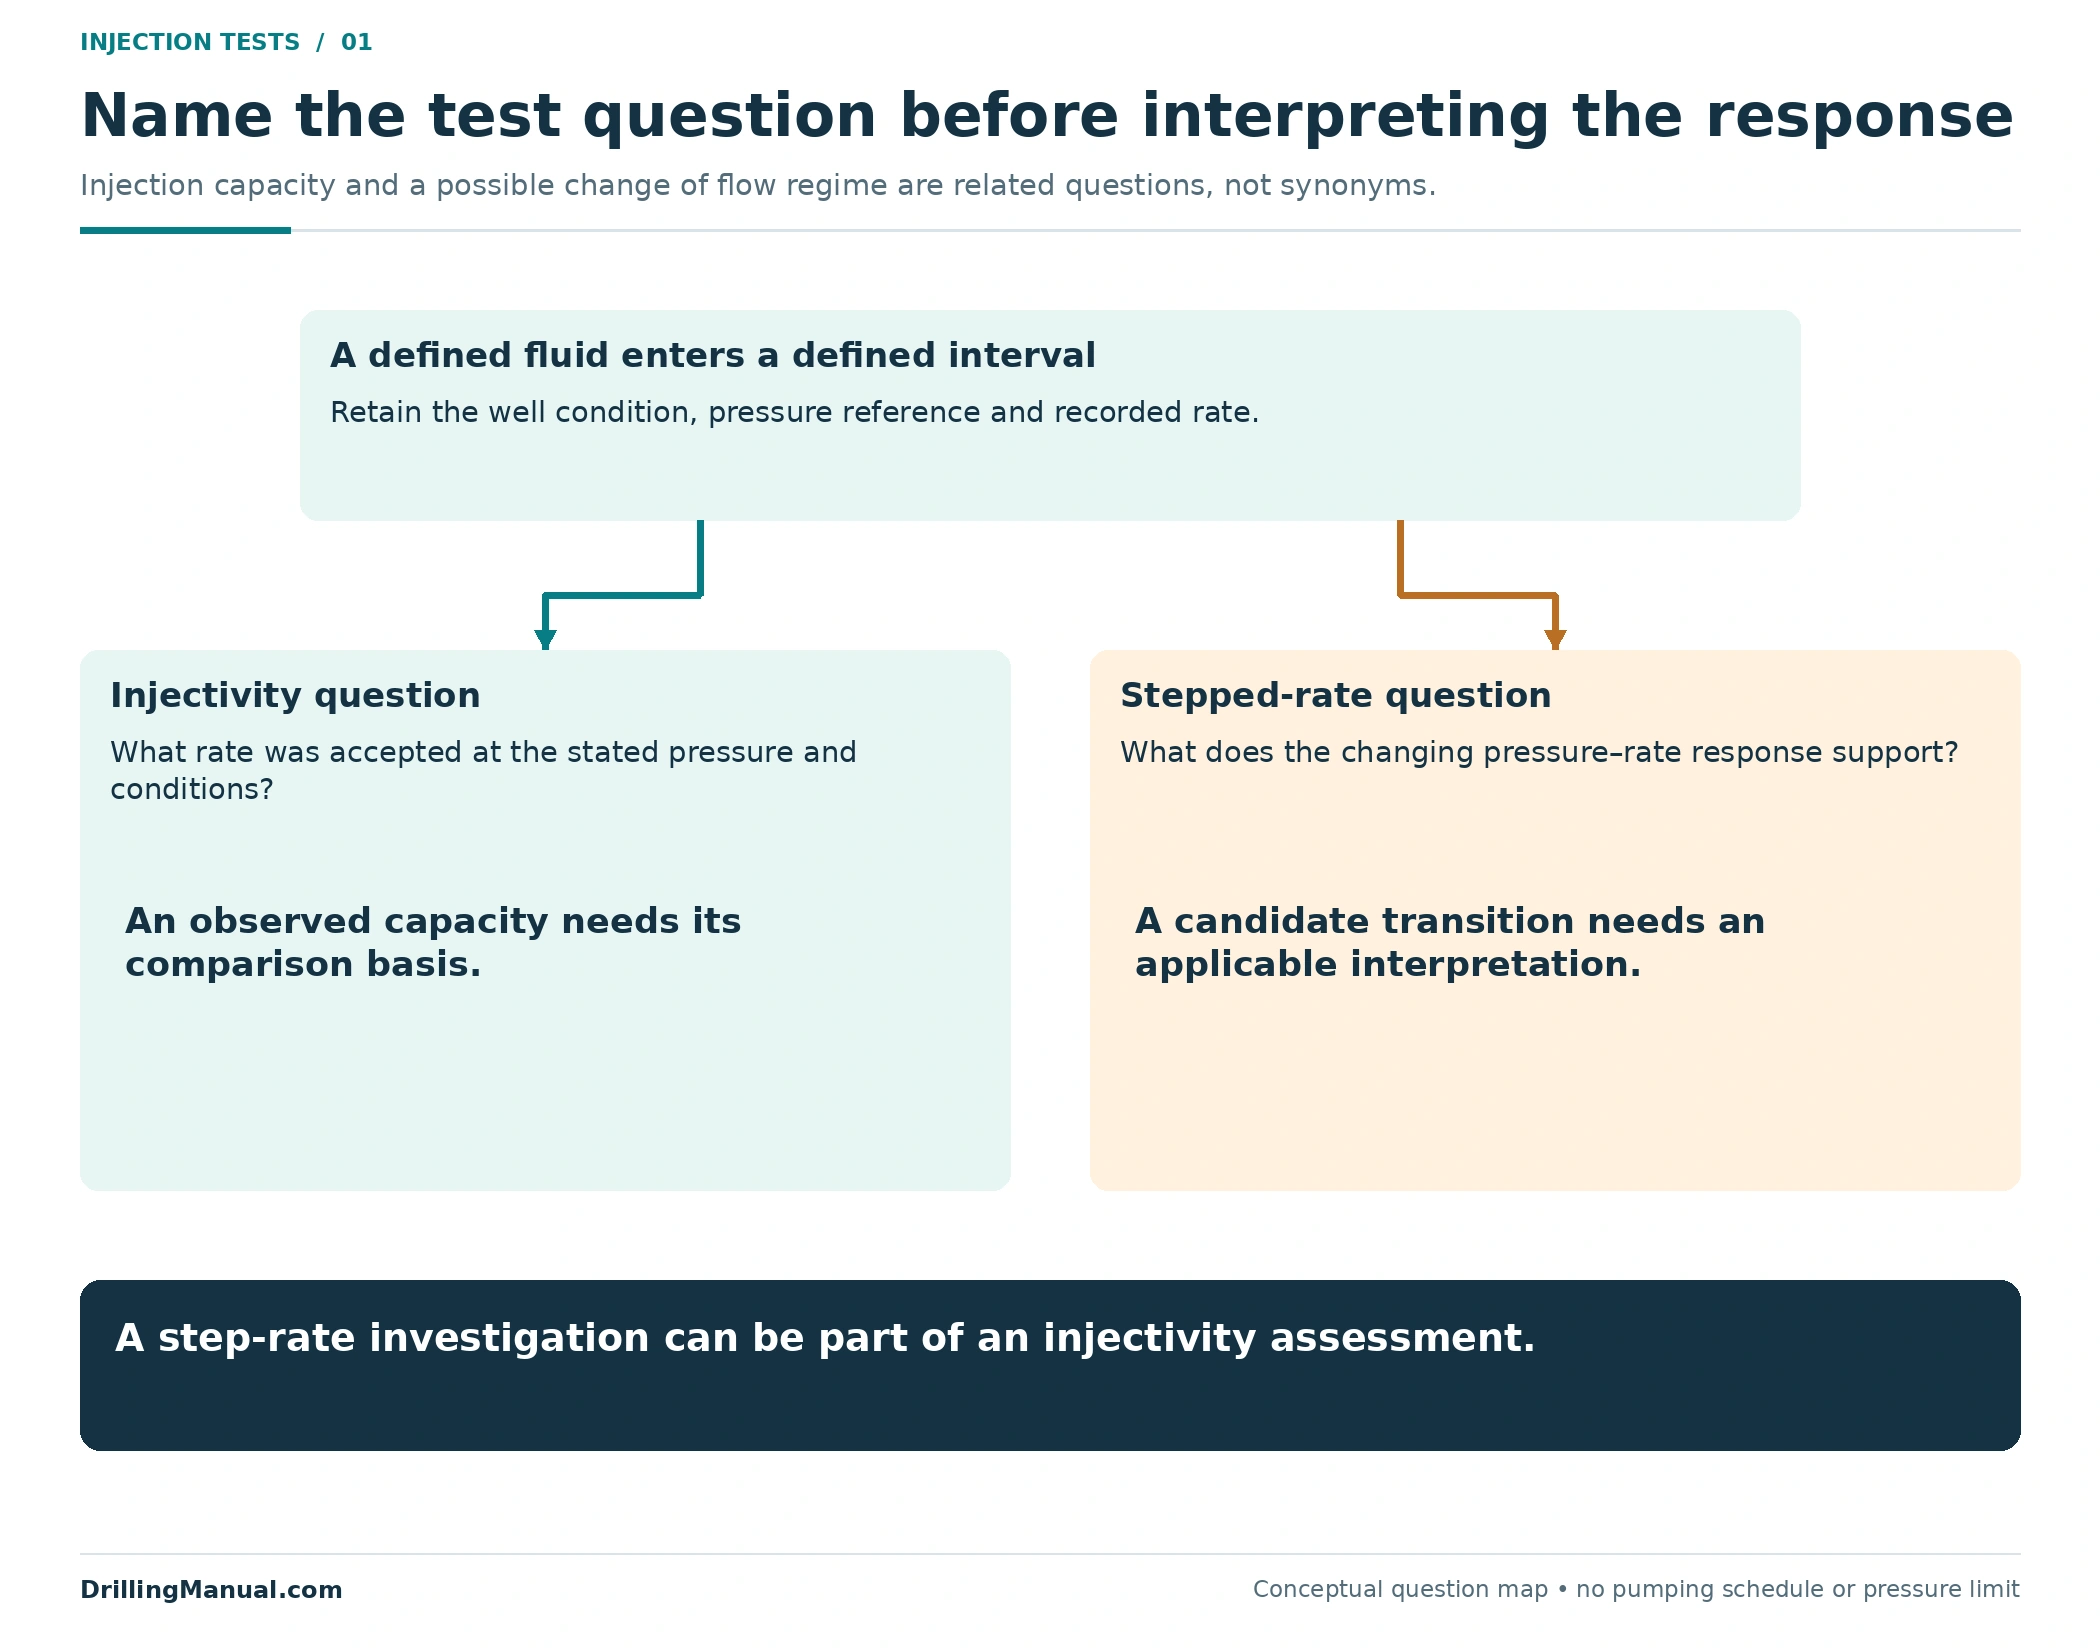
A step rate test and an injectivity test can both involve pumping into a well, but their names do not establish the same interpretation. An injectivity assessment asks how the exposed formation accepts fluid under stated conditions. A stepped-rate assessment examines how the pressure response changes as the injection rate changes. The latter can form part of the former; they are not mutually exclusive categories. [3, p. 12]
The practical distinction is between an observed capacity and an explanation for the pressure–rate relationship. A well accepting more fluid at a stated pressure is an observation. Interpreting a transition as fracture extension requires a suitable model and a defensible pressure reference. Petroleum Well Construction describes the conventional interpretation, then explicitly cautions that an unfractured well need not produce the assumed straight pressure–rate line. [1, pp. 785–786]
This guide concerns an existing injection or treatment interval. It explains what the record can support before a workover or stimulation decision. The examples use invented data to expose interpretation errors; their rates and pressures are not an operating program, equipment rating or allowable injection limit.
What Does an Injectivity Test Establish?
An injectivity test investigates the formation’s ability to receive the selected fluid. Its useful result links rate, pressure and the conditions under which those measurements were obtained. A statement such as “the well took fluid” leaves out the information needed to judge whether that response addresses the proposed operation. The historical ENI manual describes injection potential and fracture-pressure investigation within the same broader test family. [3, p. 12]
Start with the question the assessment must answer. Is the concern the rate available at a particular condition, a change following treatment, or the pressure response associated with opening or extending a fracture? Those questions can use related measurements while requiring different interpretation. Calling every pumping trial an injectivity test does not make their results interchangeable.
| Question | Useful observation | Claim still requiring support |
|---|---|---|
| What injection capacity was observed? | Fluid rate and pressure under the documented well and fluid conditions. | That the same capacity will persist under different conditions. |
| Did the response change after an intervention? | Comparable pressure–rate records before and after the change. | Which reservoir or completion mechanism caused the difference. |
| Is fracture extension indicated? | A pressure–rate response interpreted with an applicable test model. | That any visible bend uniquely identifies a fracture pressure. |
The distinction also matters when reading a completion report. Preserve the actual observations beside the interpretation. A later reviewer should be able to recover what was measured without first accepting the explanation proposed by the original analyst.
What Does a Step Rate Test Add?
A step rate test organizes injection into successive rates and relates the pressure response to those rates. In the conventional method discussed in the book, representative stabilized pressures are plotted against injection rate. The intended interpretation concerns the conditions associated with fracture extension, using the change between the lower-rate and higher-rate responses. [1, pp. 785–786]
The rate sequence supplies more information than a single operating point, but it does not remove the need for judgment. The analyst still has to decide whether the selected pressures represent comparable stages of the response, whether the measurement location is appropriate, and whether the interpretation model describes the well being assessed.
The book presents this discussion in the context of high-permeability fracturing. Its historical rates, fluids and step durations belong to that context. They are not copied here as a standard injection-well program. The transferable lesson is the relationship between the test objective, the acquired record and the interpretation—not a schedule that can be applied to any well. [1, p. 785]
Keep the Step Rate Test Pressure Reference Consistent
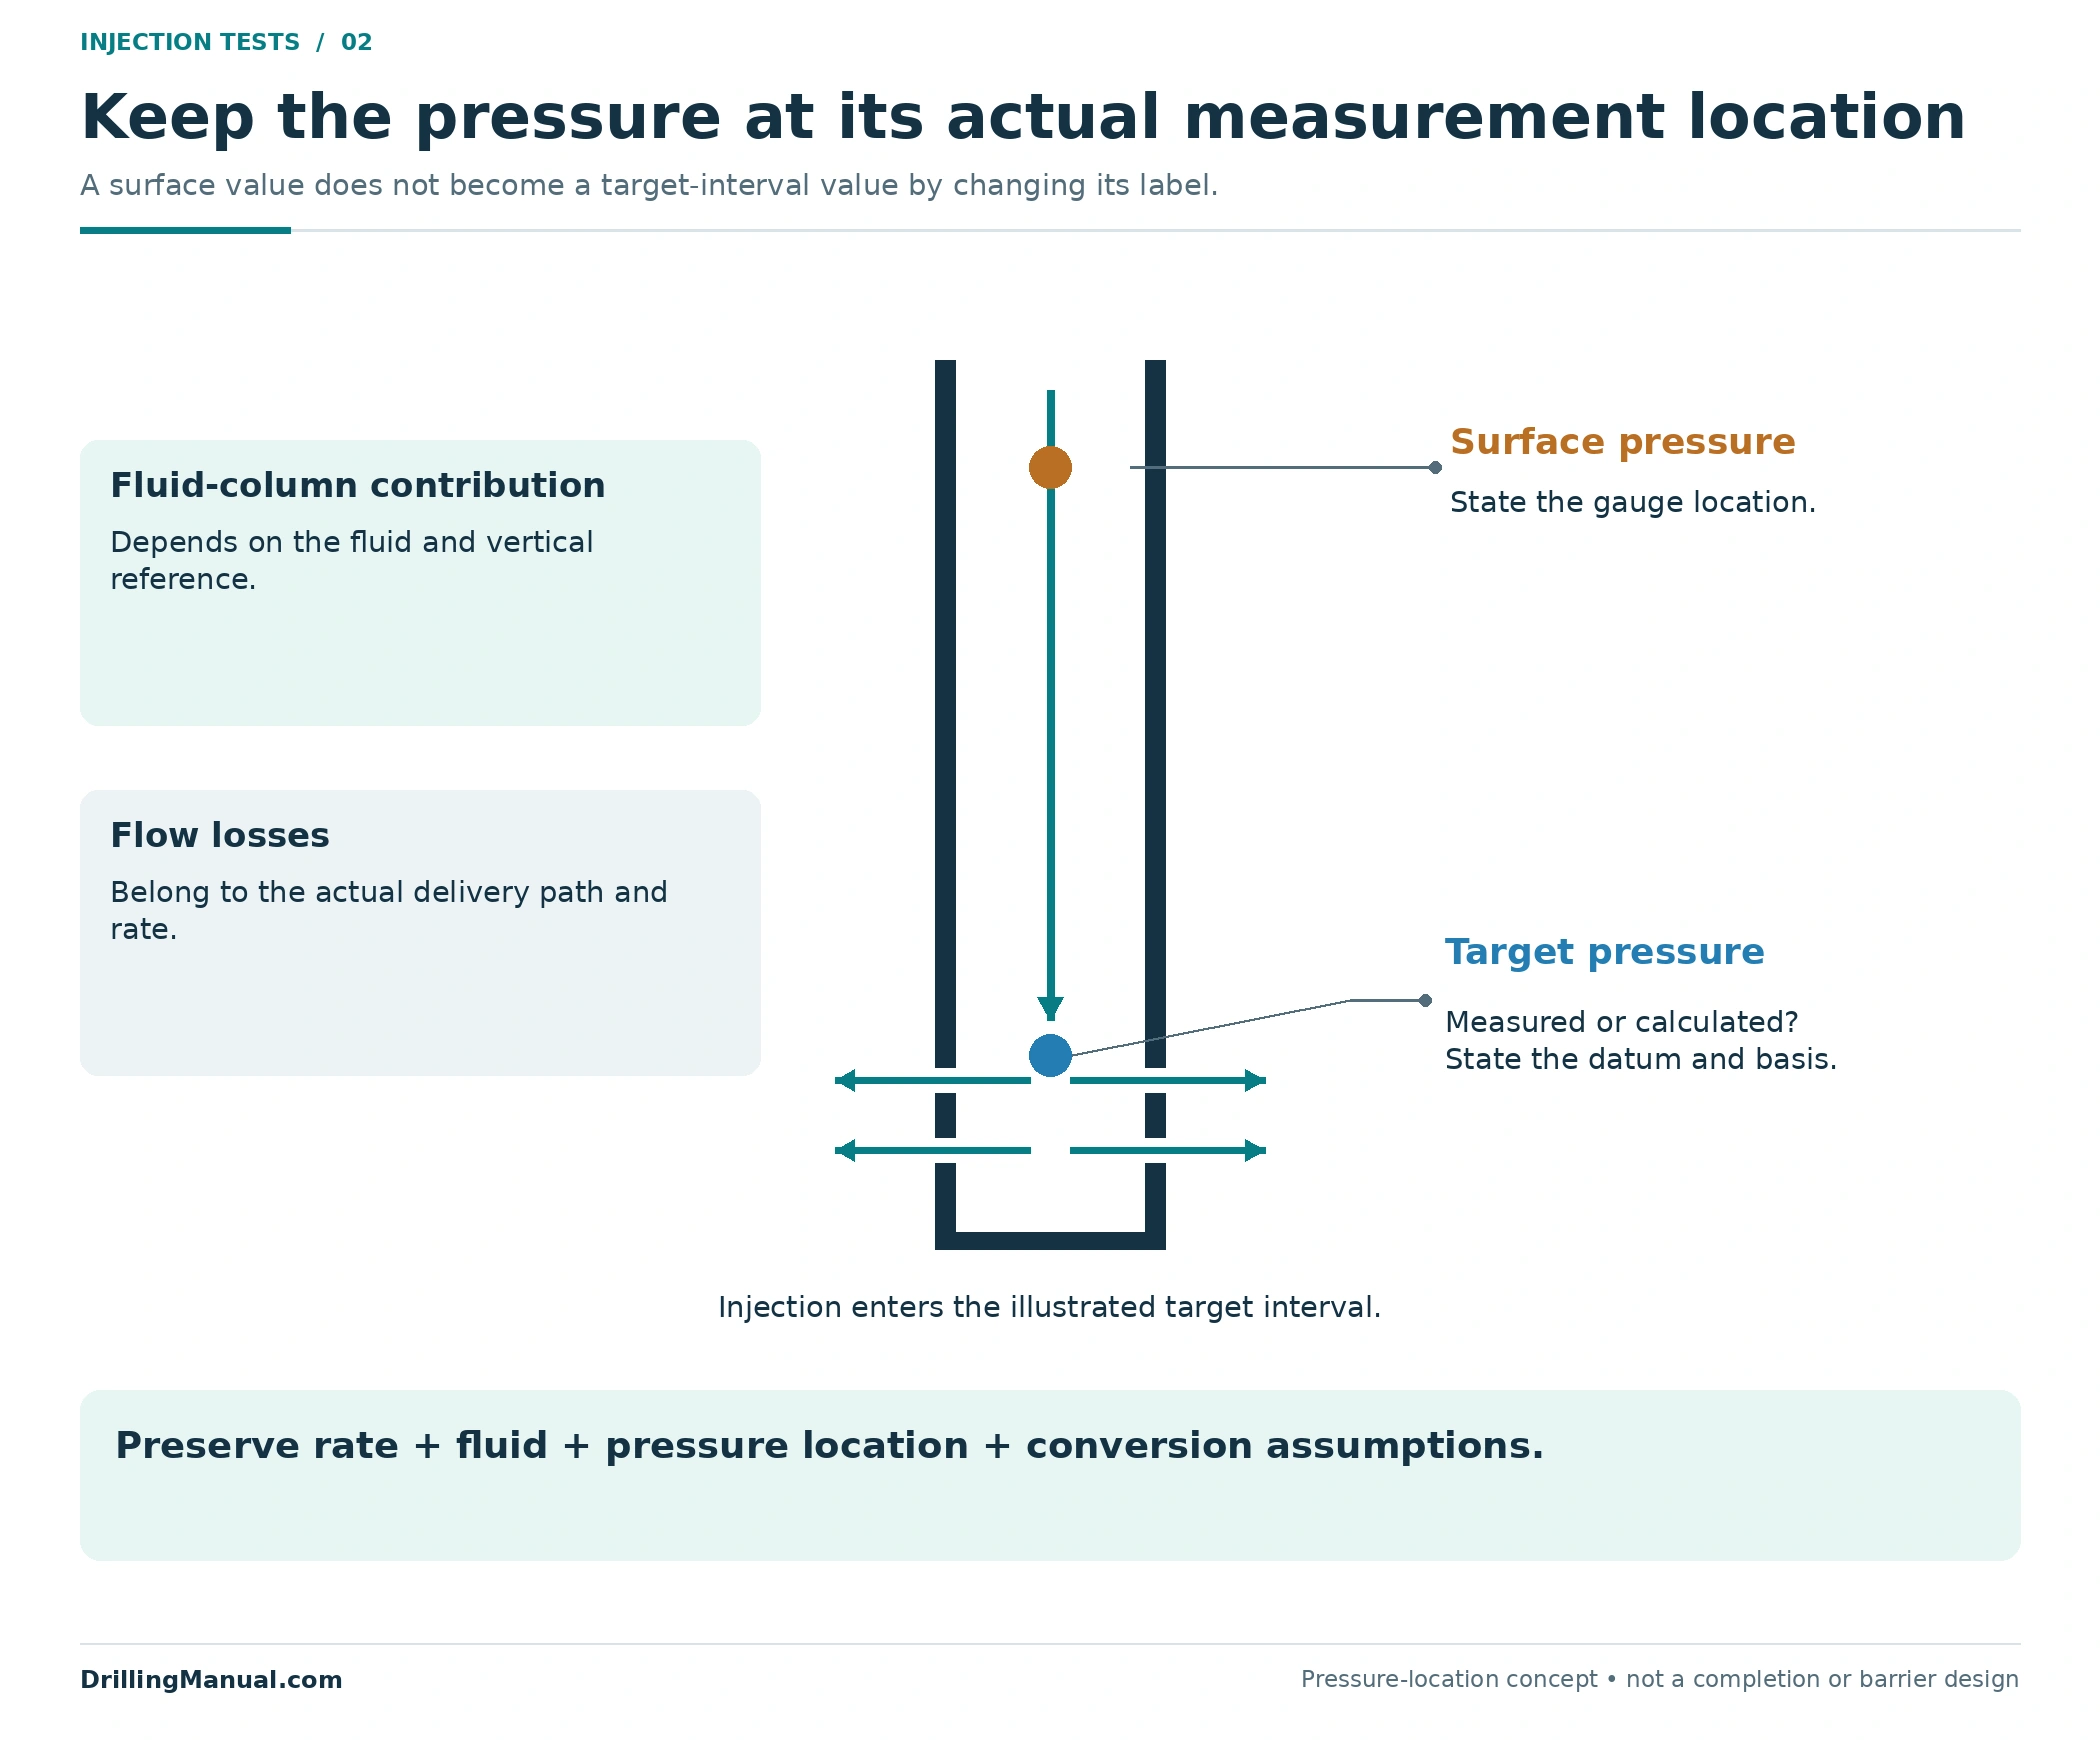
The pressure axis needs a location as well as a unit. Surface pumping pressure and pressure at the target interval are different quantities. The NOV CTES manual separates the fluid-column contribution from frictional losses along the flow path and calls for a hydraulic model linking pump conditions with conditions at the target depth. [2, PDF pp. 265–266, 334]
Consequently, a step rate test comparison should not silently substitute a surface reading for a downhole value. If the surface-to-target relationship changes, part of the apparent trend may belong to the delivery path rather than the formation. A calculated downhole value also needs its calculation basis preserved; changing a number’s label does not turn it into a downhole measurement.
| Record field | What to make explicit | Interpretation risk |
|---|---|---|
| Pressure location | Surface measurement, downhole measurement or calculated target pressure. | Comparing different physical nodes as though they were the same. |
| Pressure reference | Datum, units and gauge or absolute basis. | Combining numbers with unlike references. |
| Hydraulic basis | Fluid properties and the modeled flow path when a conversion is used. | Attributing a changed delivery loss to the formation. |
| Rate and pressure pairing | The associated rate, time and method used to select the reported pressure. | Constructing a point from measurements that describe different conditions. |
These are interpretation checks, not an alternative pressure calculation procedure. The NOV monitoring discussion records injection rate, bottomhole pressure and surface pressure together. That separation is valuable because a pressure trend becomes easier to explain when the associated rate and measurement location remain visible. [2, printed p. 11-43]

Compare Injection Capacity at the Same Conditions
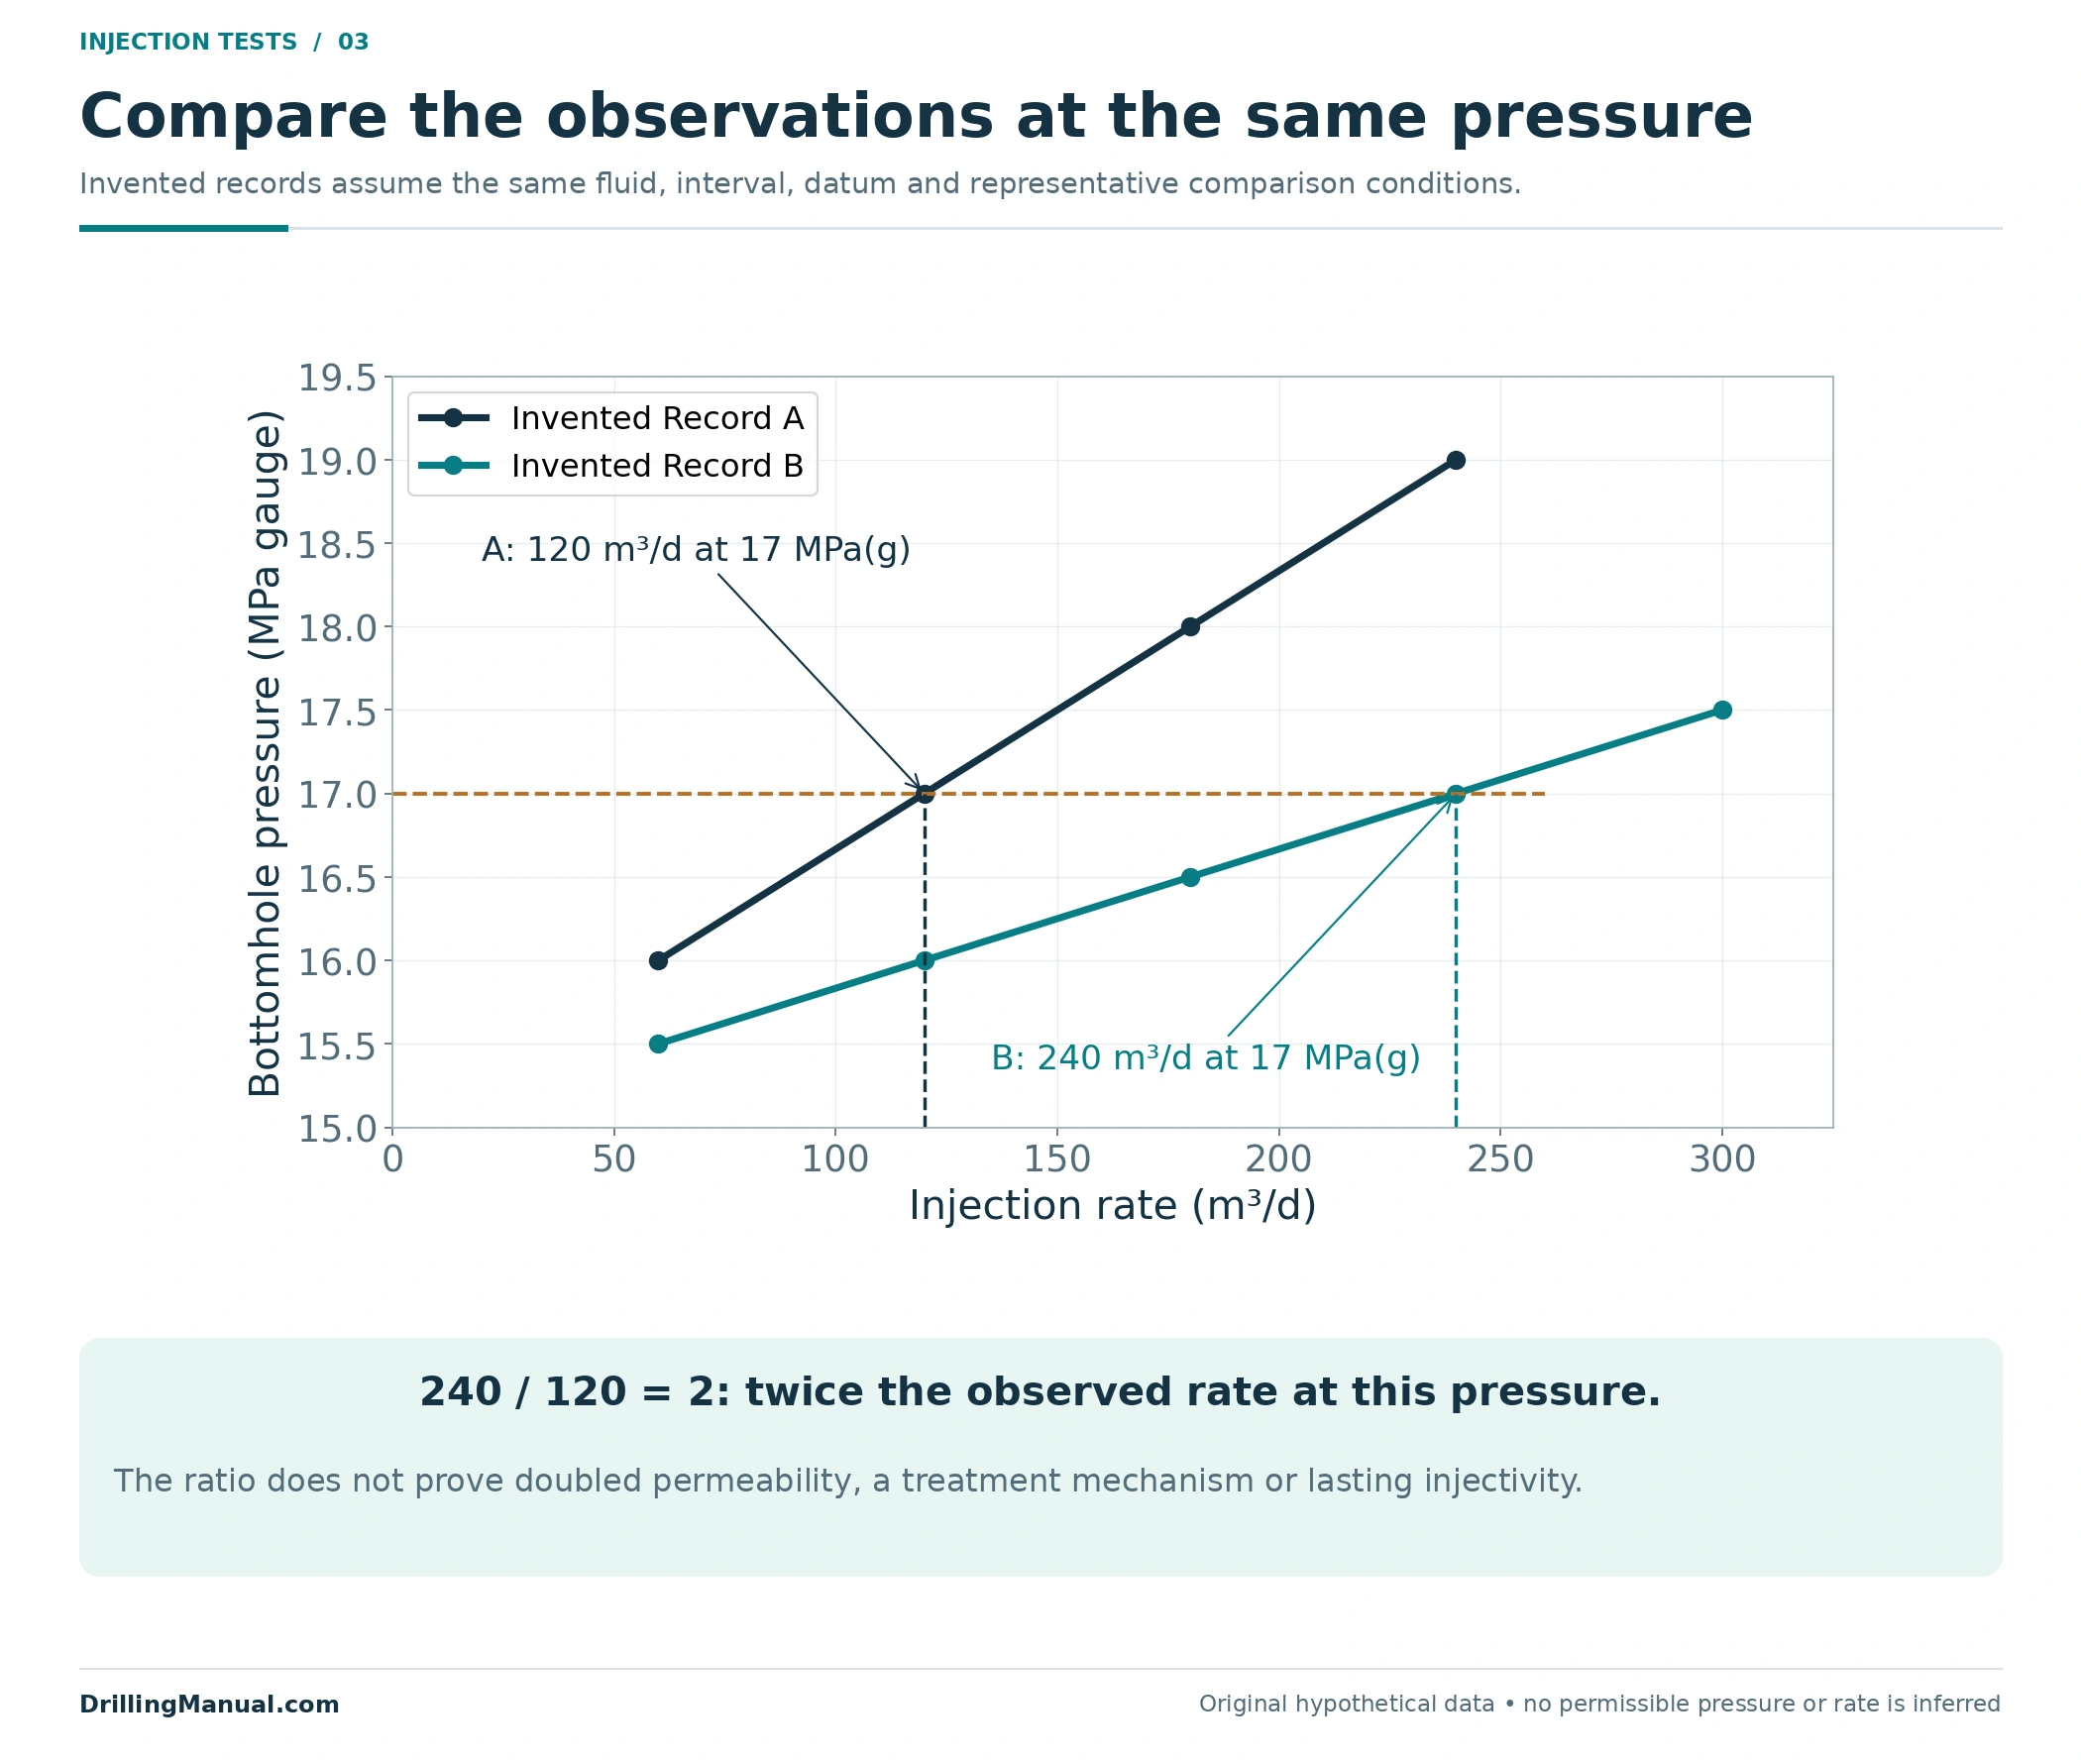
Consider two invented injection records with the same stated fluid, interval, pressure datum and comparison basis. At a bottomhole pressure of 17 MPa gauge, Record A contains a rate of 120 m³/d and Record B contains 240 m³/d. Both are assumed to be representative observations at that pressure, rather than extrapolations beyond the acquired data.
| Hypothetical record | Bottomhole pressure | Observed injection rate | Direct comparison |
|---|---|---|---|
| A | 17 MPa gauge | 120 m³/d | Reference observation. |
| B | 17 MPa gauge | 240 m³/d | Twice the recorded rate at the same pressure basis. |
The arithmetic is 240/120 = 2. It supports a larger observed injection capacity under the stated comparable conditions. It does not establish that permeability doubled, that a particular restriction was removed, or that the resulting rate can be maintained indefinitely. Those explanations require more than the two selected points.
The comparison would become weaker if Record A described one fluid and Record B another, or if one pressure were measured at surface and the other at the formation. The numerical ratio would still equal two, but it would no longer isolate the same question. This is why the caption’s assumptions are part of the example rather than decoration: they define what has been held comparable and what the arithmetic actually compares.
The same invented records also allow a matched-rate comparison. At 120 m³/d, Record A shows 17 MPa gauge and Record B shows 16 MPa gauge. That is 1 MPa less pressure at the same recorded rate. It is another way to describe the specified observations, rather than a second independent proof of their cause. Both readings remain local to the displayed data. Neither the rate ratio nor the pressure difference defines an allowable operating condition or a guaranteed response outside the example.
Figure 3 includes other invented observations to show where the matched-pressure comparison sits within each record. Connecting those points makes the example readable; it does not authorize extending the lines outside the illustrated range. The step rate test question is different: it asks what the changing response within a rate sequence supports about the injection regime. [1, pp. 785–786]
Reading the Classical Step Rate Test Plot
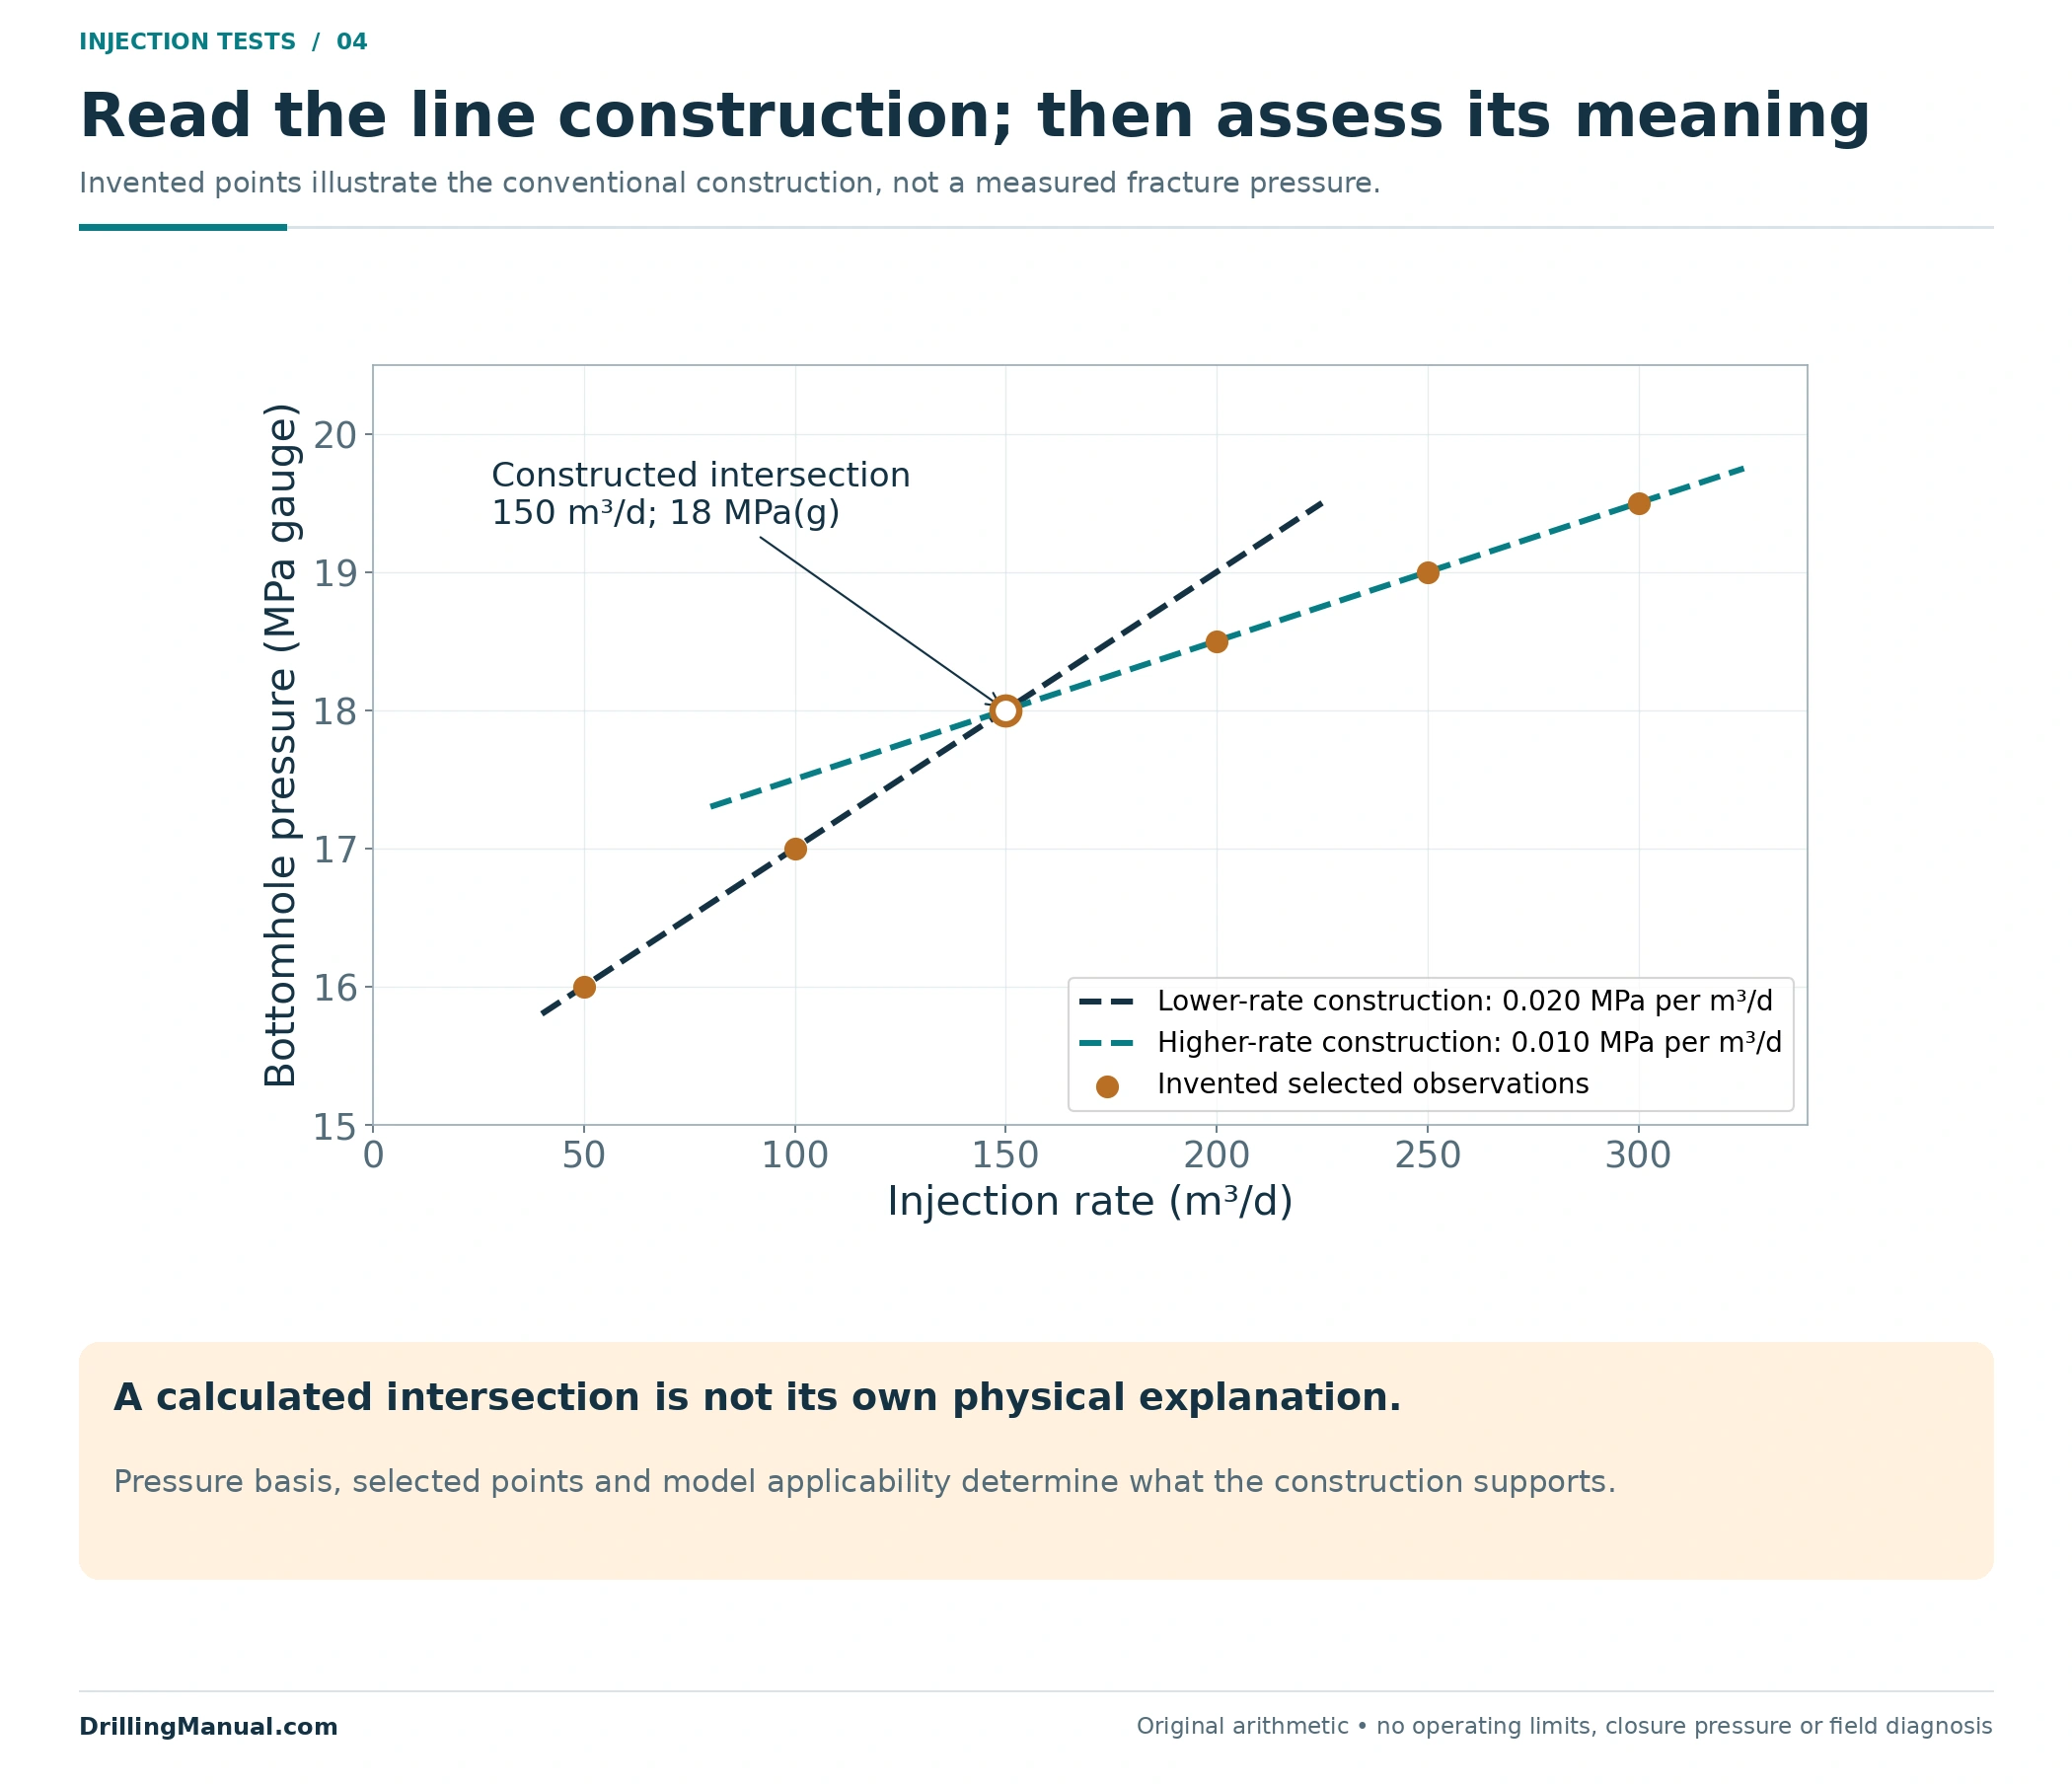
The conventional construction places injection rate on the horizontal axis and the selected pressure on the vertical axis. A lower-rate trend and a higher-rate trend are represented by straight lines. Their intersection is interpreted as the transition associated with fracture extension. The book describes this construction using bottomhole pressure as the preferred pressure quantity. [1, pp. 785–786]
In the original example in Figure 4, the invented lower-rate points follow a pressure increase of 1 MPa for each additional 50 m³/d. The later points increase by 0.5 MPa for the same rate increment. The constructed lines meet at 150 m³/d and 18 MPa gauge. Those values describe the drawing; they are not a measured formation limit.
The two constructed slopes are 0.020 and 0.010 MPa per m³/d. Their units describe pressure change divided by rate change; they are not simply pressures. If the rate unit changes, the numerical slope changes with it. For a step rate test review, carry the units through the calculation and keep the axis convention visible before comparing slopes from different reports. The arithmetic here demonstrates a construction, not a universal diagnostic ratio.
Reading the plot correctly therefore has two parts. First, identify the plotted change and check the arithmetic, axes and point selection. Then assess whether the chosen interpretation is justified. A precise intersection calculated from unsuitable data remains an unsuitable interpretation. More decimal places do not compensate for an incorrect pressure basis or an unsupported straight-line assumption.
A Step Rate Test Slope Change Is an Interpretation
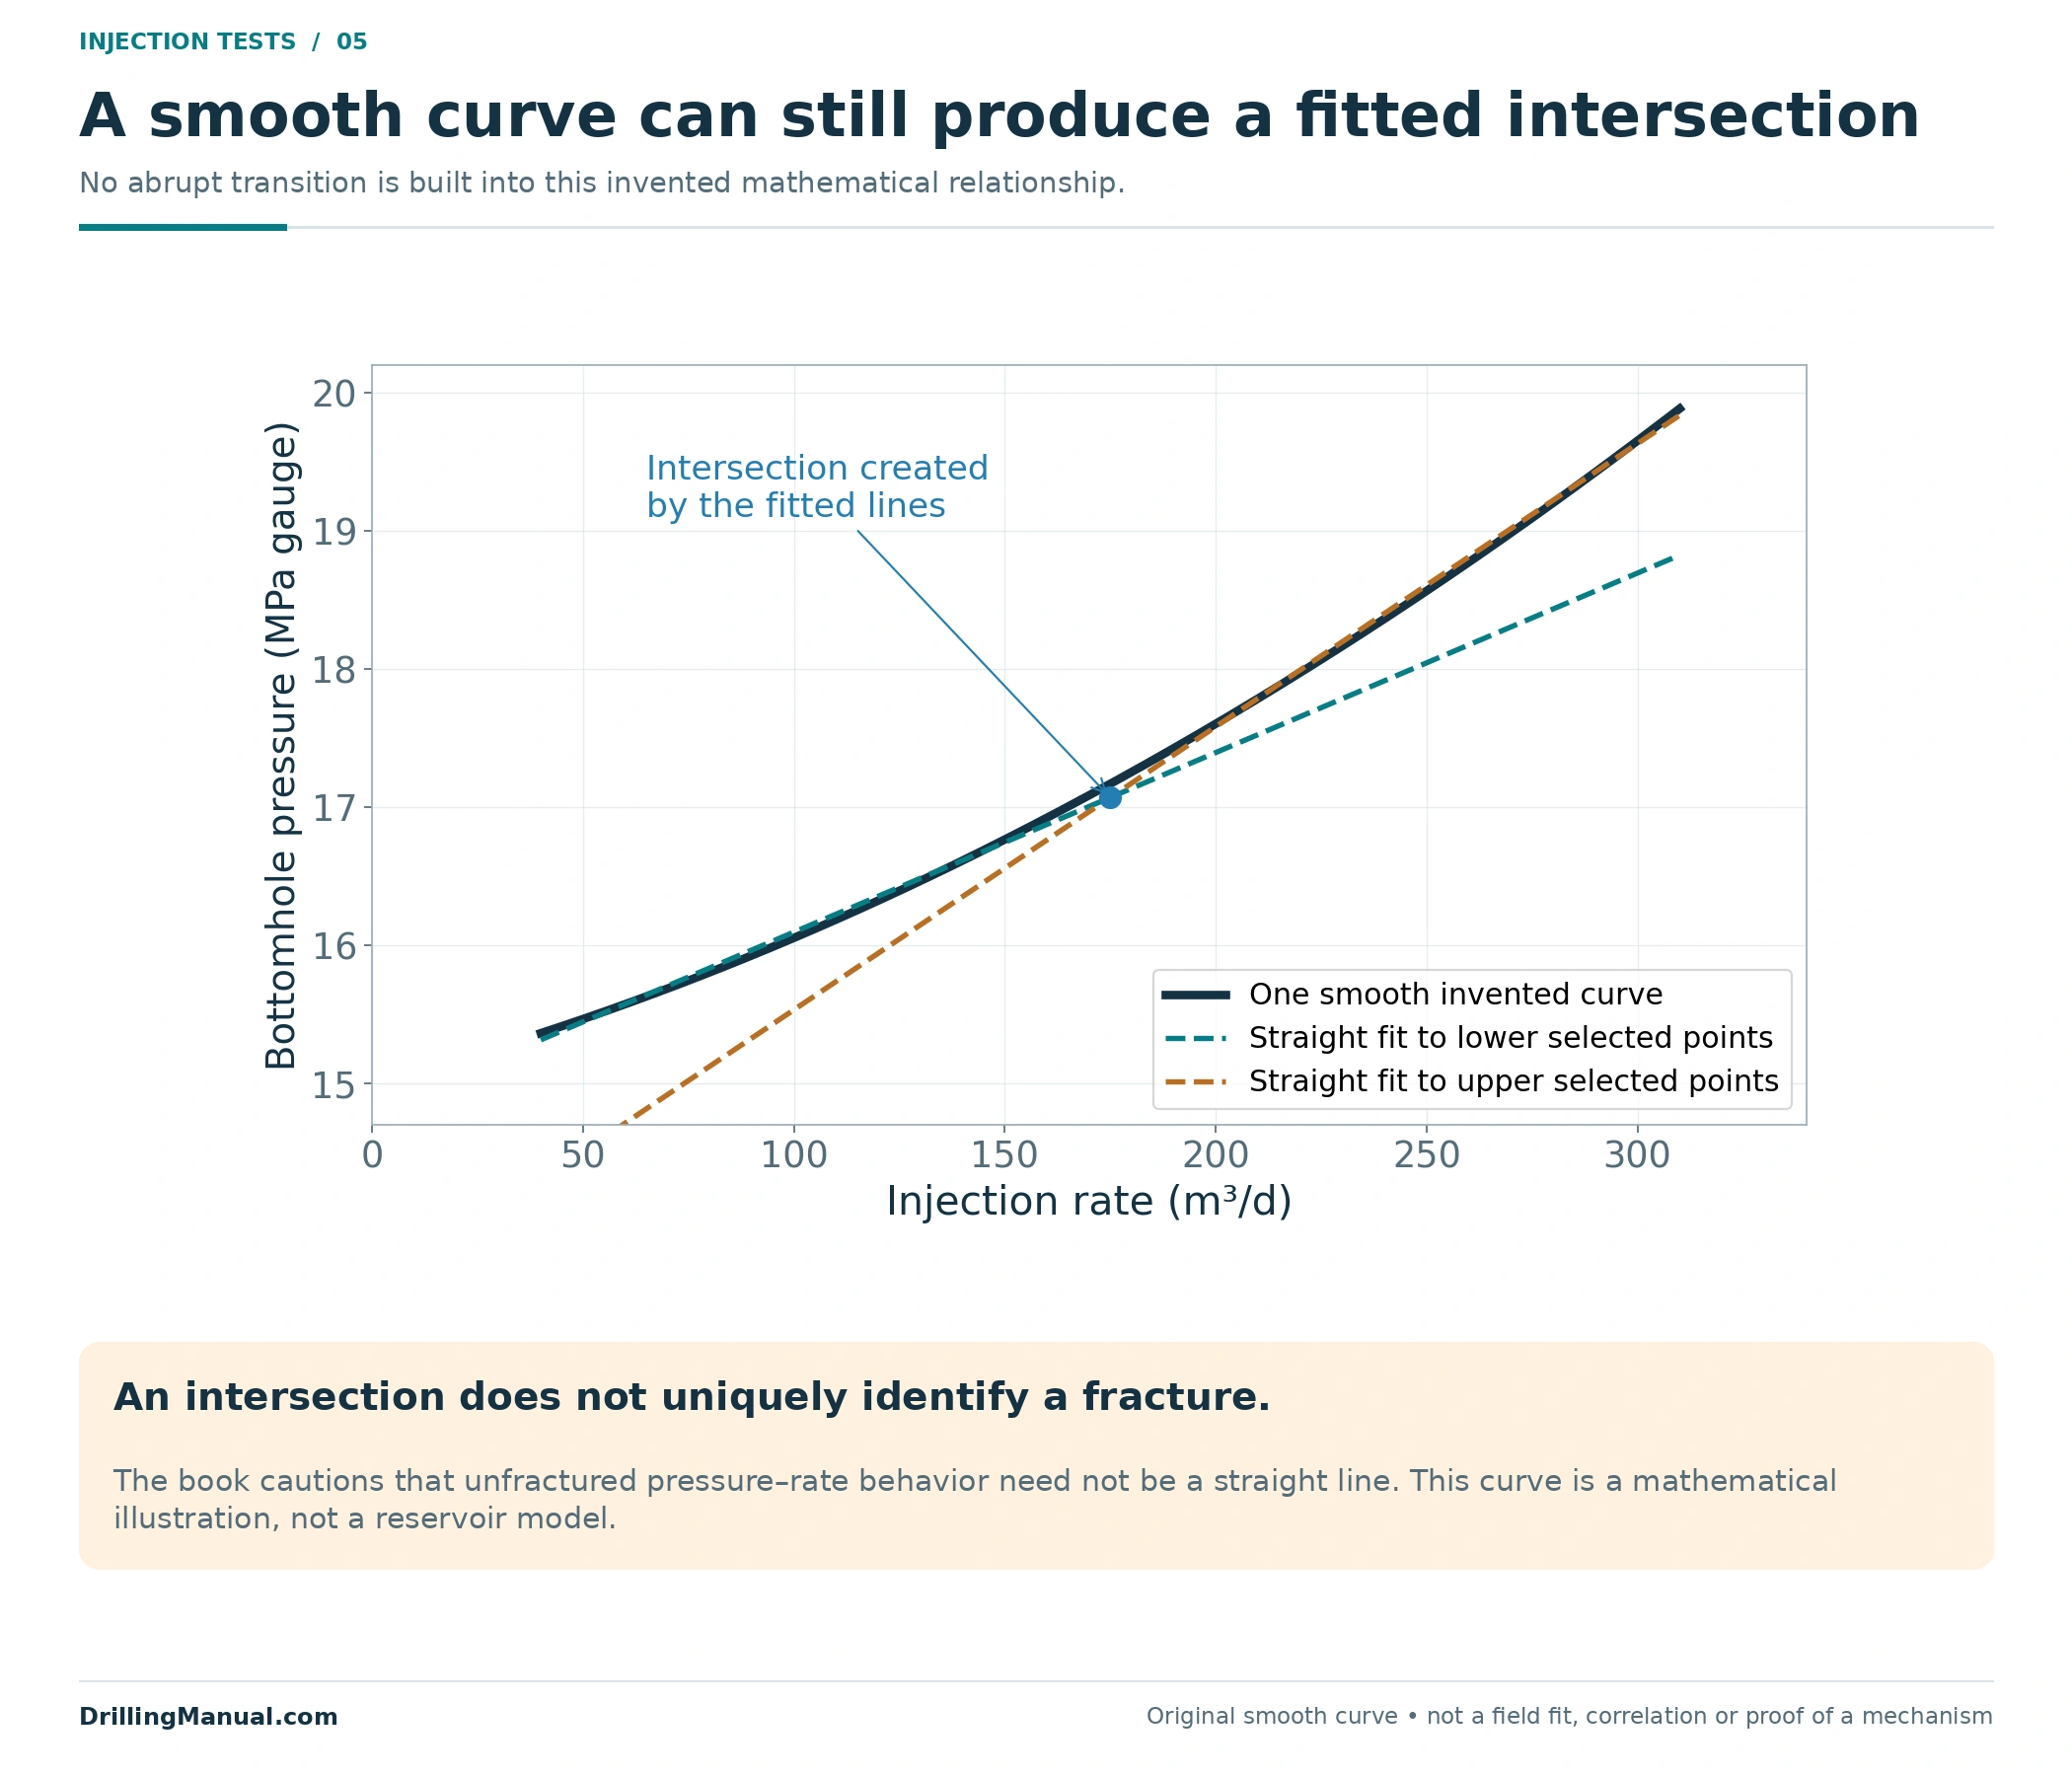
The most important qualification follows immediately after the conventional construction in the source. For an unfractured well, pressure plotted against injection rate need not form a straight line. The book explains that pressure-transient treatment of the data can produce upward curvature even without fracturing. A departure from two assumed straight lines is therefore not a self-sufficient fracture diagnosis. [1, p. 786]
Figure 5 illustrates the logical problem with an invented smooth curve. Different straight lines can be fitted to its lower and upper portions, even though no abrupt change was built into the mathematical example. The drawing is not a reservoir model. It demonstrates why constructing an intersection and establishing its physical meaning are separate tasks.
This does not make a step rate test useless. It sets the strength of the conclusion. The result can help an engineer assess treatment conditions, while the model, fluid, pressure reference and broader record determine how confidently a particular transition can be interpreted. The source itself discusses the usefulness and limitations of the conventional method together. [1, p. 786]
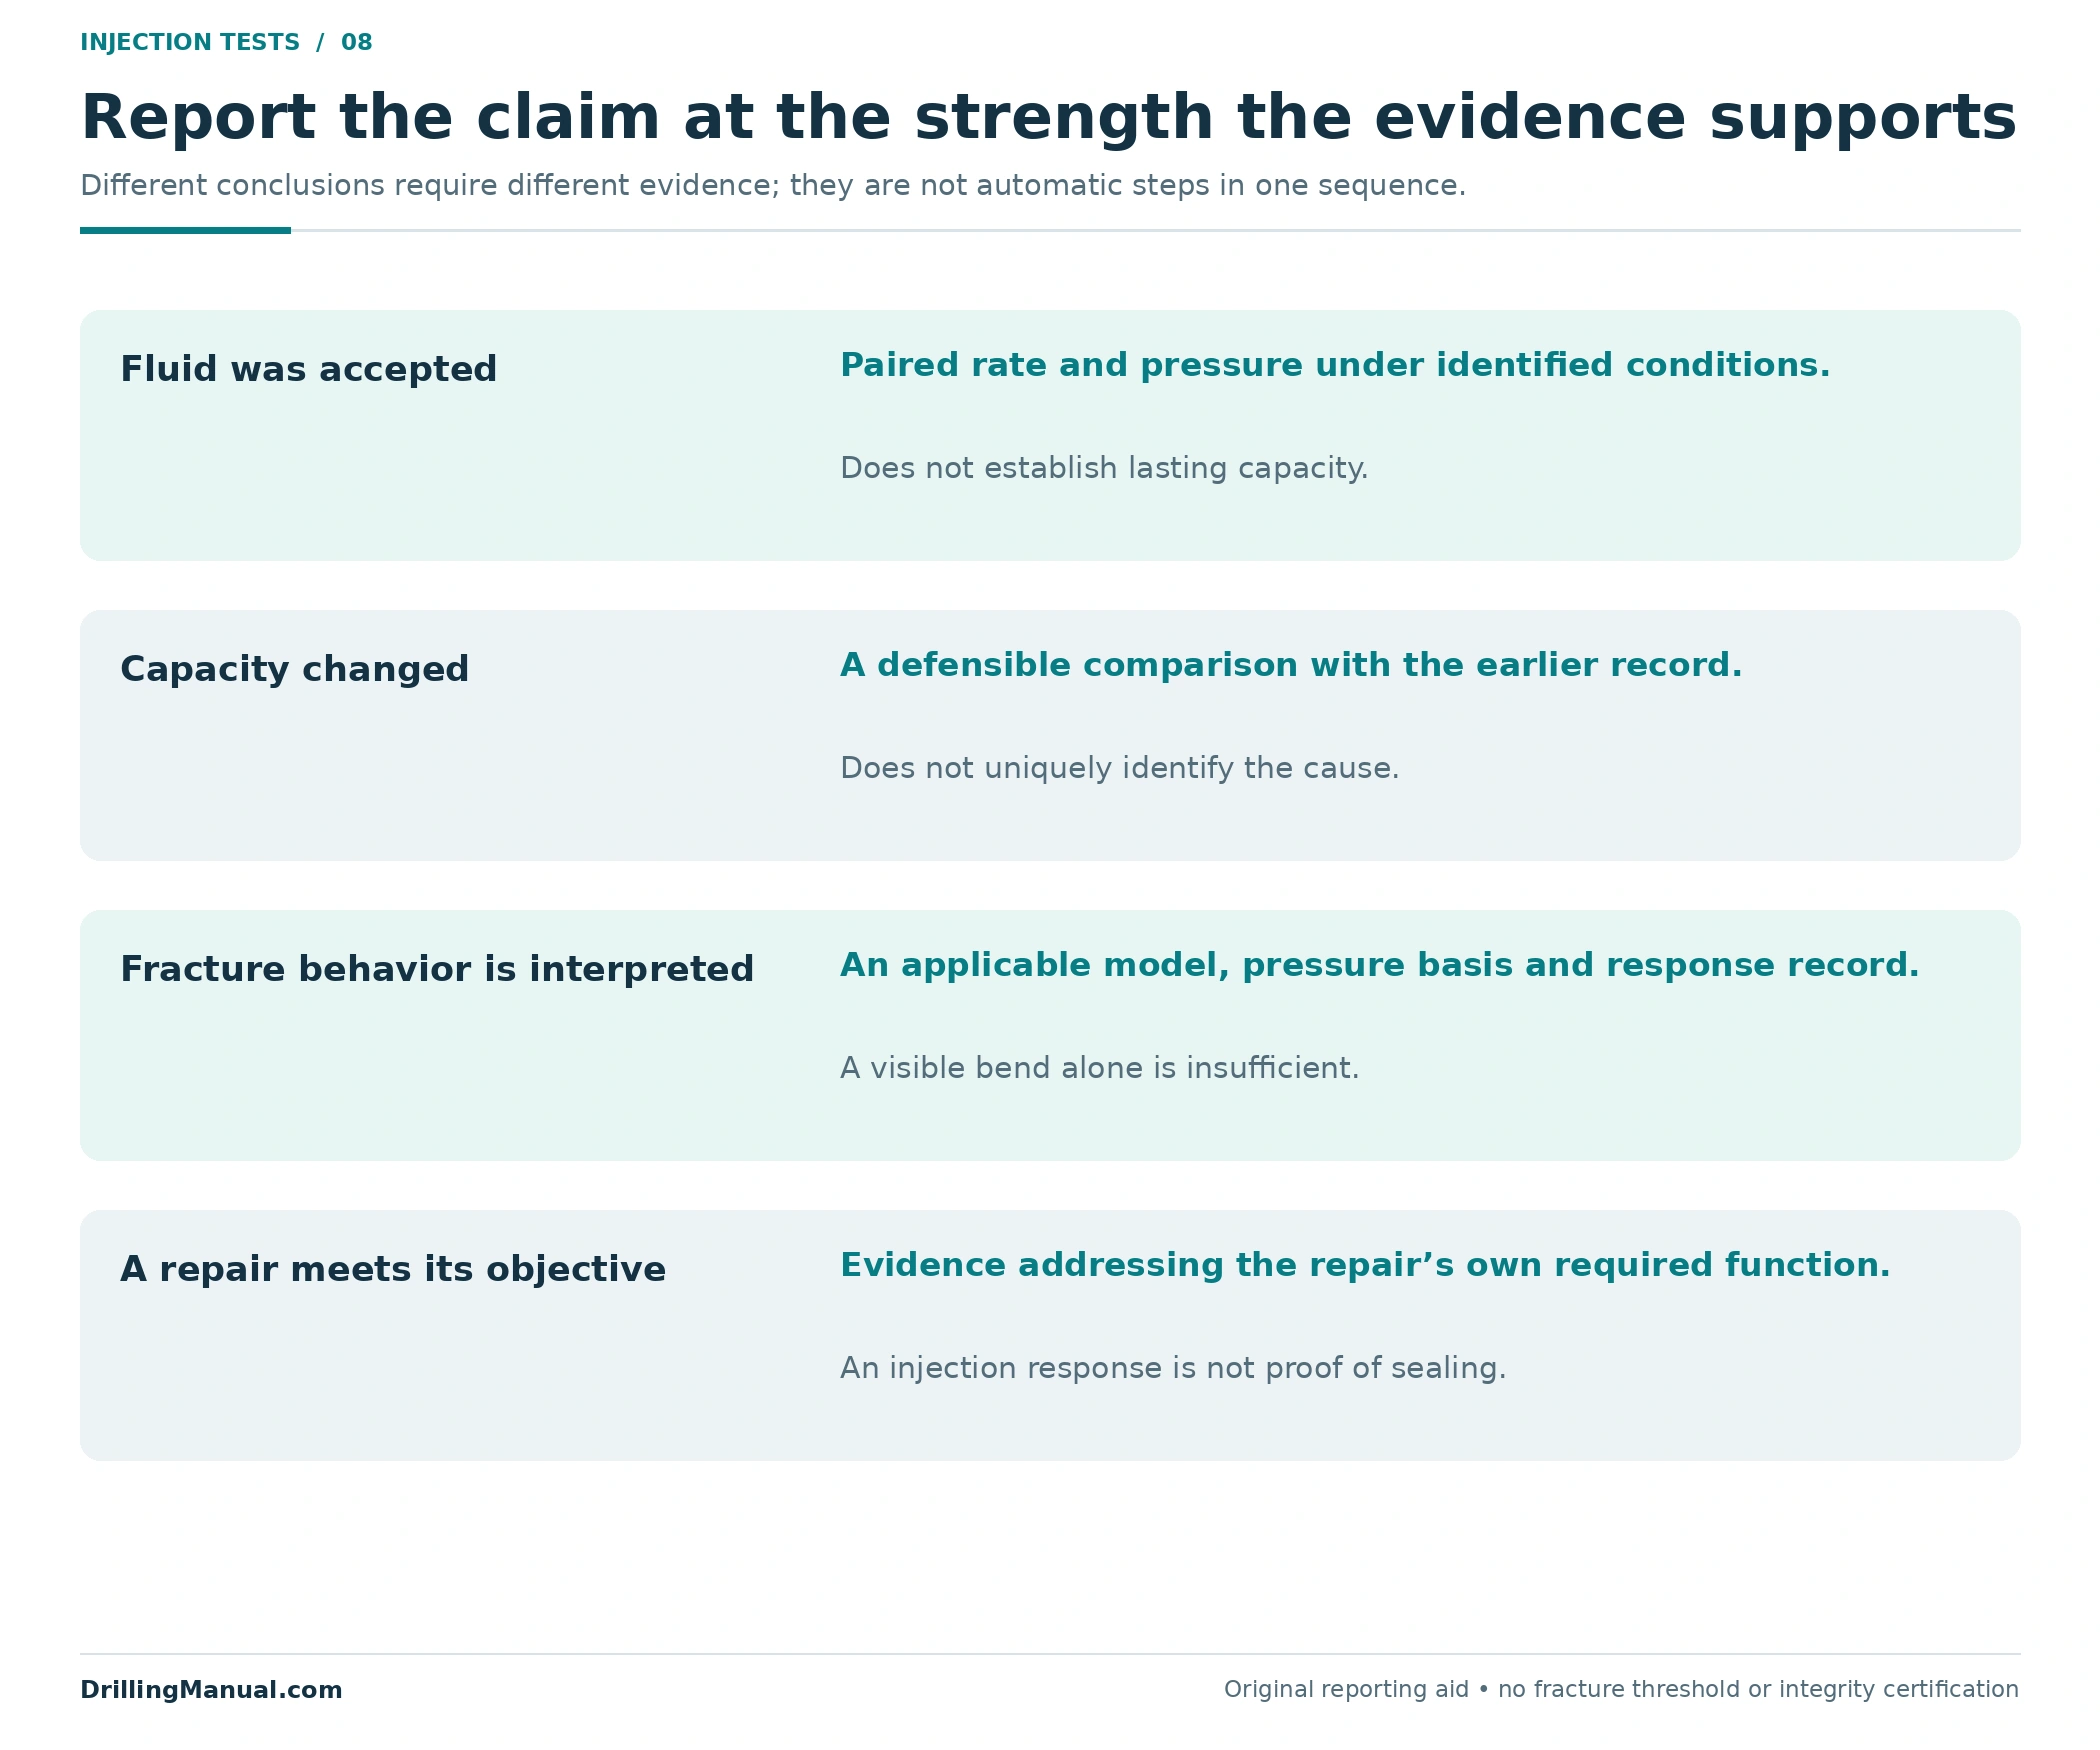
Use wording that preserves that distinction: “a change in the recorded pressure–rate trend was identified” is weaker than “fracture extension pressure was established.” The second statement needs the interpretation that connects the observed response to the claimed mechanism. Neither statement is automatically a fracture-closure-pressure measurement.
The source introduces closure pressure and extension or propagation pressure as different diagnostic targets. It later describes the conventional stepped-rate result as an upper limit useful in interpreting closure from pressure-falloff information. Those relationships do not justify renaming the line intersection as a measured closure pressure. Retain the parameter actually being interpreted and the evidence used to obtain it. [1, pp. 785–786]
Do Not Lose the Time and Fluid Record
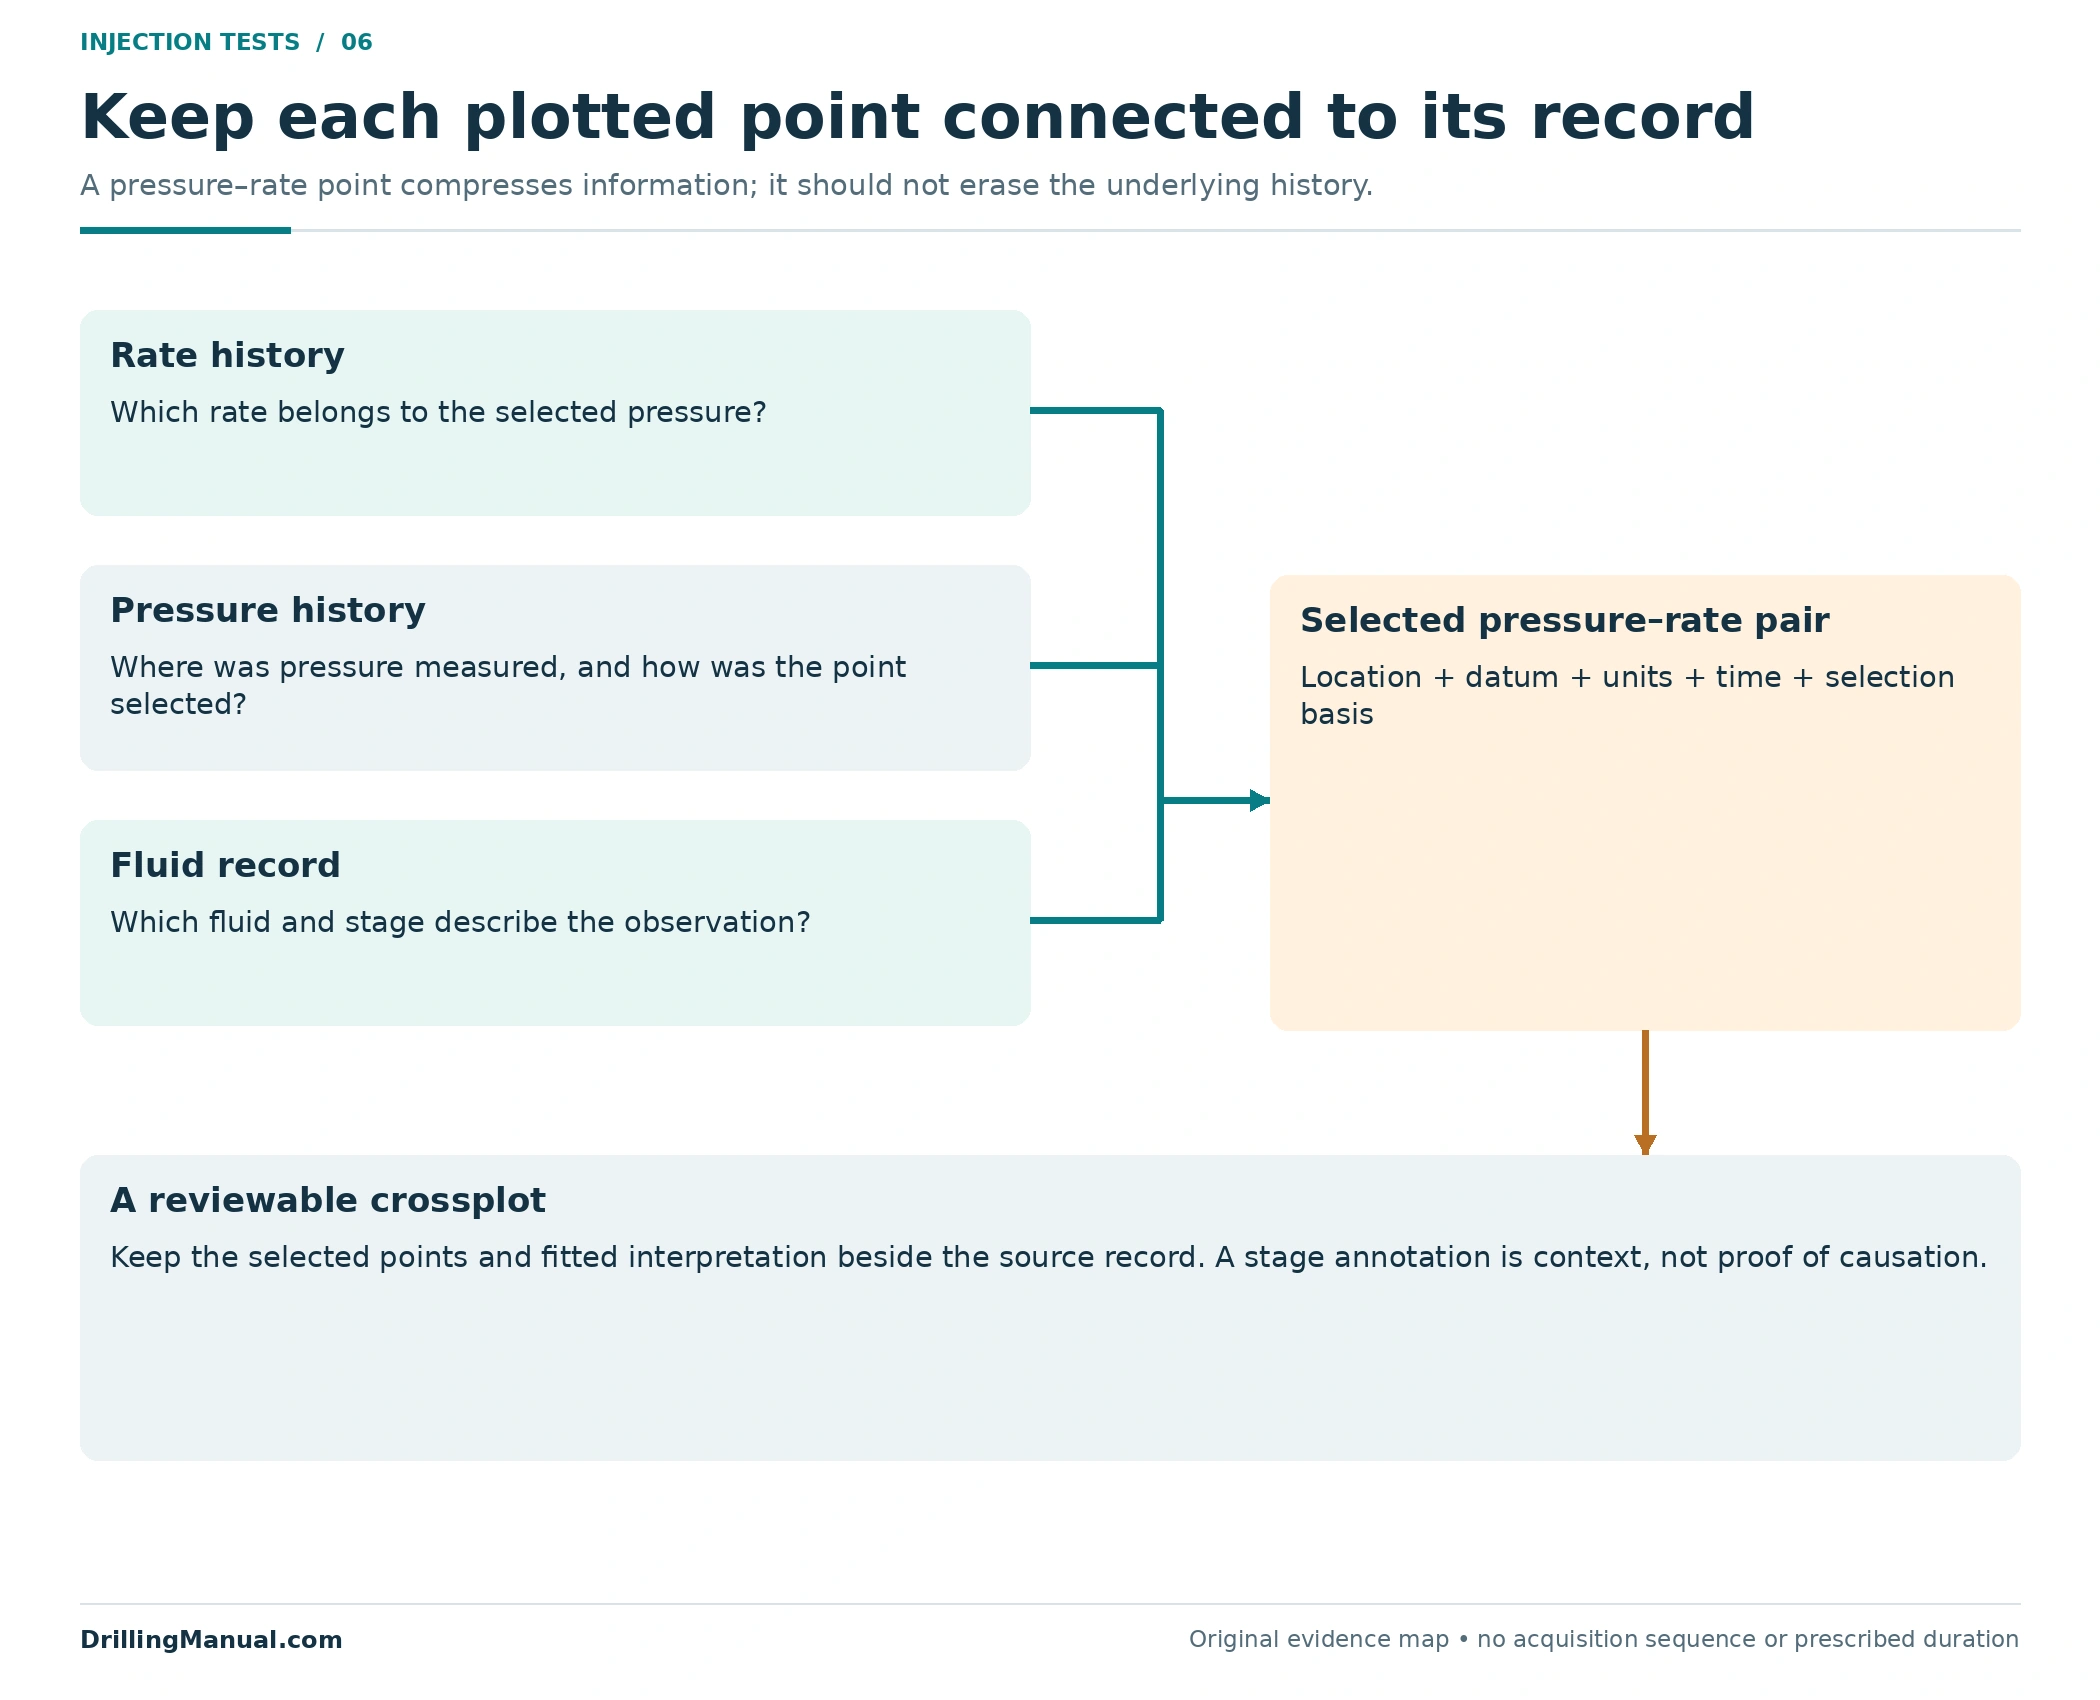
A pressure–rate crossplot compresses a time-dependent record into selected points. That is useful, but it can hide how each point was obtained. Preserve the rate and pressure histories, the selection method and the fluid information alongside the final plot. The book’s conventional construction explicitly refers to stabilized pressures, while its criticism depends on the transient character of the response. [1, pp. 785–786]
A step rate test point should therefore remain traceable to the corresponding part of the record. An analyst reviewing an unusual bend needs to know whether the same comparison basis was used throughout. A point label containing only a rate and pressure cannot answer questions about the preceding response or a change in fluid.
The NOV monitoring guidance includes injection pressure, bottomhole pressure, injection rate and fluid quality. Its planning discussion also distinguishes fluid stages rather than treating everything pumped as one interchangeable liquid. For this article, the useful lesson is to retain those distinctions when interpreting a response; the operational treatment sequence belongs to the well-specific design. [2, printed pp. 11-37, 11-43]
For example, an annotation saying that a reported point followed a fluid-stage change gives the reviewer information that the crossplot cannot display by itself. It does not prove that the fluid change caused the response. It identifies a condition that must be considered before comparing the point with its neighbors. Keep the observation, the associated change and the proposed explanation as separate parts of the record.

Keep Short-Term Response Separate from Future Injectivity
An injection response observed during a test is evidence about that test. It is not automatically a forecast of continuing performance. The historical ENI manual specifically cautions that short-term injection after a well has fractured may be a poor measure of longer-term injectivity. It also identifies cold-water effects as a complication in interpreting the subsequent pressure falloff. [3, p. 12]
This distinction prevents a successful initial pumping response from being reported as a demonstrated long-term result. State the fluid, conditions and period represented by the observations. If the intended decision concerns continuing injection, the interpretation has to address that future question rather than silently assuming that the initial response will persist.
Pressure falloff is a related observation made after injection stops, but it is not the same plot as pressure against successive injection rates. Keep its analysis and conclusions identifiable. Combining several types of evidence can strengthen the assessment; mixing their names or pressure definitions can make the report less clear. [3, p. 12]
Use a Step Rate Test Result in the Right Workover Decision
The injection response informs a decision about a defined target. It does not select a treatment on its own. A suspected impairment belongs with the diagnosis in the formation damage guide; the treatment objectives and placement considerations are covered separately in matrix acidizing and squeeze cementing.
A step rate test result also needs to remain separate from the intended intervention’s performance criteria. Acceptance of fluid does not prove that a repair seals, that every intended interval received treatment, or that the whole well satisfies its integrity requirements. Those are different claims from the measured injection response. The well integrity guide addresses the broader assessment.
Likewise, the drilling-stage formation integrity test and leak-off test have their own articles. Their programs are outside this existing-interval comparison. For fracture-treatment design rather than test interpretation, use the separate hydraulic fracturing guide.

Build an Injection-Test Review Record
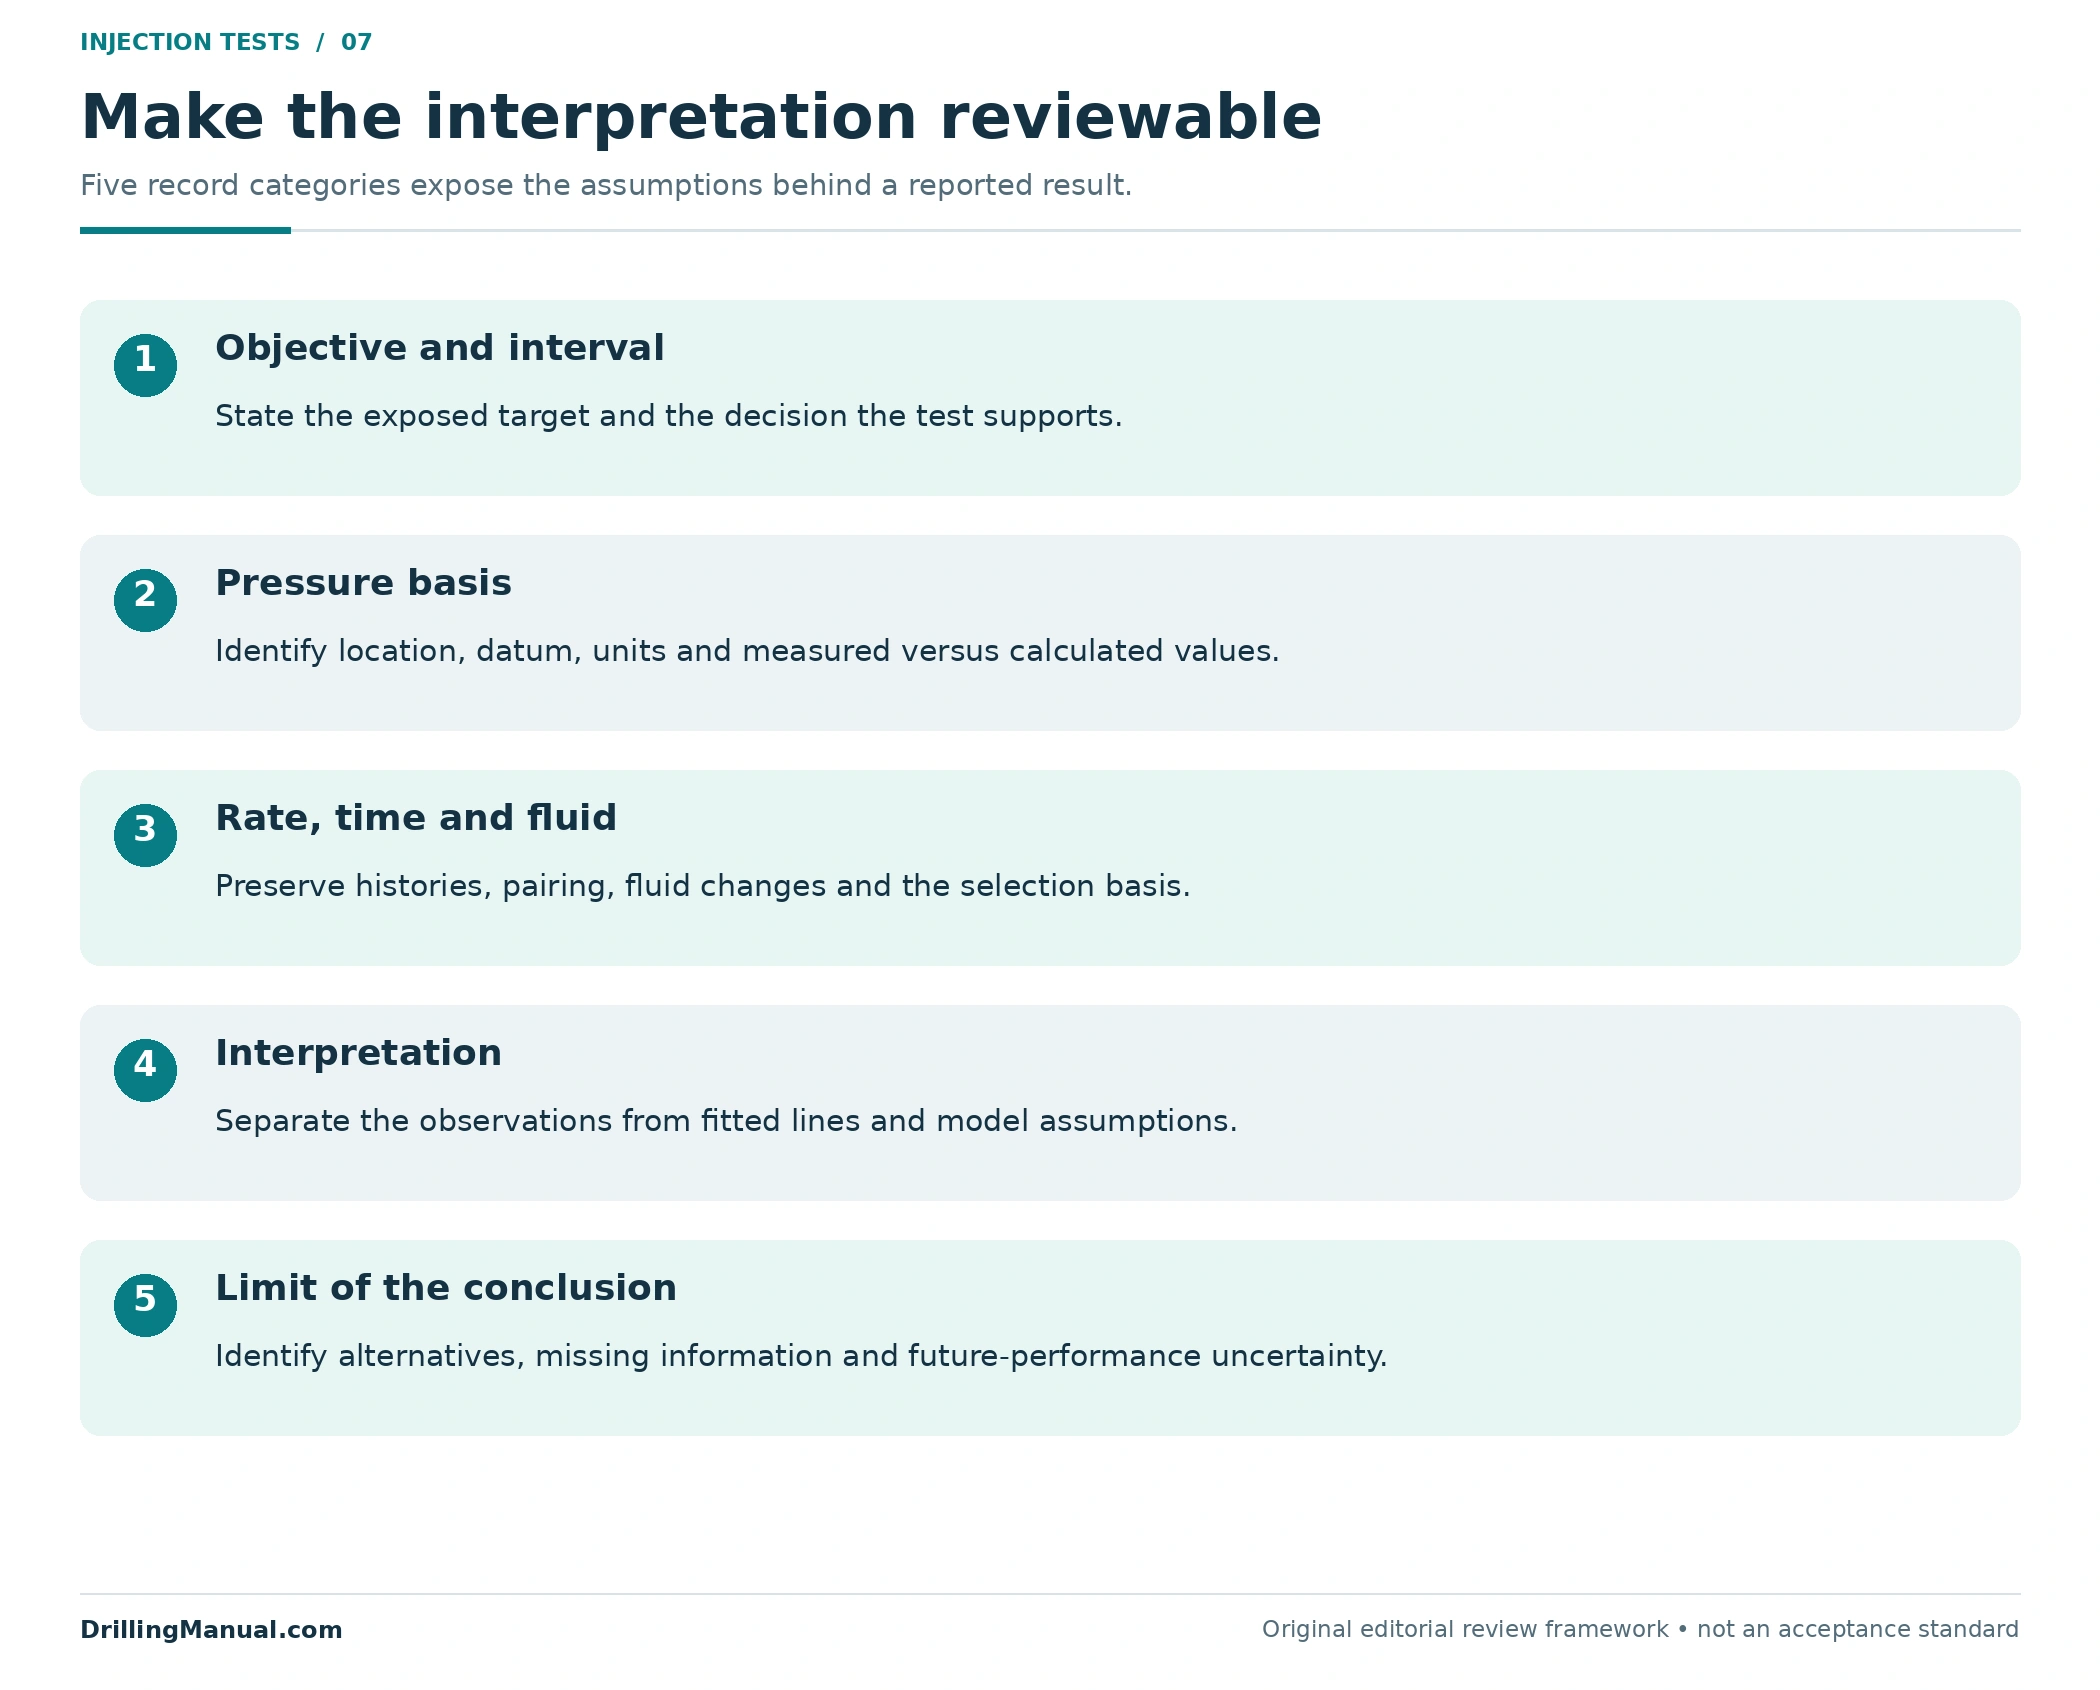
The following framework makes the interpretation reviewable. It is an editorial organization of the source distinctions, not a test procedure or acceptance standard. The review should let a second engineer recover the question and relevant observations, then identify the assumptions behind the conclusion.
| Record category | Information to retain | Question it resolves |
|---|---|---|
| Objective and interval | The exposed target and the decision being supported. | Are the observations relevant to the proposed work? |
| Pressure and rate | Locations, references, units, time histories and selected points. | Are the plotted quantities comparable and traceable? |
| Fluid and hydraulic context | Fluid stages, relevant properties and any conversion assumptions. | Could a changed delivery condition affect the comparison? |
| Interpretation and limits | The model, candidate transition, alternative explanations and uncertainty. | How strongly does the record support the claimed mechanism? |
When the record is incomplete, keep the observation and narrow the conclusion. Missing information should not be replaced by a visually attractive line fit. A documented injection response with a stated limitation is more useful than a fracture-pressure number whose pressure basis or derivation cannot be reconstructed.
The final step rate test report should also retain the selected points beside the fitted construction. That lets a reviewer distinguish measured information from the analyst’s representation of it. If a later interpretation changes the conversion or point selection, the original observations remain available for comparison instead of disappearing behind the revised result.
Questions About Injection-Well Tests
Is a step rate test a form of injectivity testing?
It can be. The ENI manual discusses a stepped-rate investigation within injectivity testing. The distinction is the question being answered: injection potential under stated conditions, or interpretation of the pressure–rate response associated with fracture behavior. Name the objective as well as the test. [3, p. 12]
Does every bend in a step rate test prove fracturing?
No. The source explicitly discusses curved pressure–rate behavior without fracturing. Check the pressure reference, point selection and applicable interpretation before assigning a physical meaning to an intersection or bend. [1, p. 786]
Can surface pressure replace bottomhole pressure?
Not by relabeling it. Relating the two requires the relevant hydraulic basis, including the fluid-column contribution and flow losses. Keep a measured downhole value distinct from a calculated one and preserve the calculation assumptions. [2, PDF pp. 265–266, 334]
What rates, durations and pressure limits should be used?
This interpretation guide supplies none. The source’s historical high-permeability-fracturing example is not a universal injection-well program. The applicable well-specific design must establish the acquisition method and limits needed for its objective. [1, p. 785]
Does higher injection capacity prove successful stimulation?
It supports a changed response only to the extent that the conditions are comparable. A specific treatment-mechanism claim needs the pressure, rate, fluid and intervention record that connects the result to the proposed explanation. [2, printed p. 11-43]
Does the initial test establish lasting injectivity?
No. A short test and continuing injection are different evaluation questions. The historical source specifically warns about extrapolating short-term behavior after fracturing and notes additional complications in pressure-falloff interpretation. [3, p. 12]
Book References
- Ronald E. Oligney, Peter Valkó, Michael J. Economides and Sanjay Vitthal, Chapter 16, “High-Permeability Fracturing,” in Petroleum Well Construction, edited by Michael J. Economides, Larry Watters and Shari Dunn-Norman; John Wiley & Sons, Halliburton educational version. Visible and physical PDF pp. 785–786 in the 903-page copy.
- NOV CTES, Coiled Tubing Manual, copyright 2007–2013; inspected revision 27 June 2014. Chapter 10, “The Fundamental Hydraulics Challenge,” physical PDF pp. 265–266, including printed p. 10-3; Chapter 11, “Stimulating a Formation (Acidizing),” printed pp. 11-37 and 11-43, physical PDF pp. 334 and 340.
- ENI S.p.A., Agip Division, Well Test Procedures Manual, STAP-P-1-M-7130, Revision 0, issued 28 June 1999. Section 2.10, “Injectivity,” printed and physical PDF p. 12. Used as a historical technical reference, not as a current operating program.