The well productivity index puts a production rate beside the pressure drawdown required to obtain it. That makes it useful after a workover: a higher rate may reflect better inflow, but it may also reflect a lower flowing bottomhole pressure with no change in inflow capability. The comparison needs both rate and pressure, measured or interpreted on a consistent basis. [3, p. 831] [1, pp. 582–587]
Two wells can show the same percentage rate increase for different reasons. The examples below isolate those reasons with invented liquid-well data. They are accounting demonstrations over an assumed linear inflow range, not field results, operating targets or proof that a particular treatment worked.
What Does the Well Productivity Index Measure?
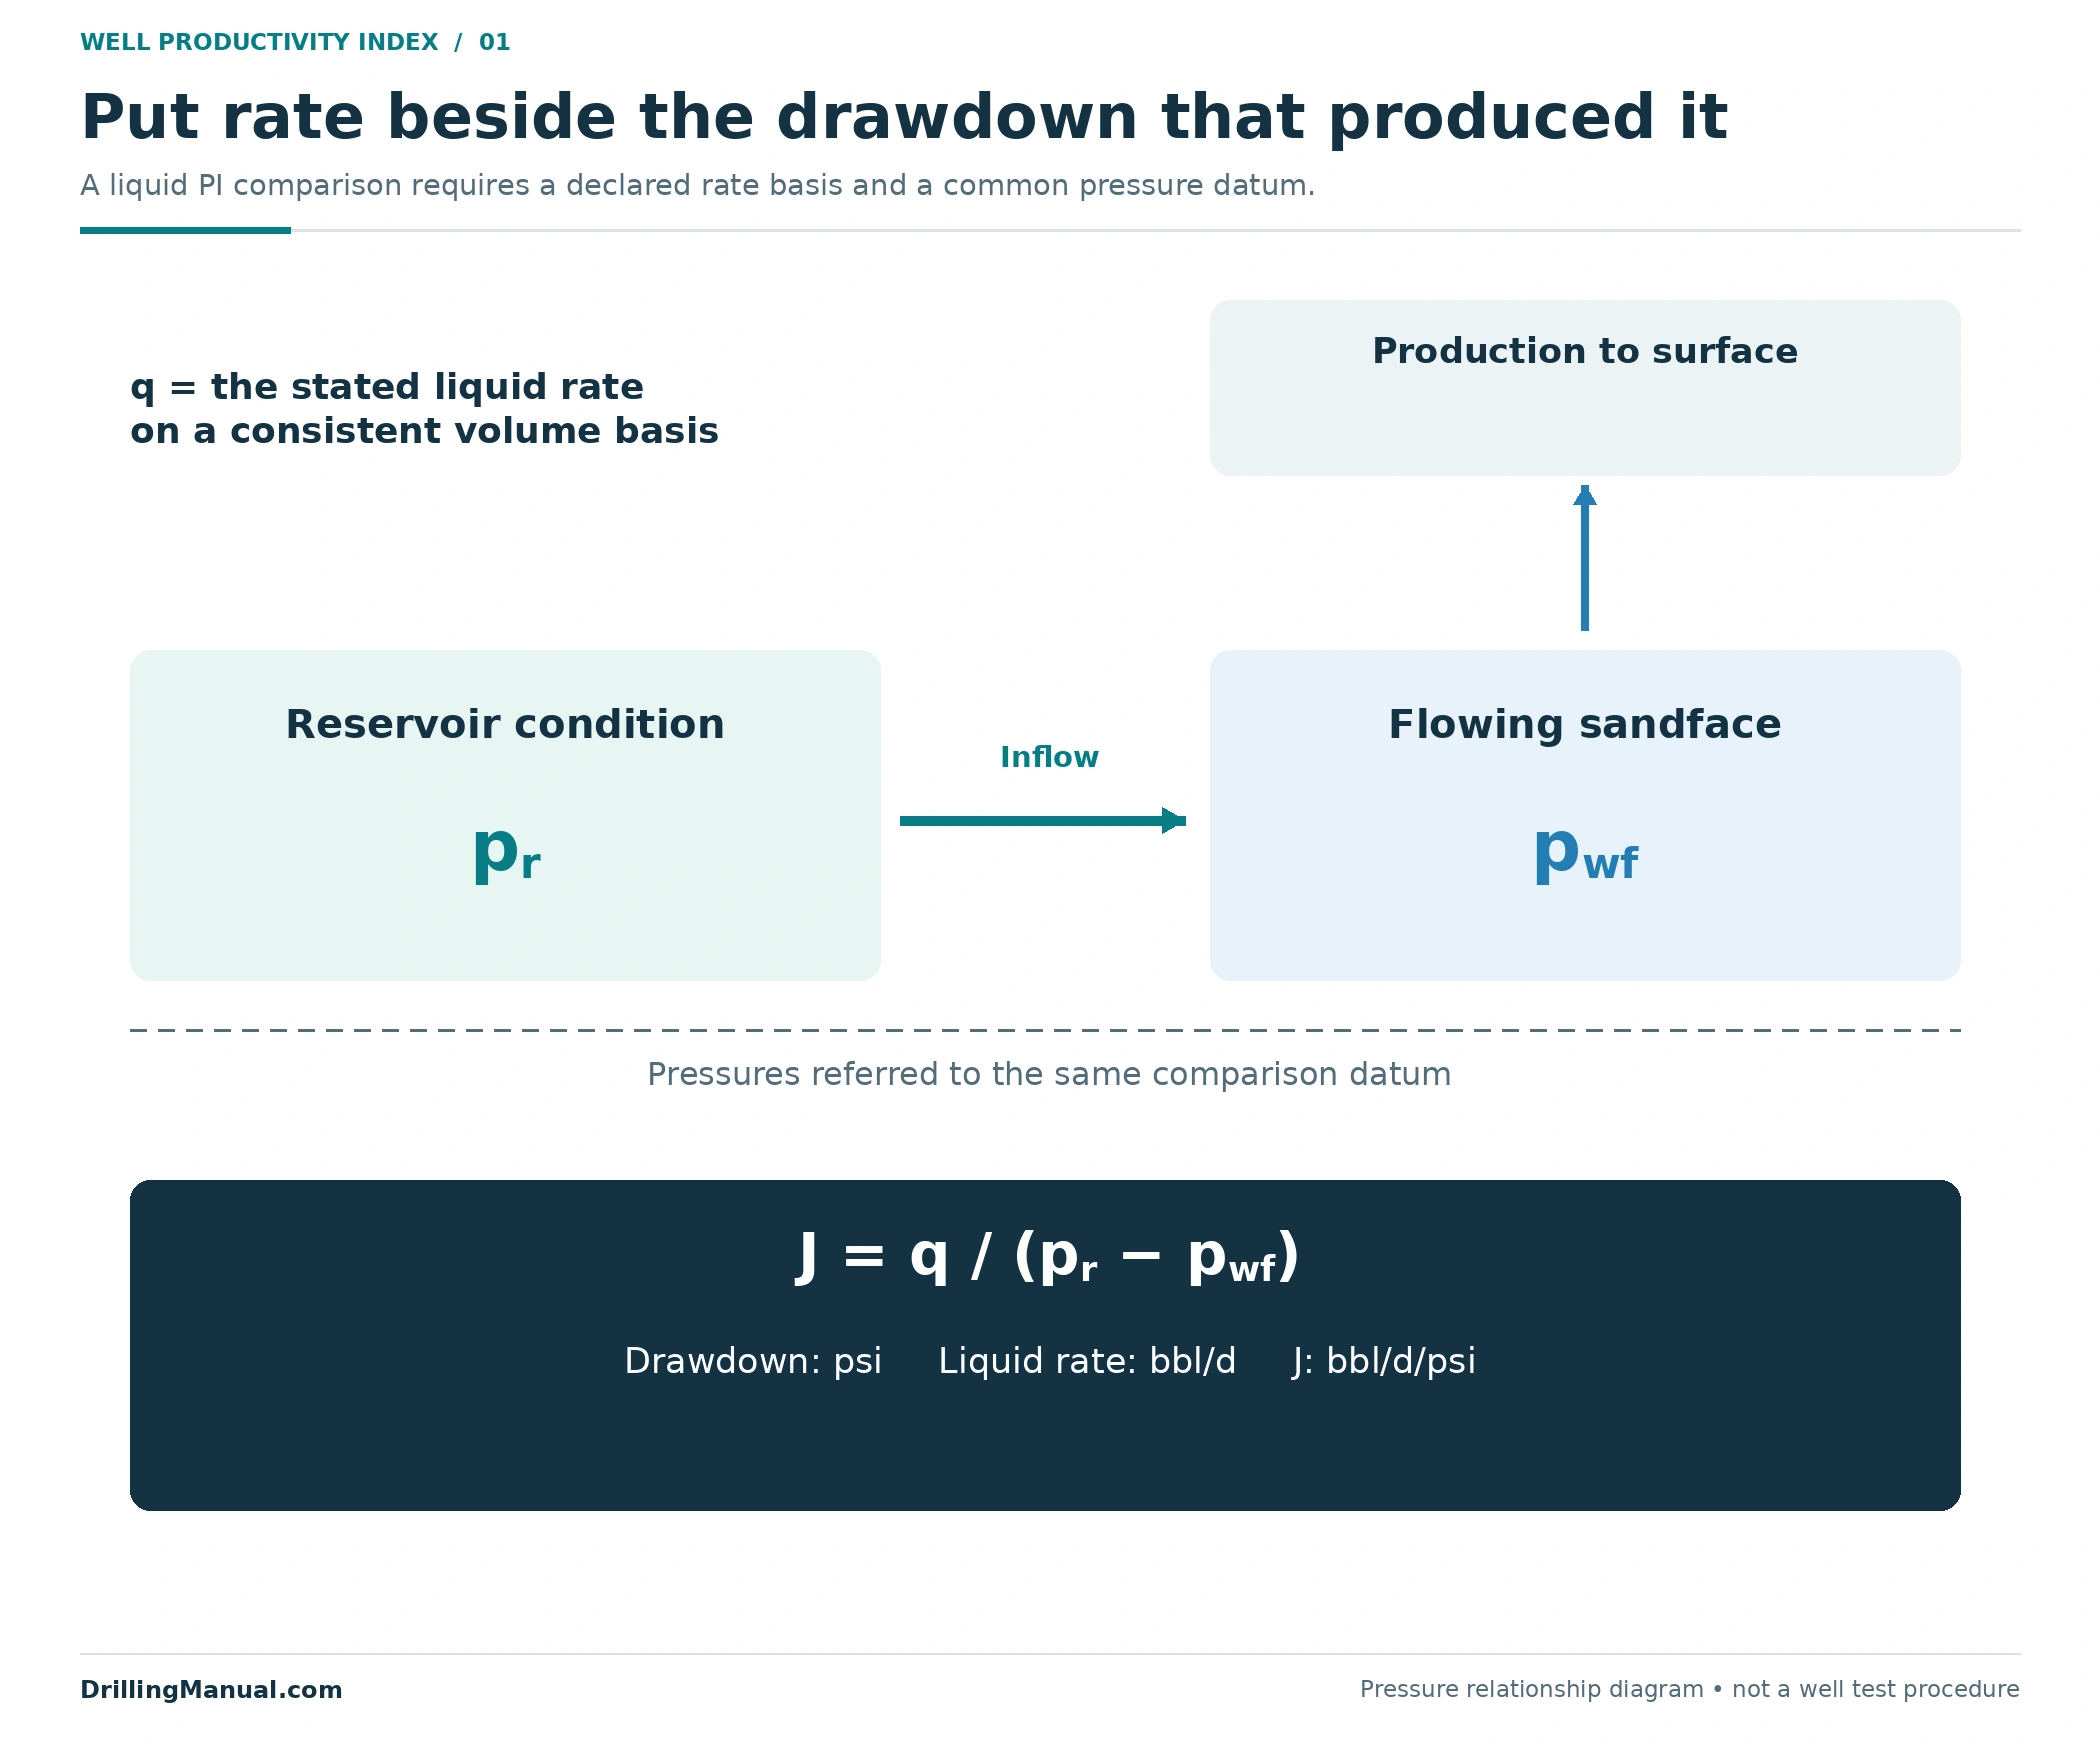
Petroleum Well Construction defines productivity index using liquid production divided by the associated reservoir-to-well pressure difference, referenced to the midpoint of the completed interval. With a consistent datum and an appropriate reservoir-pressure estimate, the familiar expression is J = q/(pr − pwf). Here, q is the stated liquid rate, pr is the relevant reservoir pressure and pwf is flowing bottomhole pressure at the comparison datum. [3, p. 831]
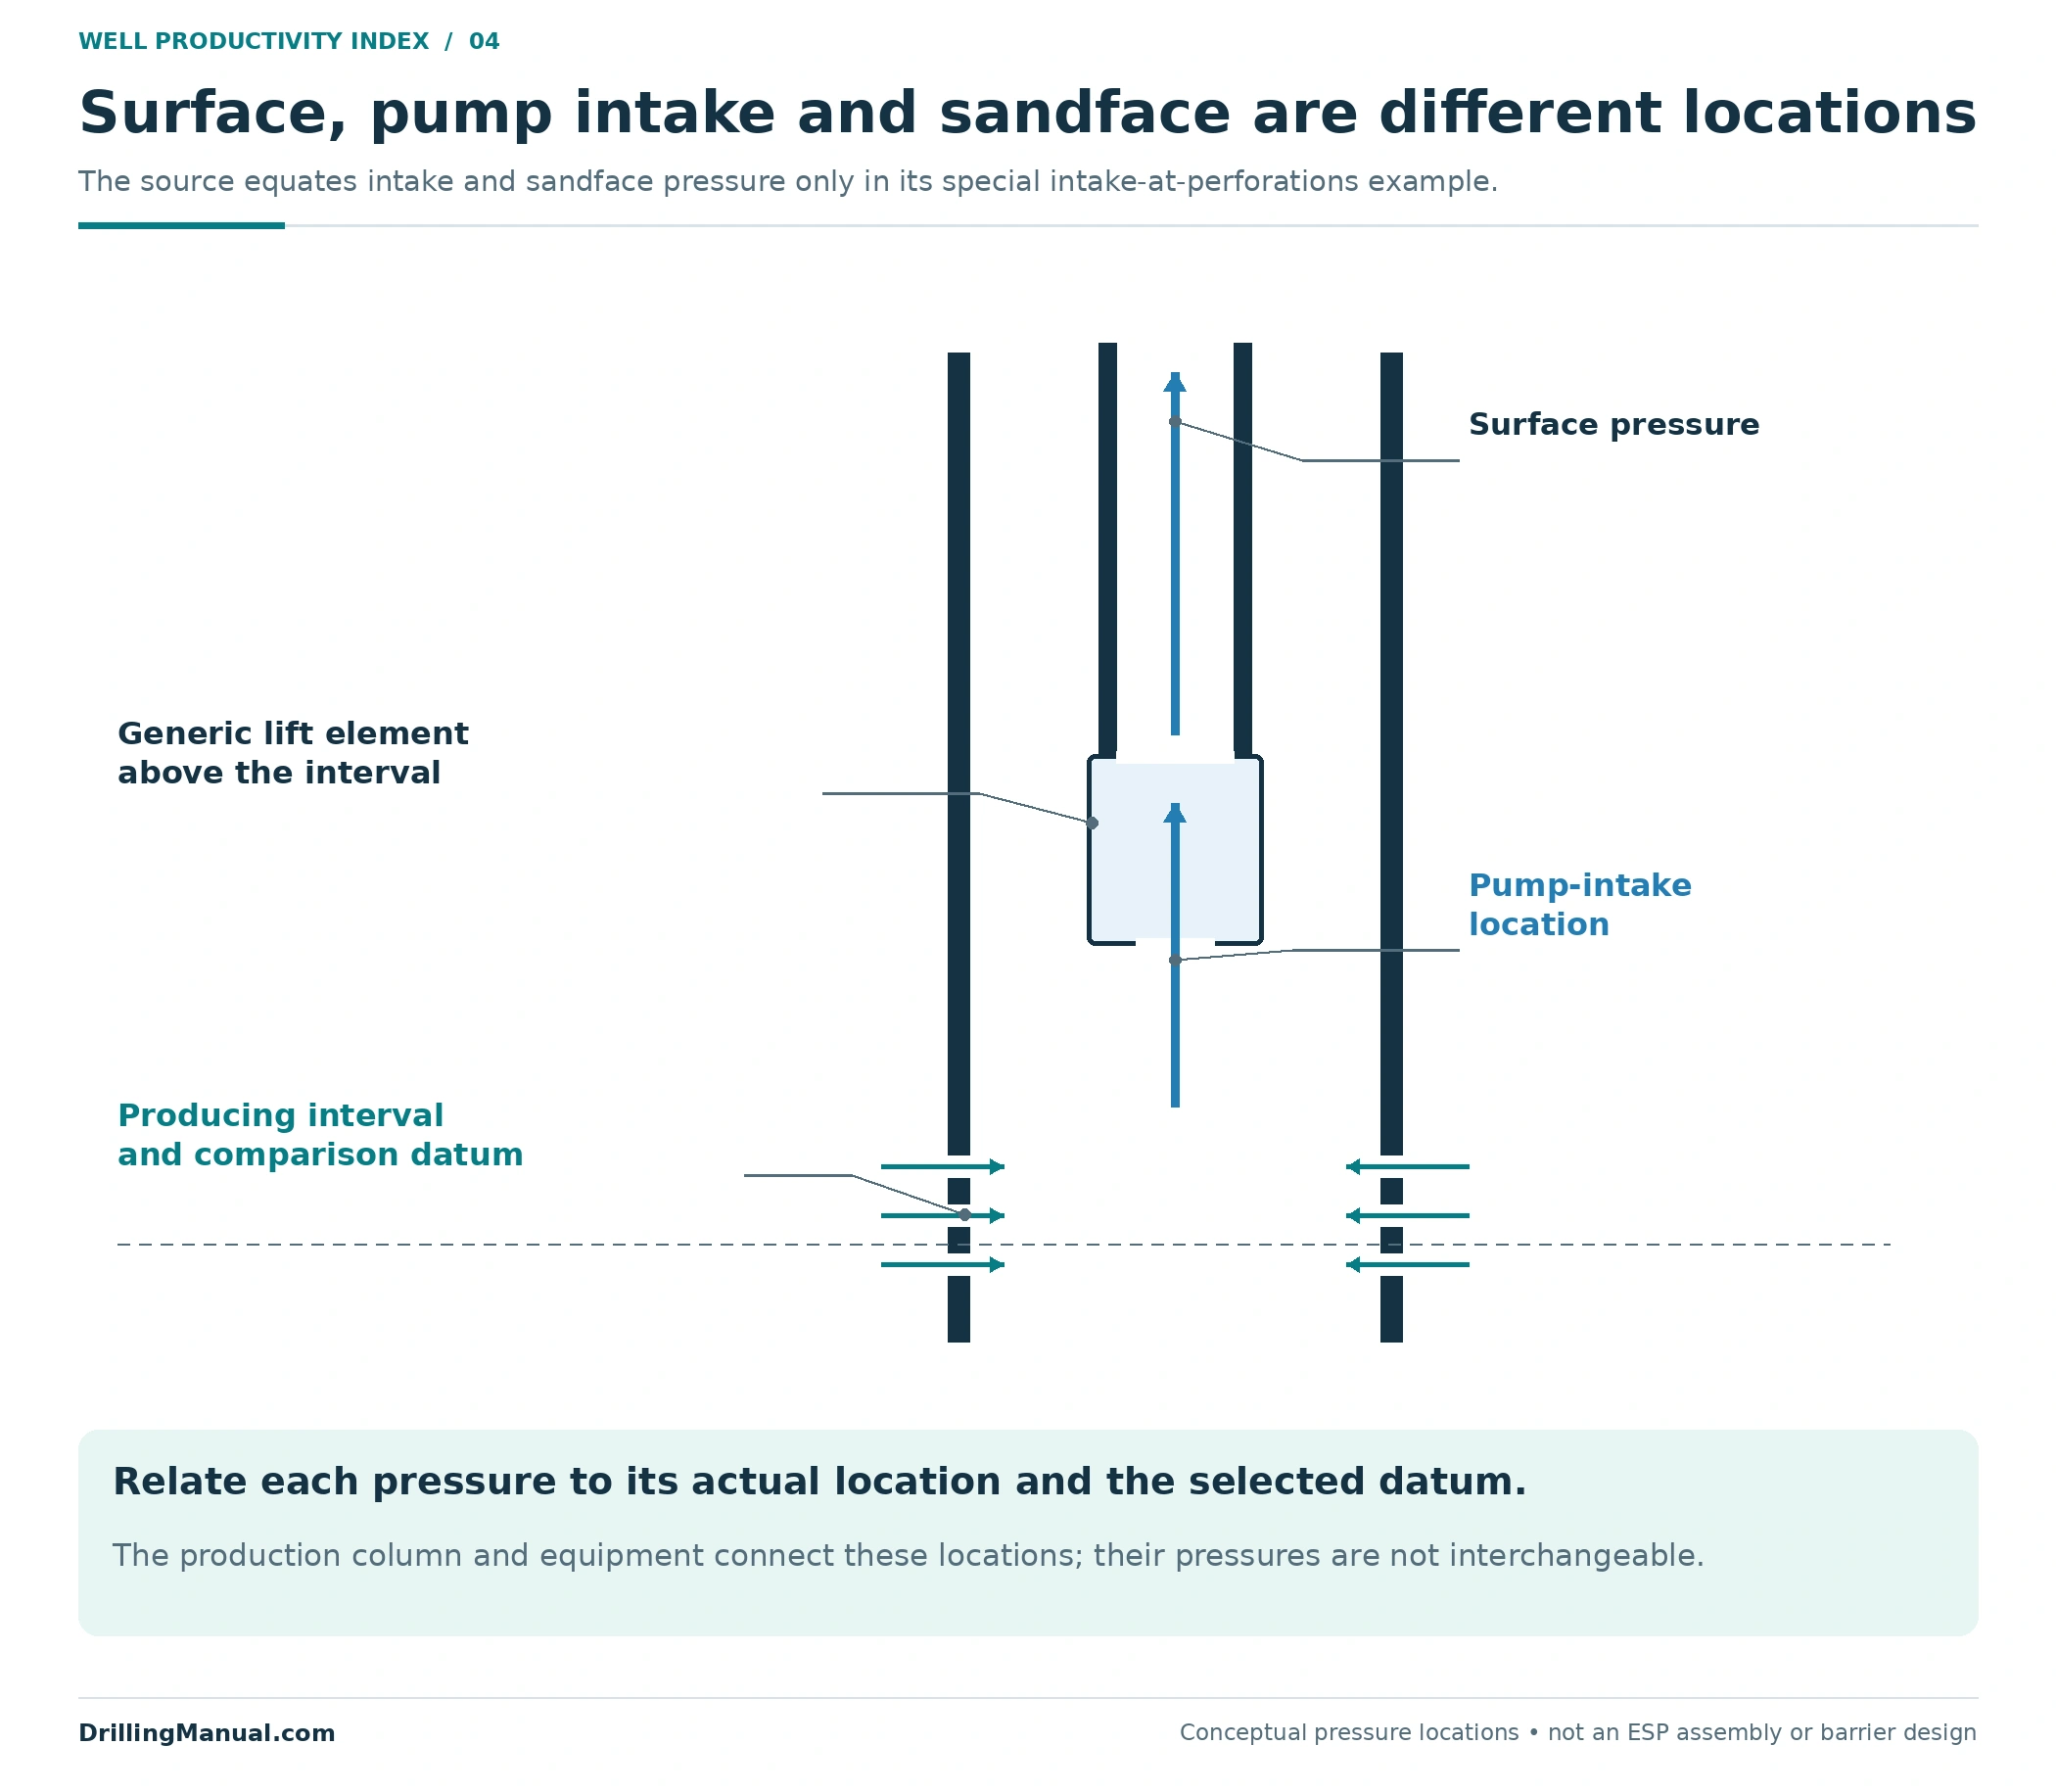
The denominator is drawdown between reservoir and flowing sandface conditions. It is not the difference between reservoir pressure and a convenient wellhead gauge reading. Pressure changes through the producing well depend on its fluid column, flow losses and equipment. The source distinguishes reservoir inflow from the hydraulic path leading to the surface. [1, pp. 582–585]
| Quantity | Declared basis for a liquid comparison | Common substitution to avoid |
|---|---|---|
| q | Oil or total-liquid rate, with its volume conditions and units stated. | Oil rate before the job and total-liquid rate afterward. |
| pr | Reservoir pressure appropriate to the interval, date and interpretation model. | An old value retained after reservoir conditions have changed. |
| pwf | Flowing bottomhole pressure at the same reference datum as the pressure comparison. | Wellhead or pump-intake pressure used without the necessary relationship to the sandface. |
| J | For q in bbl/d and drawdown in psi, bbl/d/psi. | A rate-only percentage presented as a productivity gain. |
The well productivity index is a measure of inflow performance under the stated conditions. Its interpretation also depends on fluid properties, relative permeability, completion exposure and skin. It is not an independent measurement of formation permeability or a direct identification of the material causing damage. [3, pp. 830–831] [1, p. 550]
Why a Higher Rate Does Not Prove Better Inflow
A producing well combines a reservoir inflow relationship with a completion and surface flow system. Artificial lift, tubing diameter, a choke condition or downstream pressure can change the operating point. The book treats changes to inflow and changes to vertical lift performance as separate ways of changing production. A workover may improve one without improving the other. [1, pp. 583–587]
For example, restoring a pump’s performance can allow a lower flowing pressure and a larger drawdown. The reservoir may then deliver more liquid along the same inflow relationship. This can be a useful operational result, but it does not require the well productivity index to increase. The source’s ESP example also shows that the pump and assumed reservoir PI must be considered together. [1, pp. 586–587] [2, pp. 619–623]
The ESP guide explains the equipment mechanism. For post-job evaluation, keep the claims separate: the well produces more, the lift system performs differently, and the reservoir delivers more per unit drawdown are related statements with different evidence requirements.

Well Productivity Index Example 1: More Drawdown, Same PI
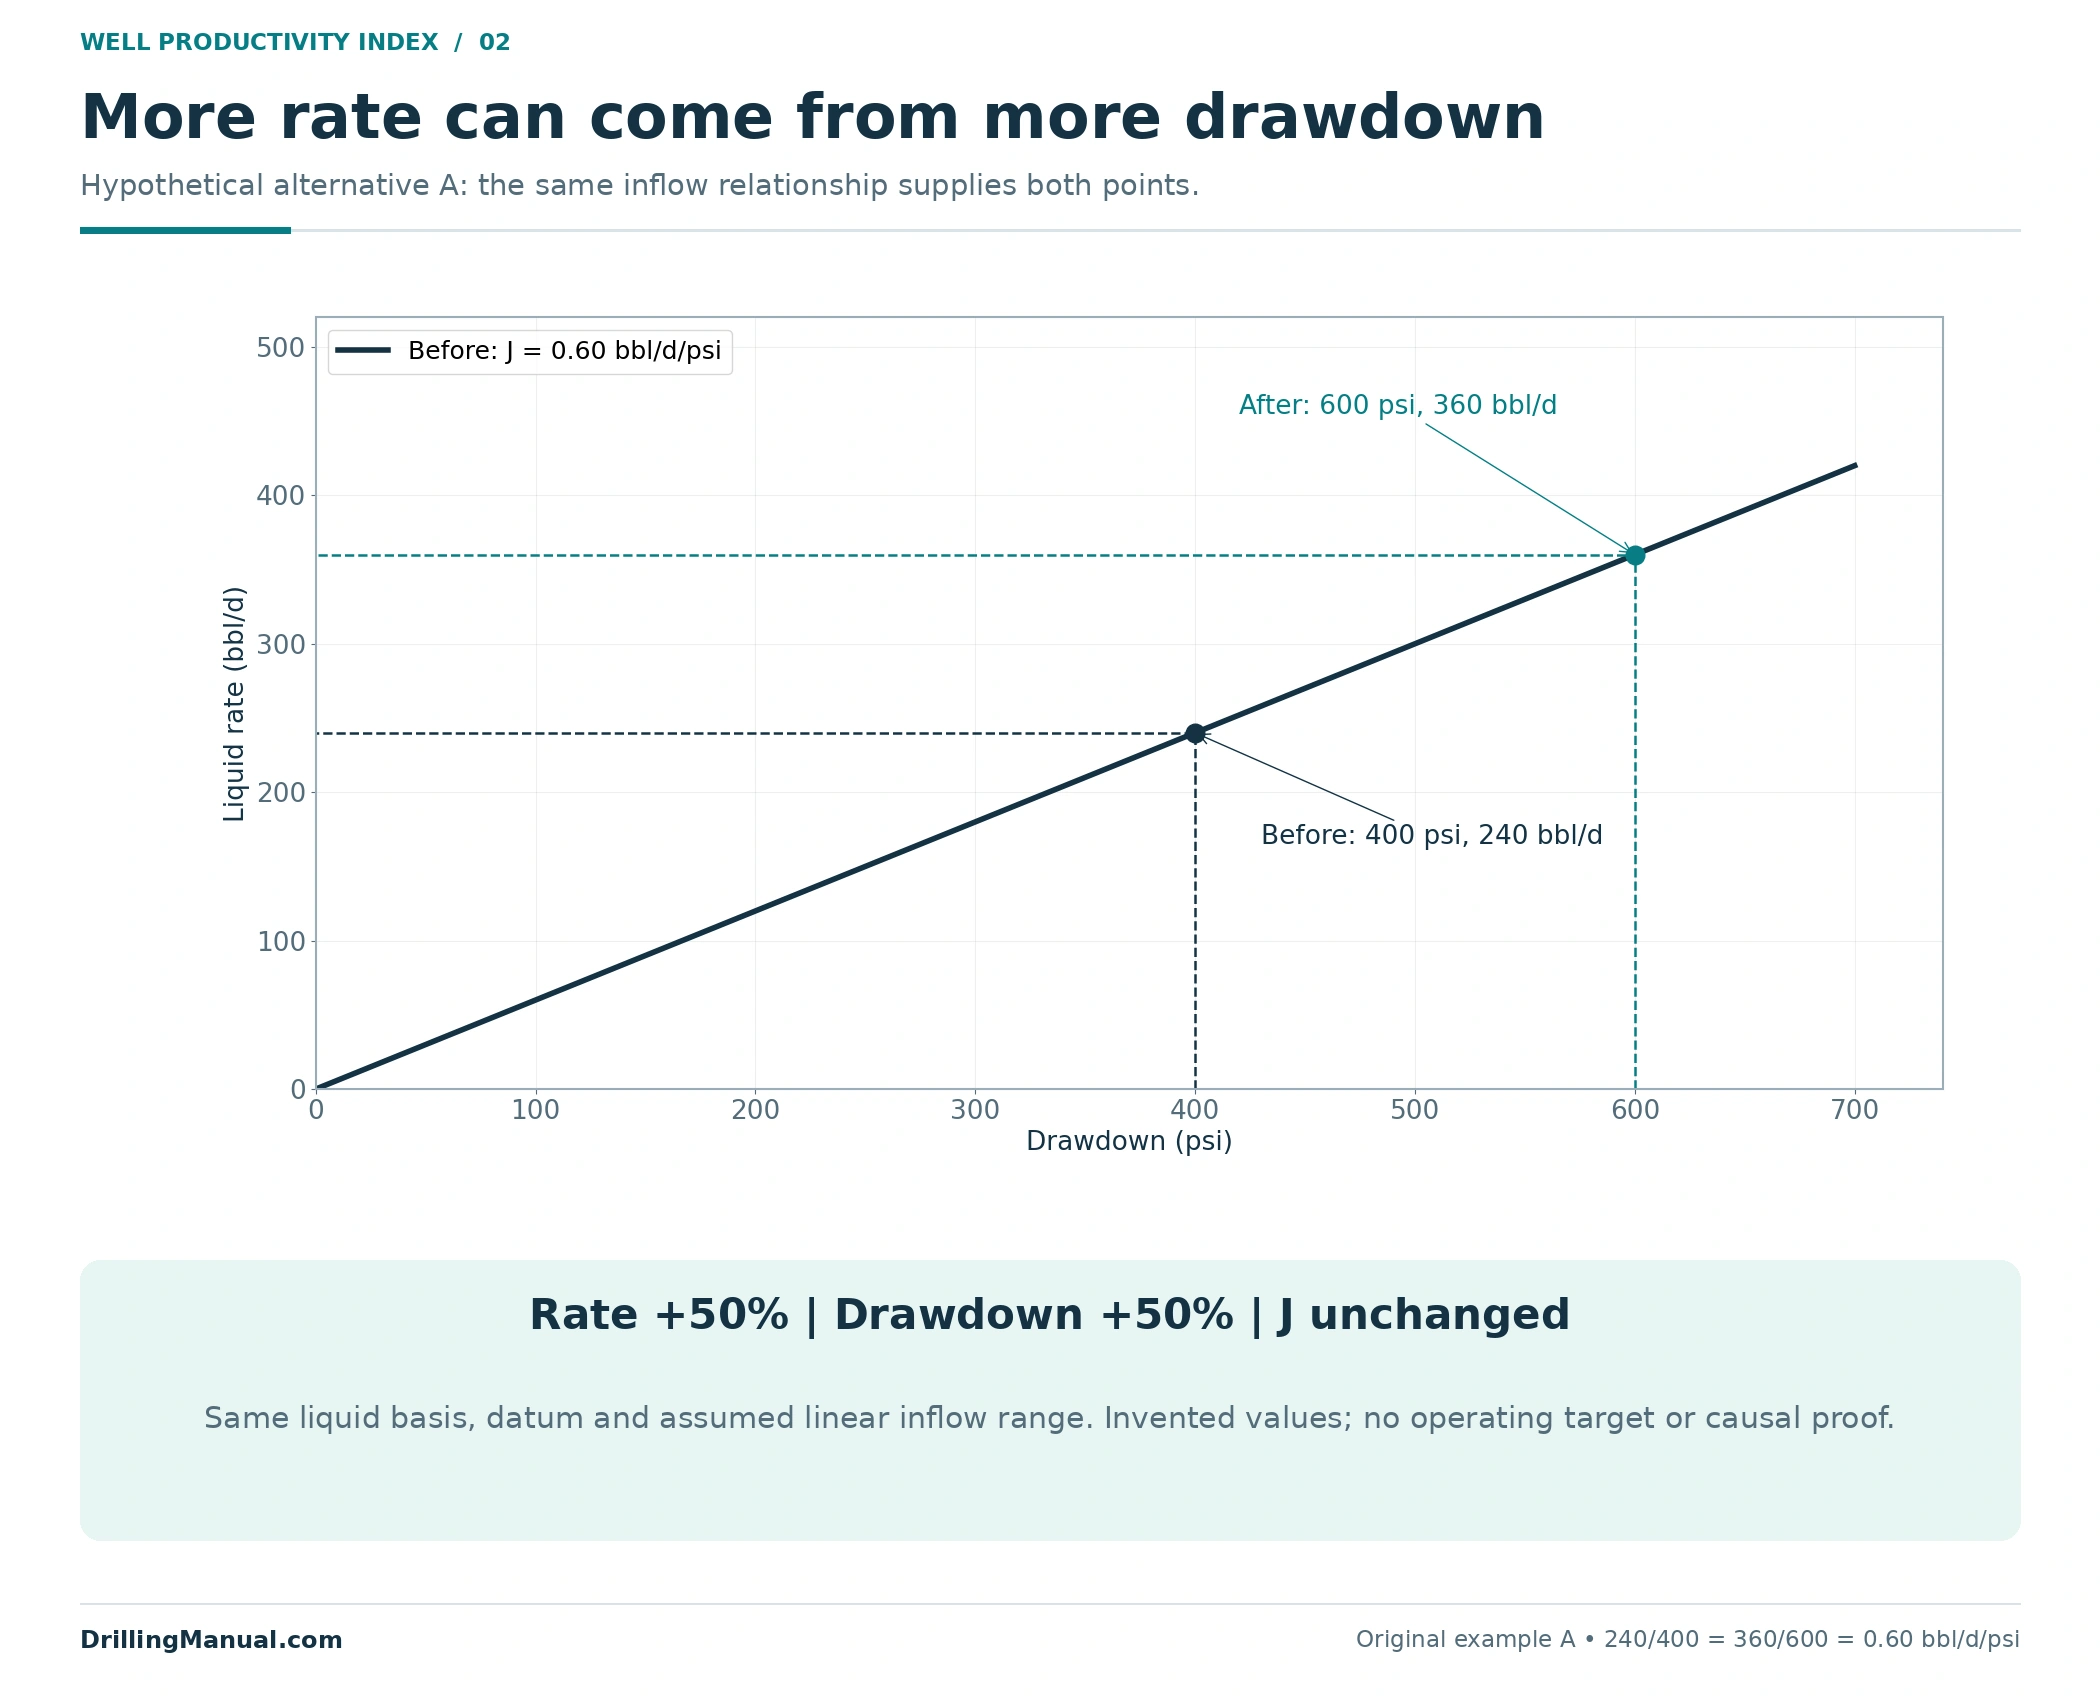
Assume a hypothetical liquid well with comparable interpreted test conditions, unchanged completion exposure and a justified linear inflow relationship over the illustrated range. The liquid composition and rate-reporting basis are held constant. Both pressures use the same reference datum and gauge-pressure basis. The figures are deliberately simple so the effect of drawdown is visible.
| Quantity | Before the workover | After the workover |
|---|---|---|
| Liquid rate | 240 bbl/d | 360 bbl/d |
| Reservoir pressure | 2,800 psig | 2,800 psig |
| Flowing bottomhole pressure | 2,400 psig | 2,200 psig |
| Drawdown | 400 psi | 600 psi |
| J = q/drawdown | 0.60 bbl/d/psi | 0.60 bbl/d/psi |
The rate increased by 50%, from 240 to 360 bbl/d. Drawdown also increased by 50%, from 400 to 600 psi. The well productivity index is unchanged: 240/400 = 360/600 = 0.60 bbl/d/psi. The two points lie on the same assumed straight-line inflow relationship.
The defensible conclusion is “higher liquid rate at greater drawdown, with no PI gain in this comparison.” It would be wrong to report a 50% inflow improvement from the rate increase alone. The intervention may still have achieved its objective by restoring the well’s ability to produce at the new operating point; the example simply does not demonstrate improved inflow efficiency. This is the distinction illustrated by the source’s separate inflow and outflow modifications. [1, pp. 586–587]
Well Productivity Index Example 2: More Rate at Matched Drawdown
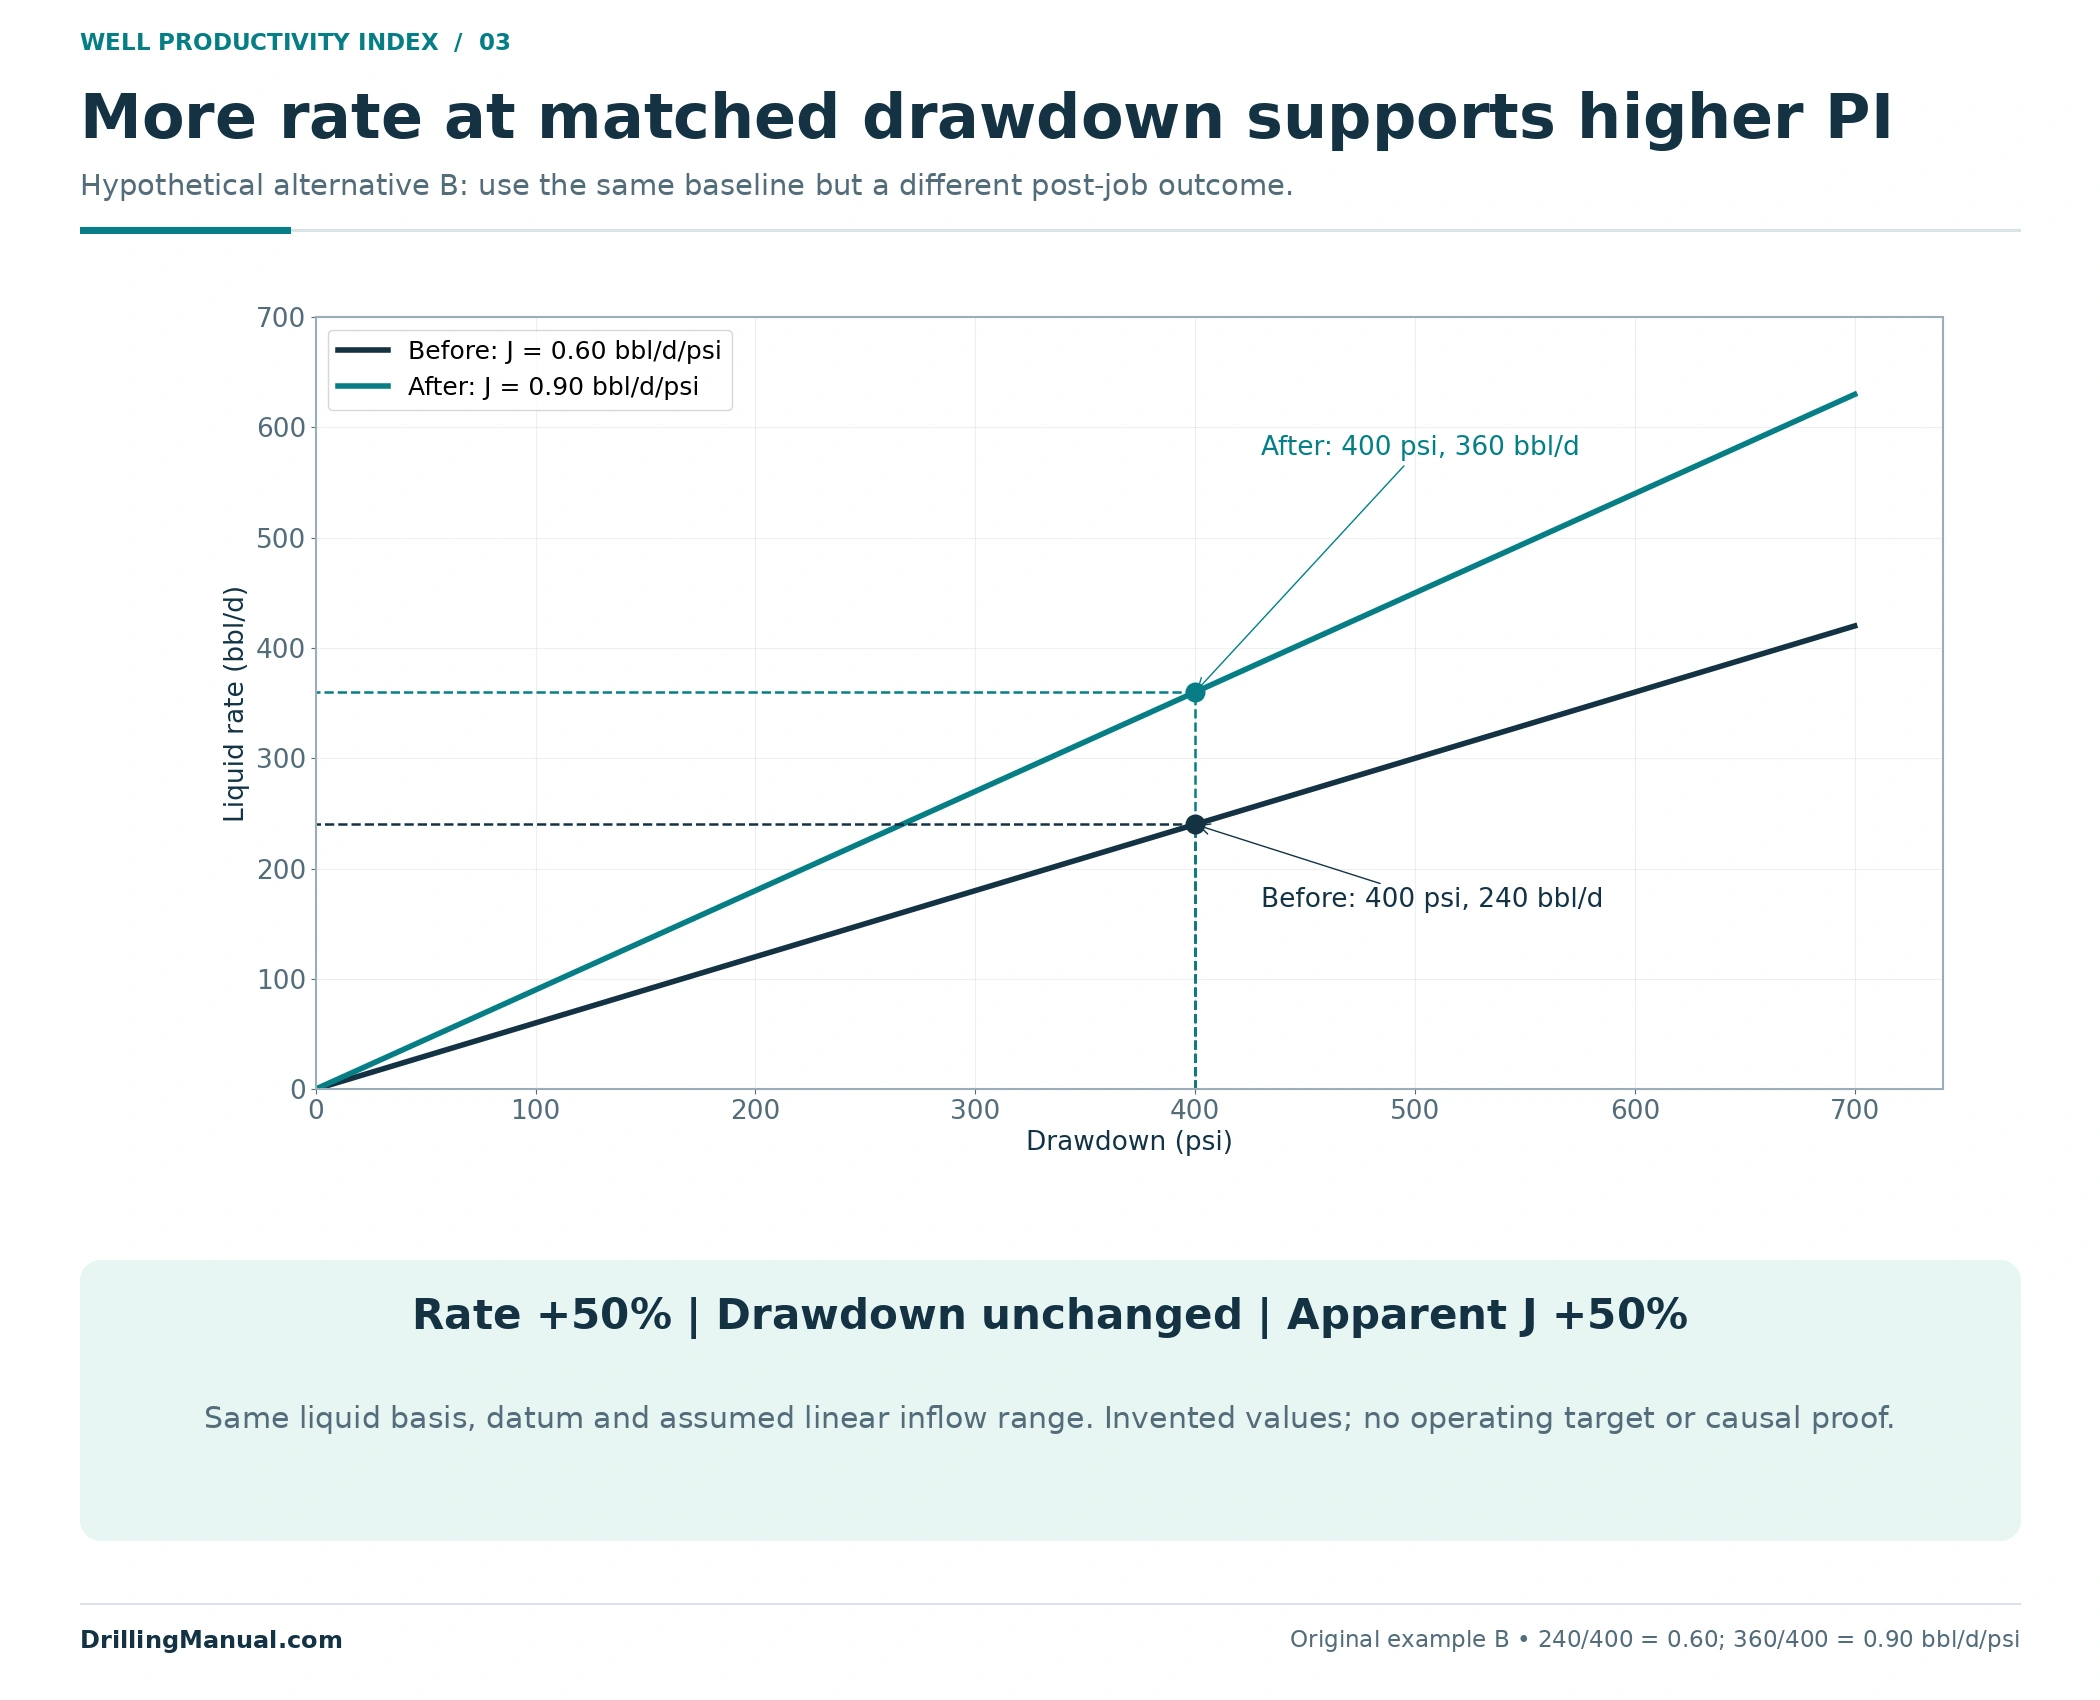
Now use the same invented baseline and the same comparison assumptions, but hold drawdown at 400 psi after the workover. The measured liquid rate is again 360 bbl/d. This is an alternative hypothetical outcome, not a second stage in the first example.
| Quantity | Before the workover | After the workover |
|---|---|---|
| Liquid rate | 240 bbl/d | 360 bbl/d |
| Reservoir pressure | 2,800 psig | 2,800 psig |
| Flowing bottomhole pressure | 2,400 psig | 2,400 psig |
| Drawdown | 400 psi | 400 psi |
| J = q/drawdown | 0.60 bbl/d/psi | 0.90 bbl/d/psi |
Here, the well productivity index rises by 50%: (0.90/0.60 − 1) × 100. The well delivers more liquid for the same pressure difference. Under the stated comparable conditions, this supports improved apparent liquid inflow performance.
It does not identify the cause on its own. Changed interval contribution, near-wellbore conditions, fluid properties or other completion effects can influence the result. A claim that a specific damage mechanism was removed needs supporting diagnosis, not only the quotient. The book’s discussion of skin includes both near-wellbore permeability effects and changes in flow exposure or geometry. [1, p. 550] [3, pp. 830–831]
Matched drawdown is an analytical comparison condition here, not an instruction to operate a well at either example pressure. Field comparisons may use an appropriate interpreted inflow relationship to compare equivalent conditions. That interpretation must remain within the range and assumptions it can support. Neither example supplies a permissible drawdown, a required test rate or a minimum improvement that would justify an intervention.
Match the Well Productivity Index Pressure Basis
The pressure comparison must refer to the same physical level and the same producing system. A pump-intake reading is not automatically a sandface pressure. In the book’s worked ESP example, the two are equal because the pump intake is assumed to be at the perforations; the text explicitly distinguishes an intake placed higher in the well. Do not transfer that special geometry to another completion. [2, pp. 620–621]
Use reservoir pressure relevant to the test being interpreted. The IPR discussion distinguishes initial, boundary and average reservoir pressure according to the flow model, and it explains that depletion and transient time can change the apparent relationship. A comparison that silently mixes those definitions can make a numerical PI change look more meaningful than it is. [1, pp. 582–583]
Rate and flowing pressure must also represent compatible conditions. Pairing a short production surge with a later pressure reading does not describe one established operating point. The practical requirement is a justified test interpretation with documented timing and uncertainty, not an arbitrary waiting period applied to every well. This is an editorial measurement discipline built from the source’s distinction between transient, steady and pseudosteady inflow. [1, p. 583]
At small drawdown, uncertainty in the pressure difference can have a large effect on the calculated ratio. Preserve the measurement and interpretation uncertainty rather than reporting many decimal places as evidence of accuracy. The formula can be calculated exactly while its inputs remain uncertain.
A useful review keeps the pressure values beside the reported index. That allows the reader to see whether an apparent change comes mainly from rate, drawdown or both. It also exposes a changed reservoir-pressure assumption that a standalone PI number would hide. If the pressure datum or interpretation differs between tests, resolve that difference before assigning a percentage improvement. The well productivity index calculation is only as comparable as the values entered into it.

Keep Oil Rate and Total-Liquid Rate Separate
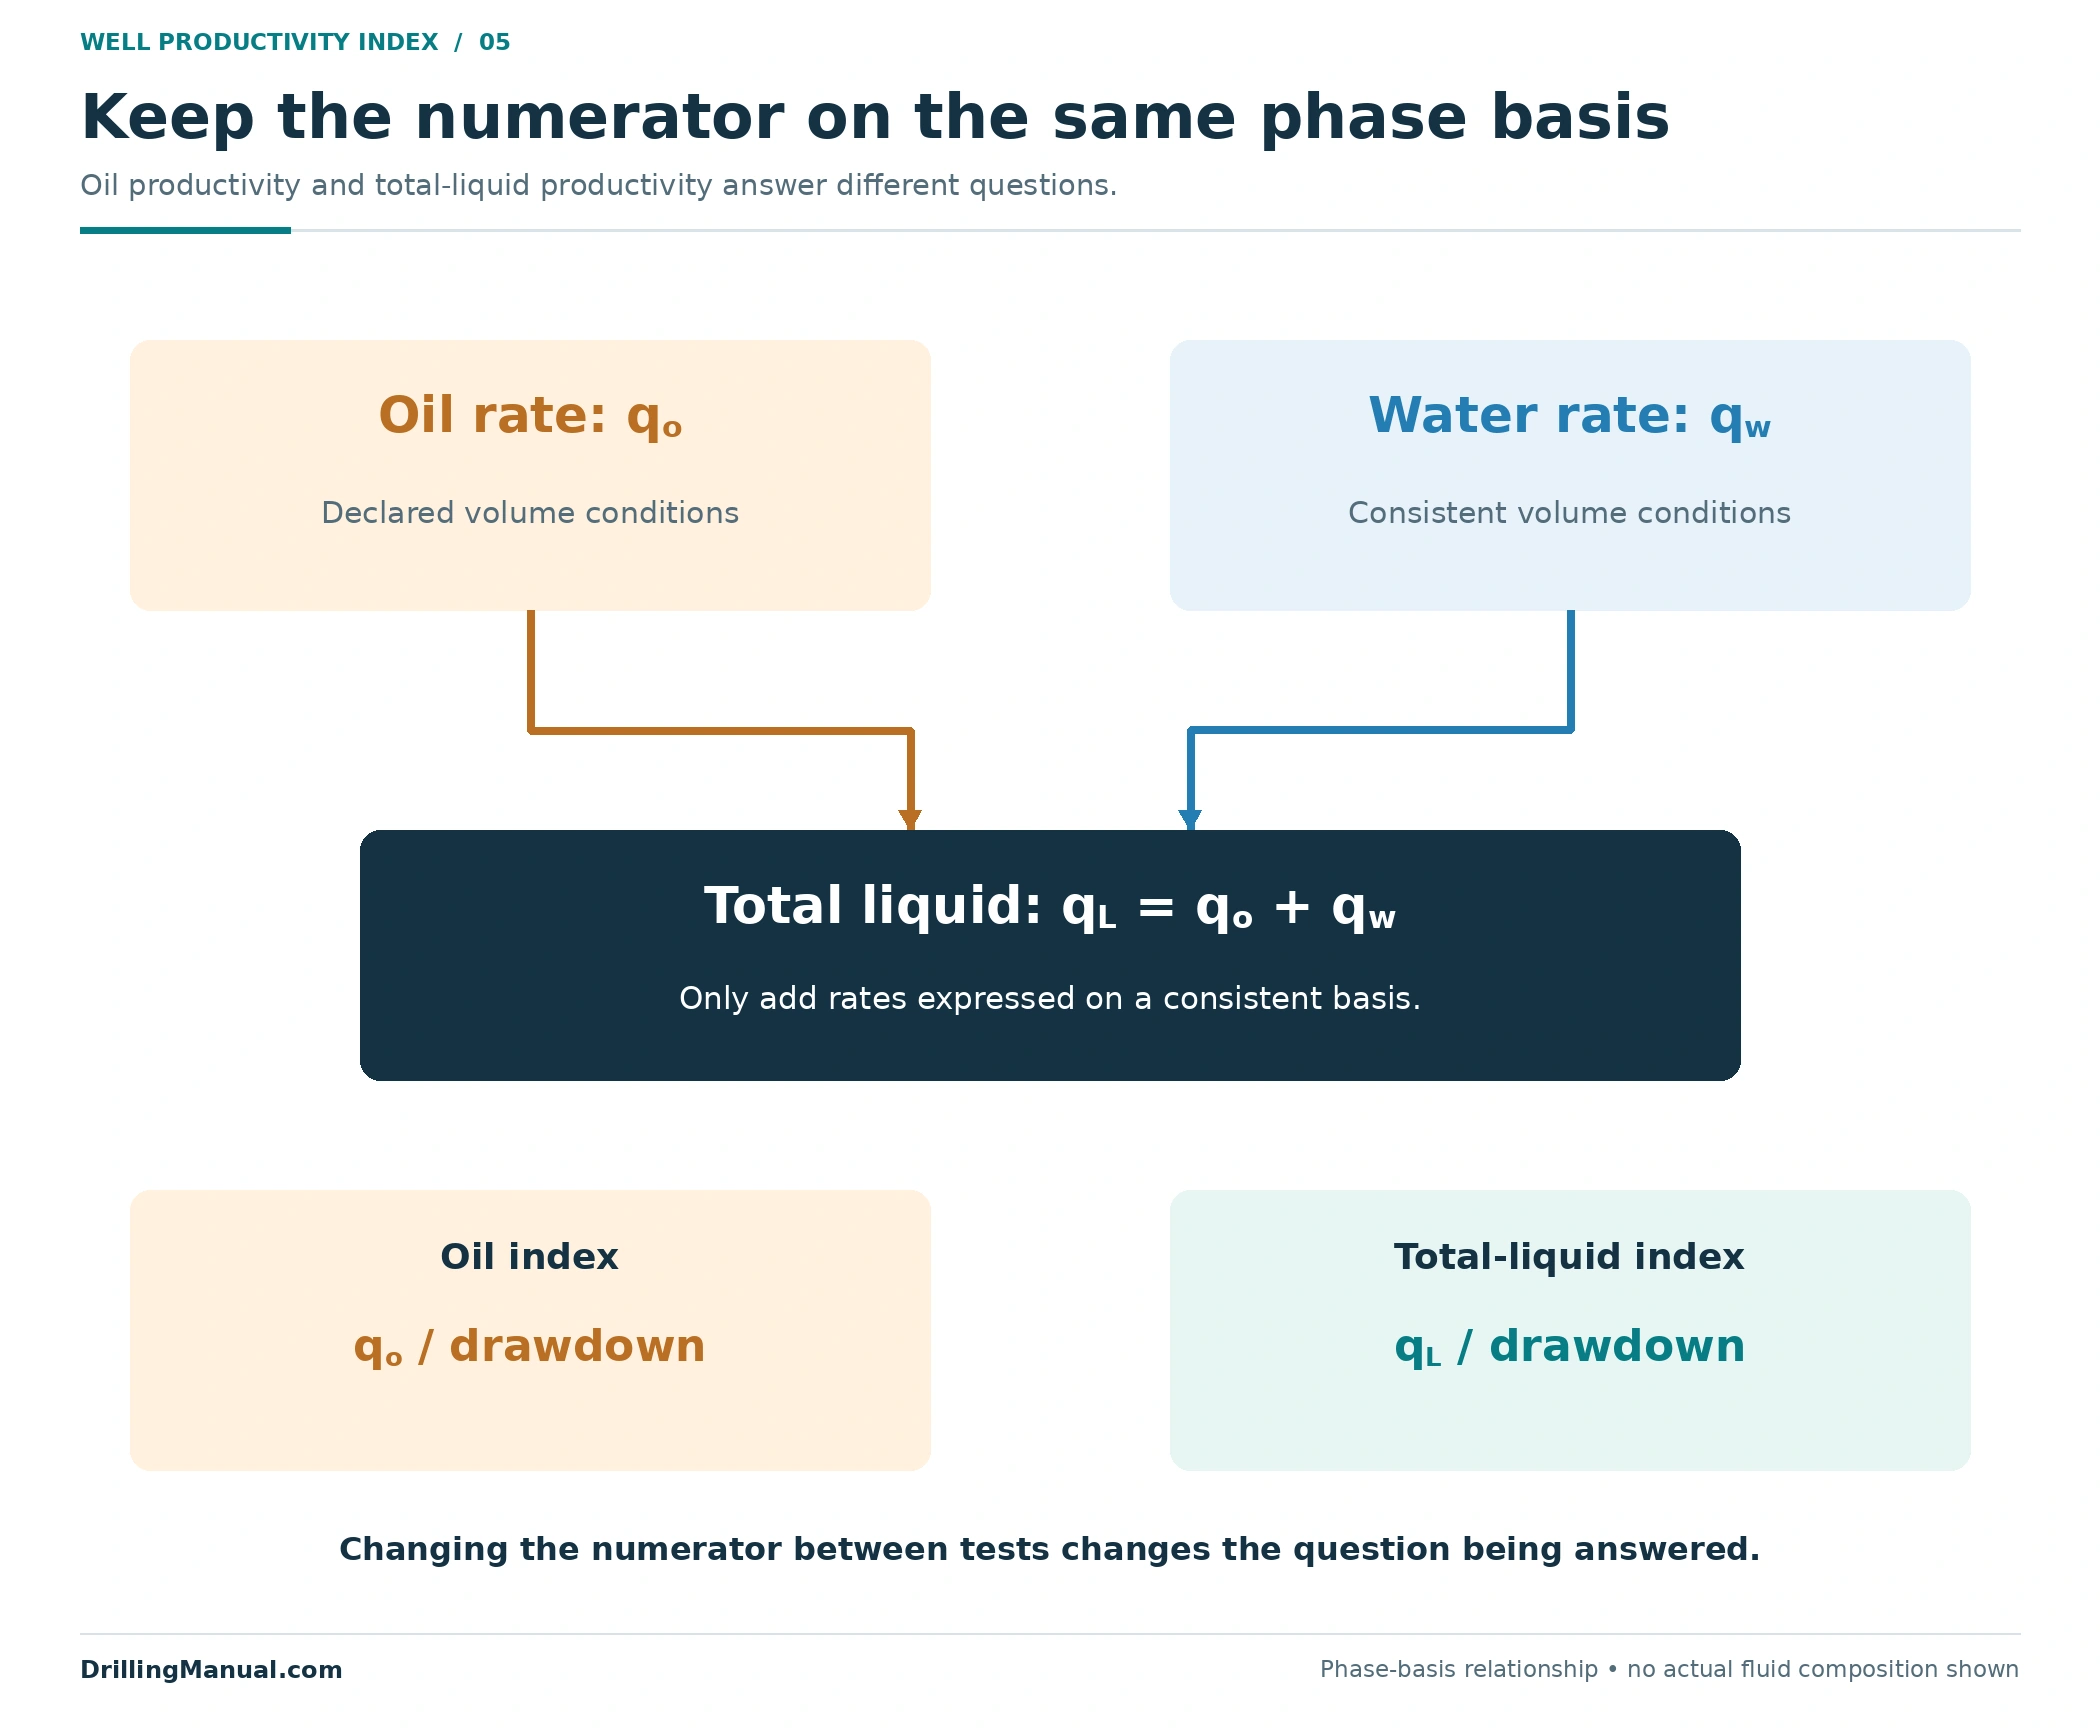
State whether the numerator is oil or total liquid. If a report uses total liquid, qL = qo + qw on a consistent volume basis. Oil productivity and total-liquid productivity then answer different questions. An increase in water contribution can raise total liquid without delivering the same improvement in oil production. The book discusses phase relative permeabilities and the effect of water on well and facility performance. [3, pp. 829–832]
This matters after water shutoff. A treatment can remove a water-producing contribution and change the remaining operating conditions. A lower total-liquid rate is therefore not enough to declare failure, while a higher oil rate does not by itself demonstrate a higher total-liquid PI. Report the phase rates, drawdown and treatment objective together. [3, pp. 830–832]
The well productivity index should not conceal a changed interval. If the work introduces a new producing zone, the before-and-after results may describe different reservoirs or different combinations of inflow. That is useful completion information, but it is not a clean measurement of improvement in the original interval. Record the changed scope explicitly.
Where the Straight-Line PI Comparison Stops Working
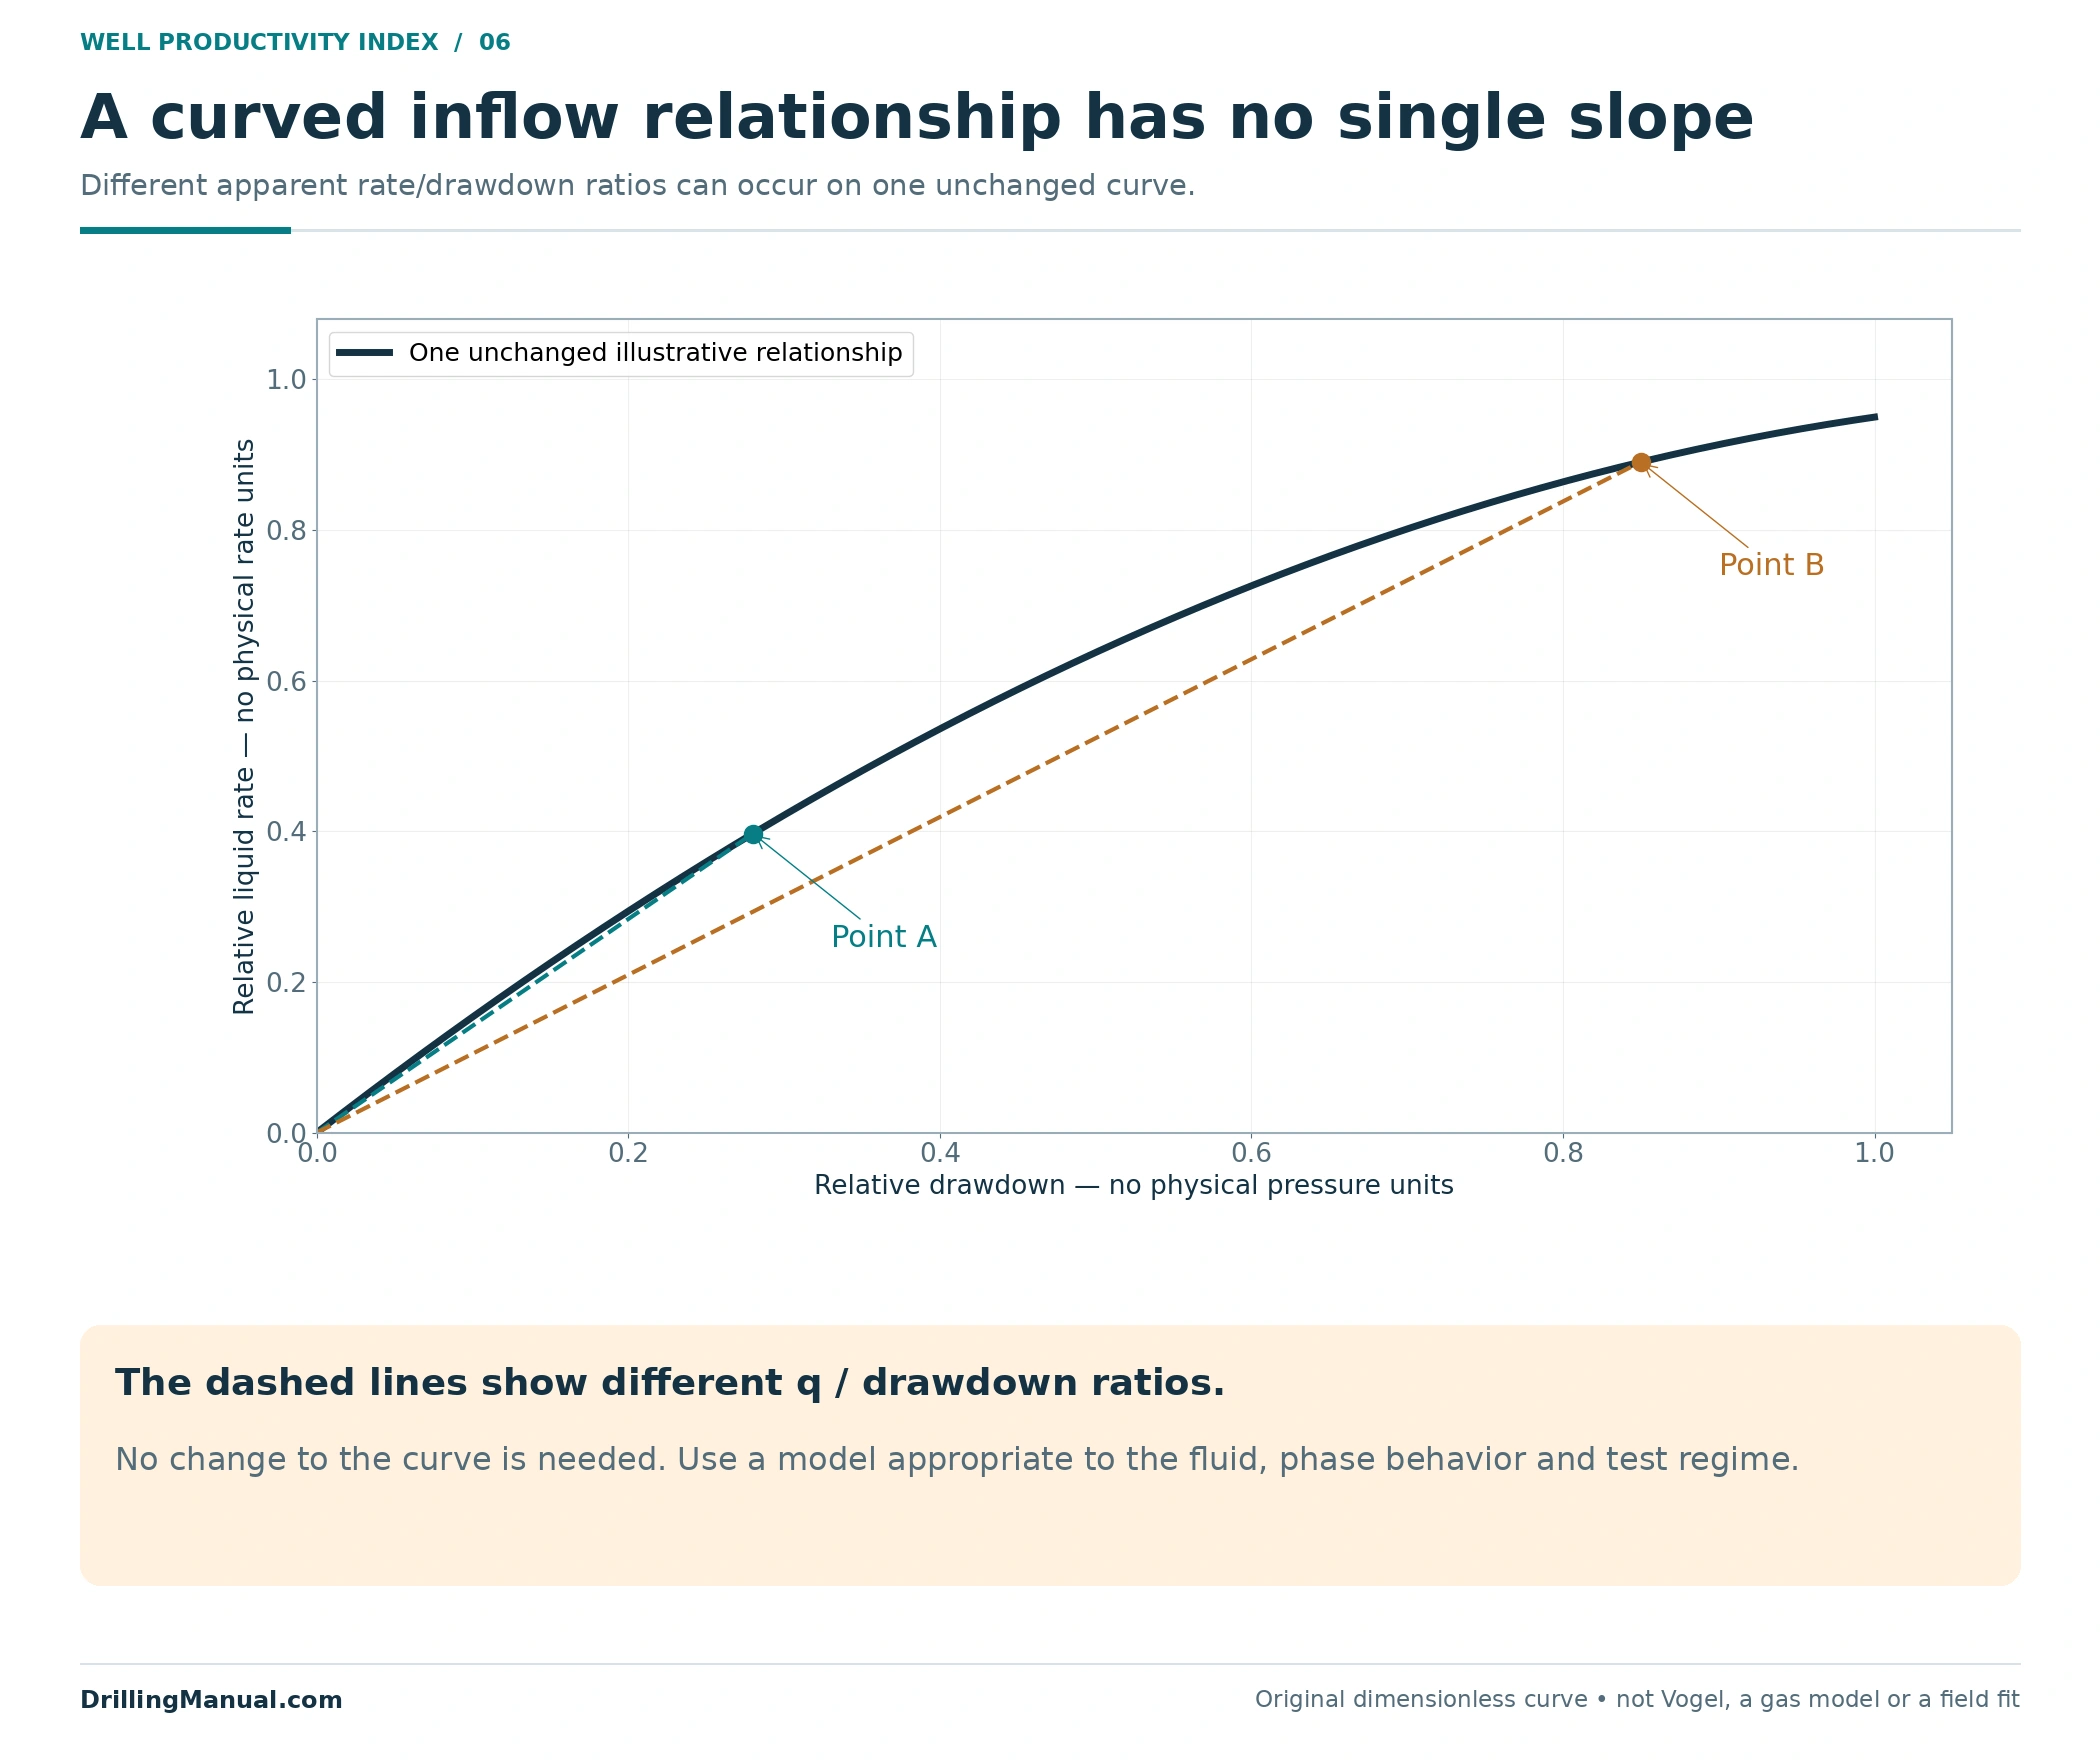
The source states that steady-state liquid IPR is straight, while two-phase and gas inflow can be curved. A single ratio from one point on a curved relationship is an apparent value at that condition. It should not automatically become a constant multiplier for forecasts across the whole production range. [1, p. 583]
For oil, a comparison crossing bubblepoint-related fluid changes needs a suitable inflow model and fluid-property basis. The book notes that oil viscosity can change as pressure falls below bubblepoint; its broader inflow discussion distinguishes two-phase behavior from the straight liquid relationship. The teaching examples deliberately avoid that complication rather than assuming it away in a real well. [3, p. 832] [1, p. 583]
For gas, pressure-dependent properties require a gas-appropriate formulation. The source develops gas pseudopressure for that purpose. Do not transfer the liquid bbl/d/psi comparison directly into gas deliverability or label a changing gas-rate/pressure-difference quotient as proof of stimulation. [1, pp. 549–550]
Figure 6 is an invented curved relationship. Its two points produce different rate-to-drawdown ratios even though the underlying curve has not changed. The figure is a warning about model choice, not a gas equation, a Vogel correlation or a fit to a particular reservoir.
Build a Well Productivity Index Evidence Record
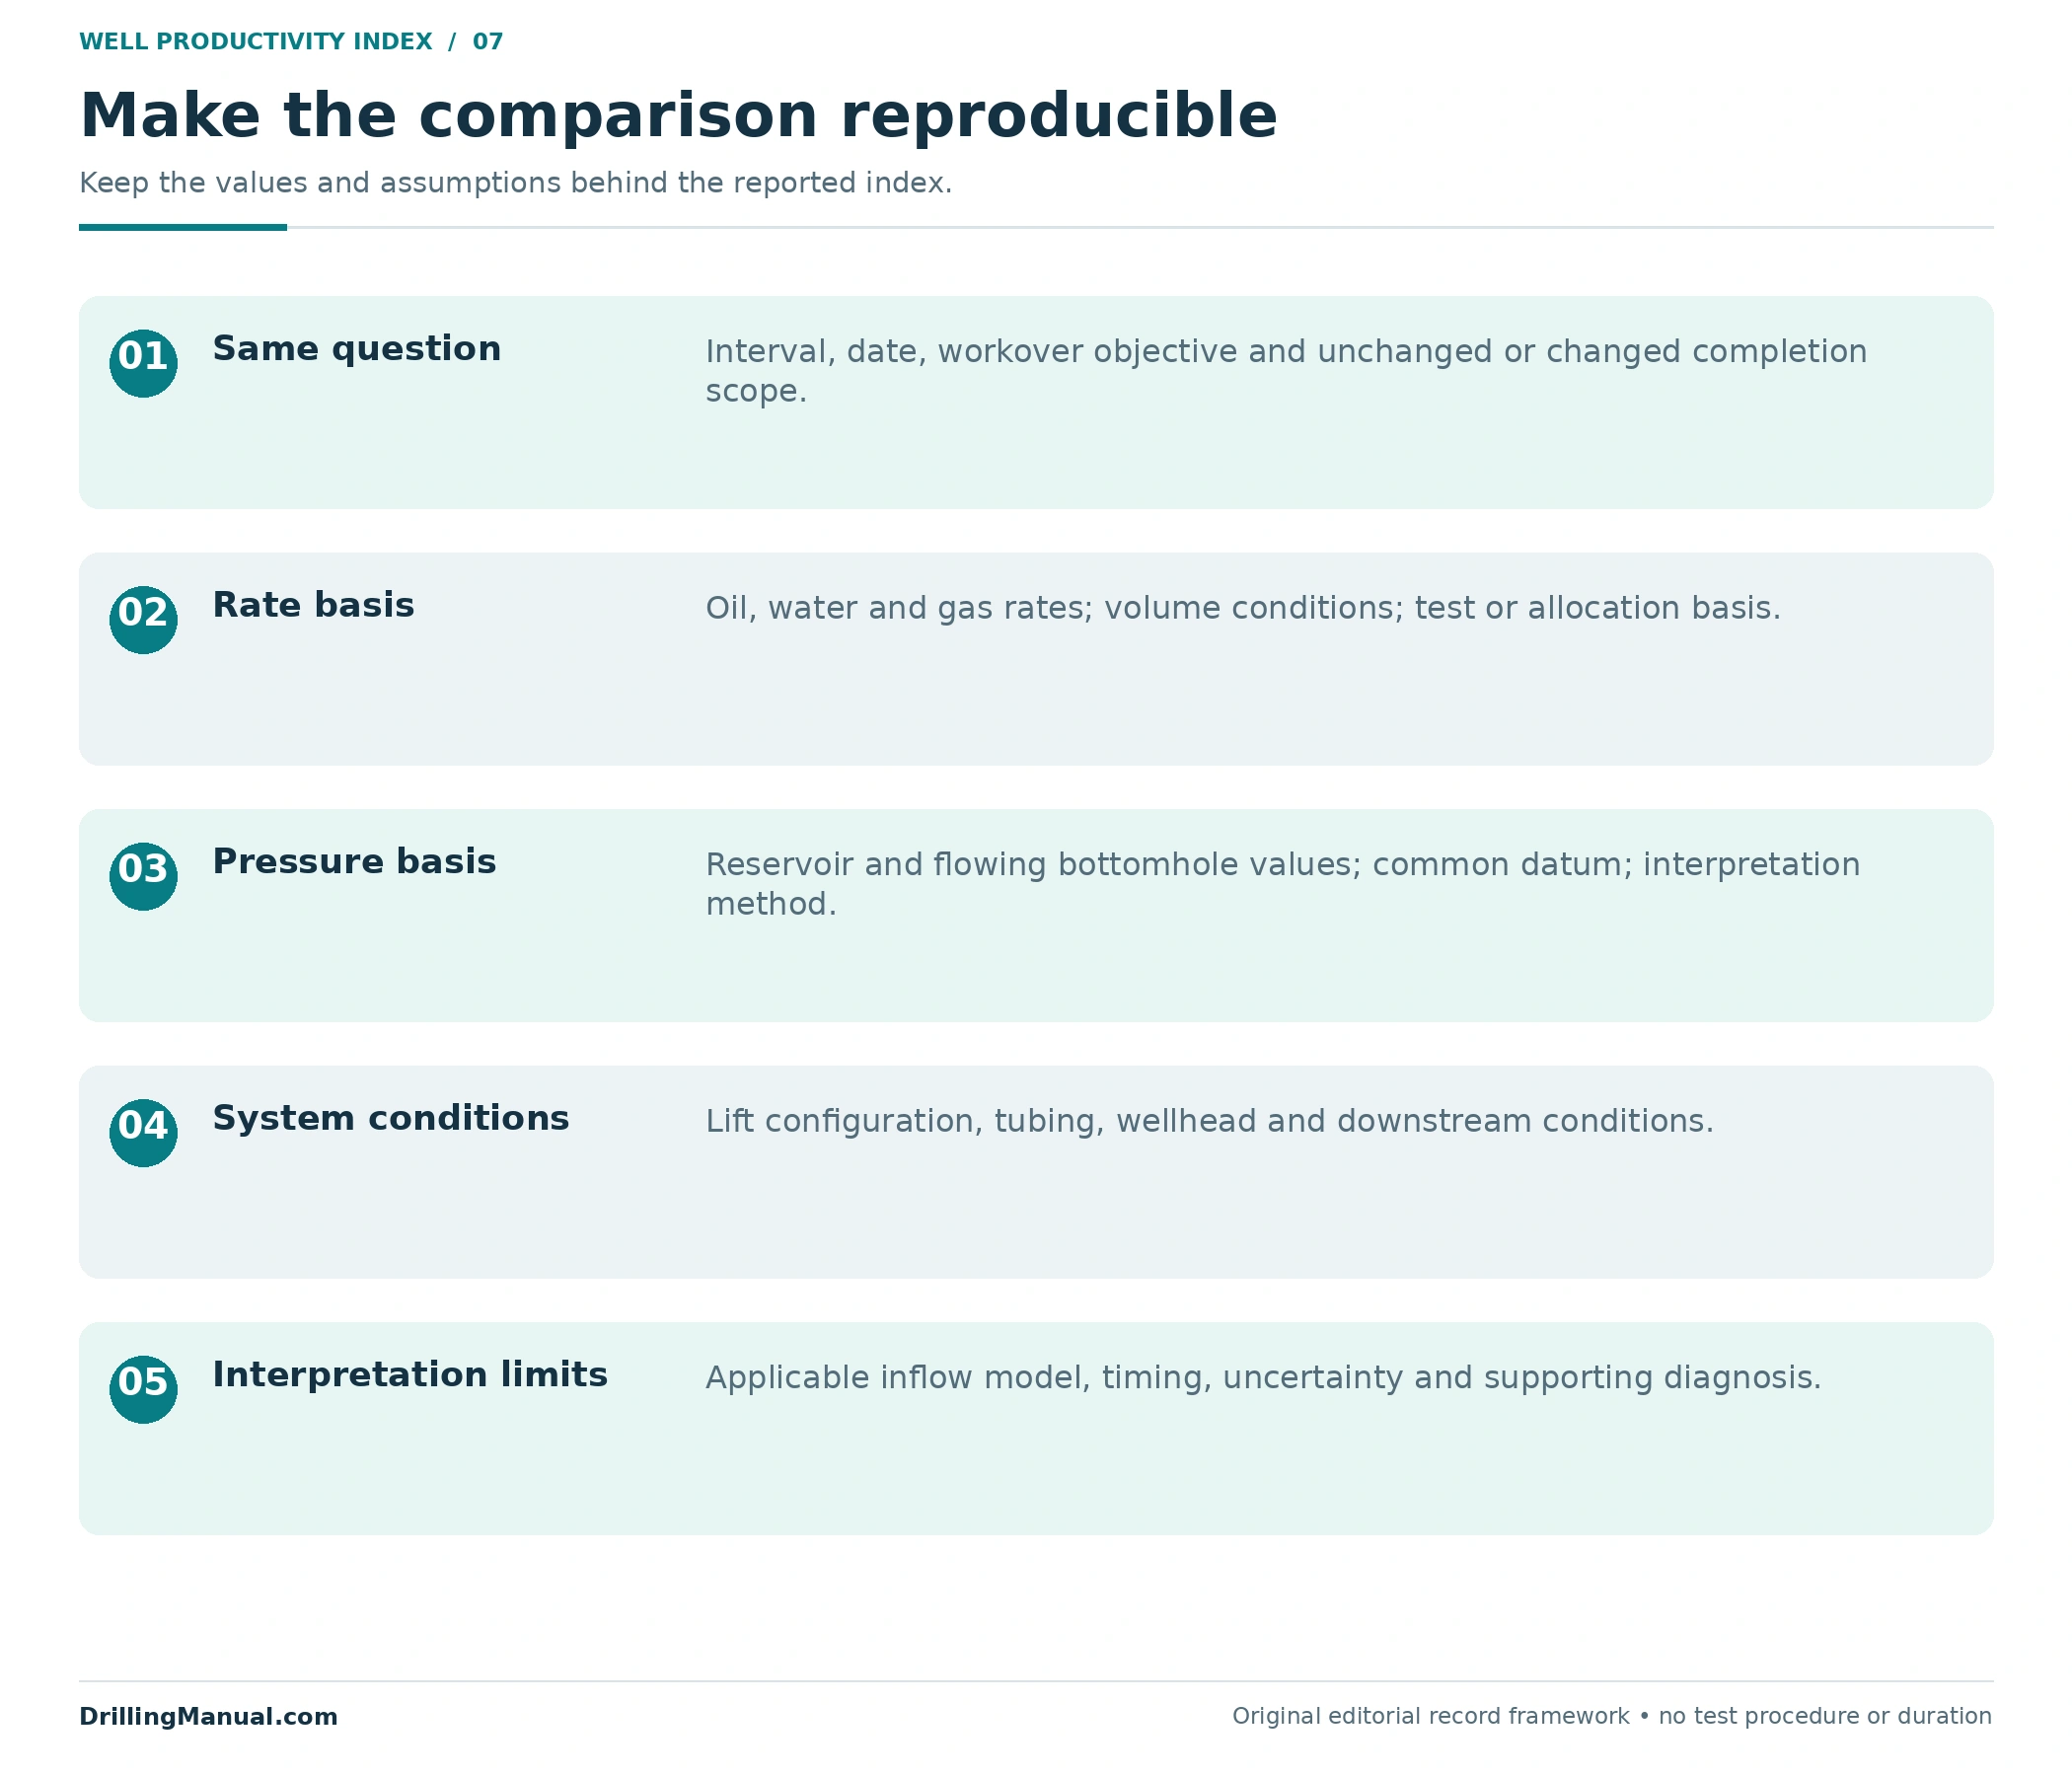
The following record is an original editorial framework for applying the book’s distinctions. Its purpose is to make a well productivity index comparison reviewable: another engineer should be able to identify the rate basis, pressure basis, model and completion being compared.
| Record | What it resolves |
|---|---|
| Before/after dates, completed intervals and treatment objective. | Whether the comparison addresses the same inflow system and the intended outcome. |
| Oil, water and gas rates, with volume conditions and test or allocation basis. | Whether the numerator is comparable and whether phase production changed. |
| Reservoir pressure, flowing bottomhole pressure, datum and interpretation method. | Whether drawdown represents the intended interval and test conditions. |
| Lift, tubing, wellhead and downstream operating conditions. | Whether a changed production-system condition explains the rate response. |
| Applicable inflow model, uncertainty and supporting diagnostic evidence. | How strongly a PI change supports improved inflow or a specific treatment mechanism. |
For damage-removal work, connect the result to the original diagnosis. The separate formation damage and matrix acidizing guides discuss that context. For a treatment intended to change reservoir contact, the hydraulic fracturing guide covers another inflow mechanism. None of those treatment labels replaces a comparable post-job performance assessment. [1, pp. 550, 586]
Keep the raw before-and-after record even when the comparison cannot support a clean PI conclusion. A documented change in liquid rate, water contribution or lift condition remains useful. The correct outcome may be that production improved while the available data cannot separate inflow improvement from a changed operating point. That statement is more informative than attaching an unexplained productivity percentage to the workover.
When a percentage is reported, retain the two index values and their units alongside it. A percentage calculated from unlike rate bases or different pressure references remains misleading even if the arithmetic is correct. Likewise, explain whether the comparison describes one tested condition or a justified range of inflow behavior. This prevents a local performance observation from becoming an unsupported forecast for every future operating condition.
Report the Result at the Strength the Evidence Supports
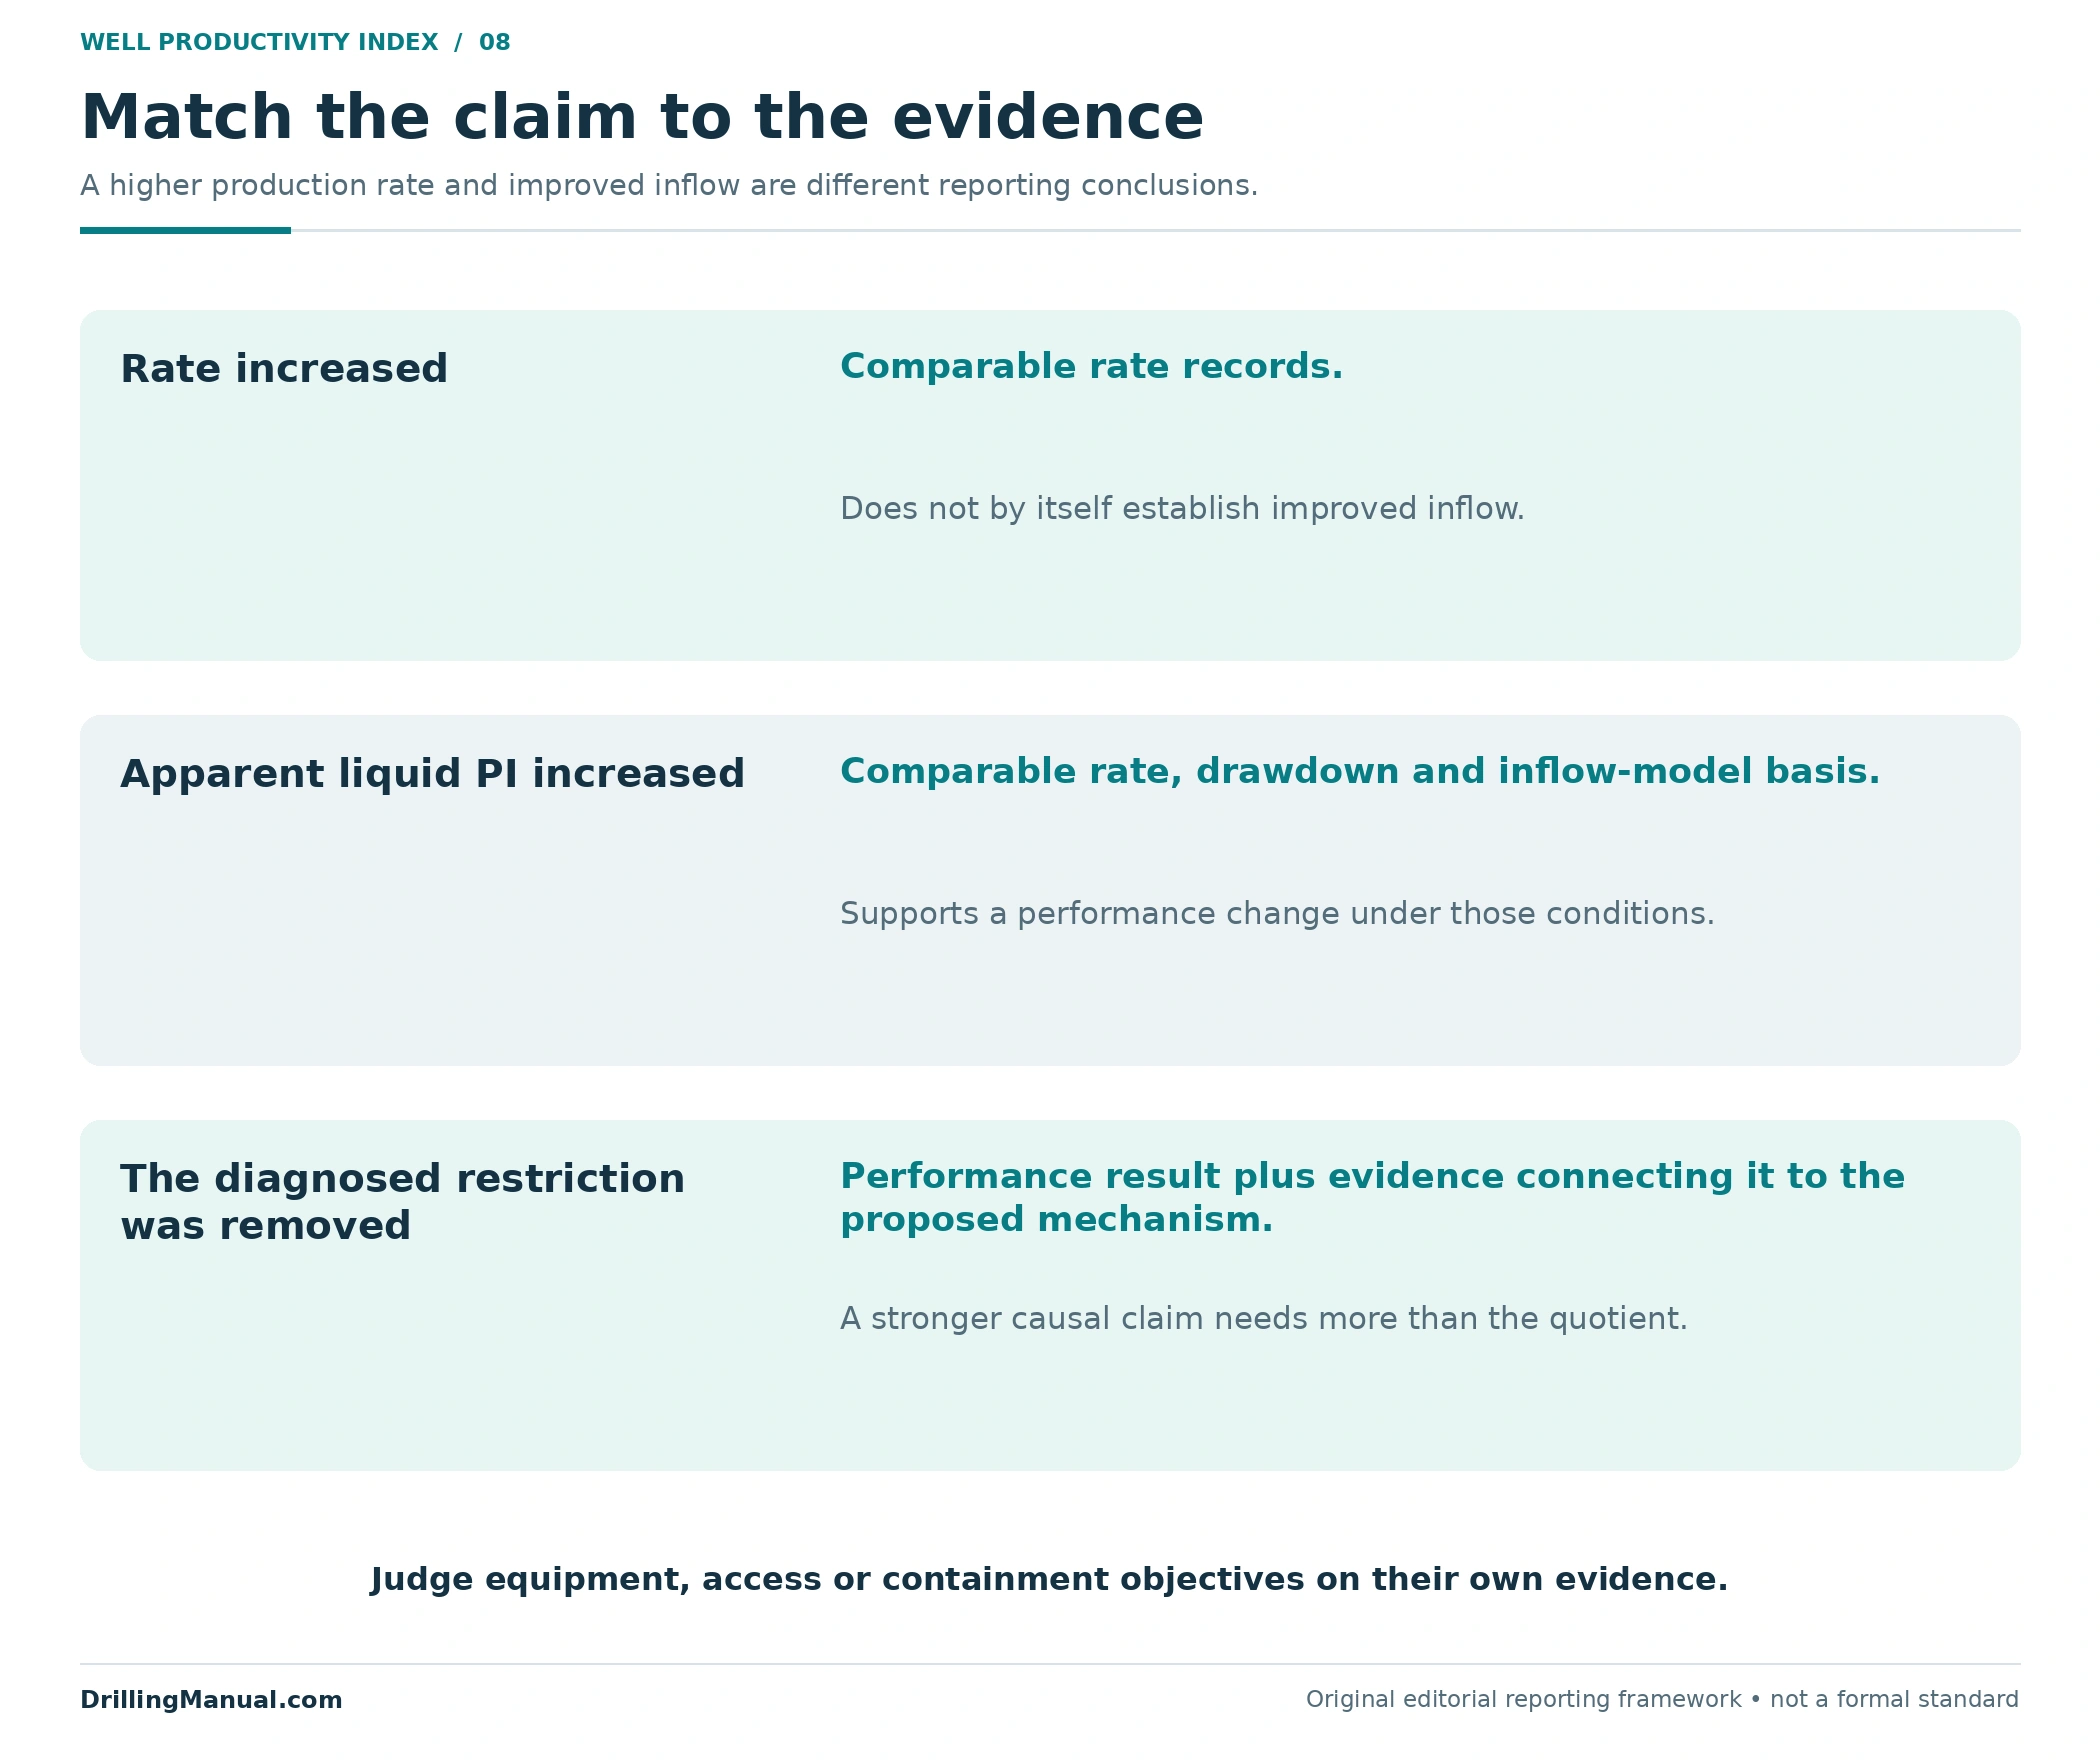
Use precise outcome language. “Rate increased” requires a rate comparison. “Apparent liquid PI increased under comparable conditions” additionally requires a defensible drawdown and rate basis. “The workover removed the diagnosed inflow restriction” needs the performance result plus evidence connecting it to that mechanism. These are editorial reporting levels, not a formal standard.
A successful job also need not improve PI. The objective of workover operations may concern equipment, access or containment. A production-system change can be valuable even when the inflow relationship is unchanged. Report the achieved function and the production result separately, then use the well productivity index only for the inflow question it can answer. [1, pp. 586–587]

Common Questions About Post-Workover Productivity
What is a good well productivity index?
There is no universal value in this comparison. Productivity depends on reservoir, fluid and completion conditions. Use the appropriate model, the well’s relevant baseline and its objective rather than a general pass/fail number. [3, pp. 830–831]
Does a 50% rate increase mean a 50% PI increase?
Only if the comparable drawdown and other relevant assumptions support that conclusion. Example 1 gives a 50% rate increase with no PI change; Example 2 gives the same rate increase at matched drawdown and a 50% apparent PI increase.
Can wellhead pressure replace flowing bottomhole pressure?
No direct substitution is justified. The producing column and equipment create pressure differences between surface and sandface. Use a measured or appropriately calculated bottomhole value at the selected datum. [1, pp. 583–585]
Does a higher PI prove that skin fell?
No. Skin is one influence, and its interpreted value can include permeability and completion-geometry effects. Fluid and interval changes also matter. Additional interpretation is needed to connect a productivity change to a particular cause. [1, p. 550] [3, pp. 830–831]
Should oil or total-liquid rate be used?
Use the basis required by the evaluation and label it explicitly. The cited definition uses liquid rate. Oil and total-liquid indices should not be interchanged across the two tests, especially when water contribution changes. [3, pp. 829–832]
Can the same calculation evaluate a gas well?
A gas well needs a gas-appropriate inflow or deliverability treatment. The book accounts for pressure-dependent gas properties using pseudopressure. The simple linear liquid examples are not a gas-well evaluation method. [1, pp. 549–550, 583]
Can PI fall even when the workover succeeds?
Yes, if the objective and comparison require a different conclusion—for example, the completed interval or phase contribution has changed. Evaluate the intended function and document those changes before treating one PI number as the overall job verdict. [1, pp. 586–587] [3, pp. 830–832]
Book References
- Mohamed Soliman and Michael J. Economides, Chapter 12, “Inflow Performance/Tubing Performance,” in Petroleum Well Construction, edited by Michael J. Economides, Larry Watters and Shari Dunn-Norman; John Wiley & Sons, Halliburton educational version. Visible/PDF pp. 549–550 and 582–587.
- James F. Lea and Clark E. Robison, Chapter 13, “Artificial-Lift Completions,” in Petroleum Well Construction, pp. 619–623. The ESP example supports the distinction between reservoir inflow, pump performance and pressure location; its field-design values are not used here.
- Mary Hardy and Thomas Lockhart, Chapter 17, “Water Control,” in Petroleum Well Construction, pp. 829–832, especially the productivity-index definition on p. 831. The cited visible page numbers match the physical PDF pages in the 903-page educational file.