A workover program should explain why the proposed job is worth doing, what must change in the well, and what evidence will show that the objective was achieved. An equipment list and a sequence of activities cannot answer those questions on their own. Perrin makes the cost distinction clearly: the daily price and availability of a unit must be considered alongside its capability, the duration of the operation and the result obtained. [1, p. 293]
This article follows a candidate from the initial case through a whole-job estimate, a no-action comparison and a review of uncertainty. One invented example connects production interruption, incremental barrels and payout. The workover operations guide covers the separate choice of intervention capability and whether the completion must be recovered.
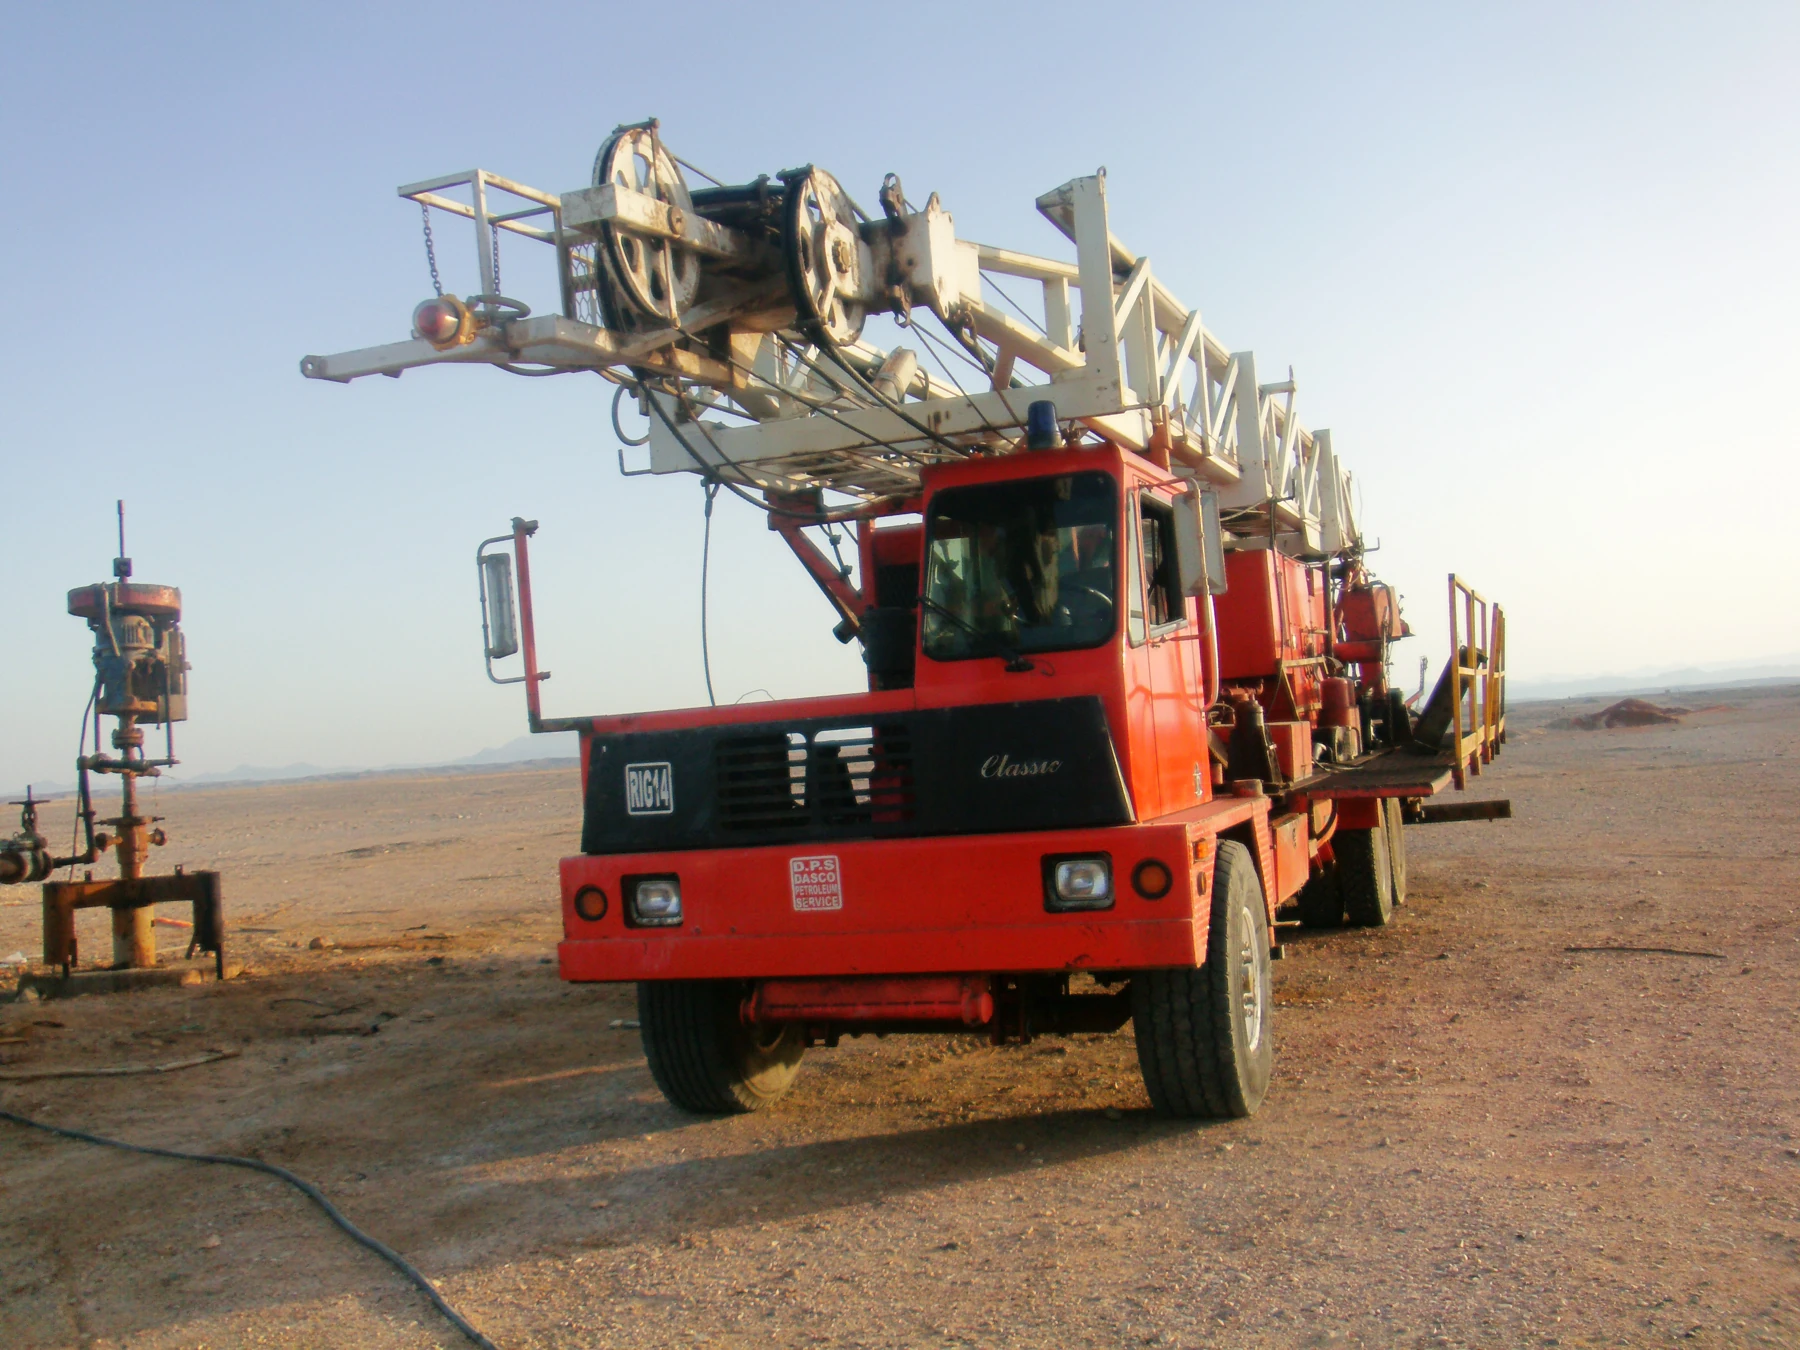

What must a workover program decide?
Start with the change required and the condition of the well today. The installed completion, depth and intended task determine the means needed to carry out the work. The replacement configuration must also suit the conditions expected after the job. A proposal based only on the original completion design can miss changes that occurred during the well’s producing life. [1, p. 293]
Then define the outcome in terms appropriate to that objective. A production opportunity needs a supported estimate of improvement. A repair may instead be justified by restoring an essential function. Water control can involve a balance between lower water-related cost and the oil contribution that might be affected. The outcome should describe the purpose of the work, rather than treating completion of an activity as proof of success. [1, p. 293] [3, pp. 828, 848–850]
For the workover program, record three separate statements: the evidence for the problem, the physical change proposed, and the result expected from that change. An uncertainty in one statement should remain visible in the others. A confidently priced operation can still be aimed at an incorrectly diagnosed problem. The water-control chapter illustrates this through the different consequences of treating the wrong water-production mechanism. [3, pp. 847–848]
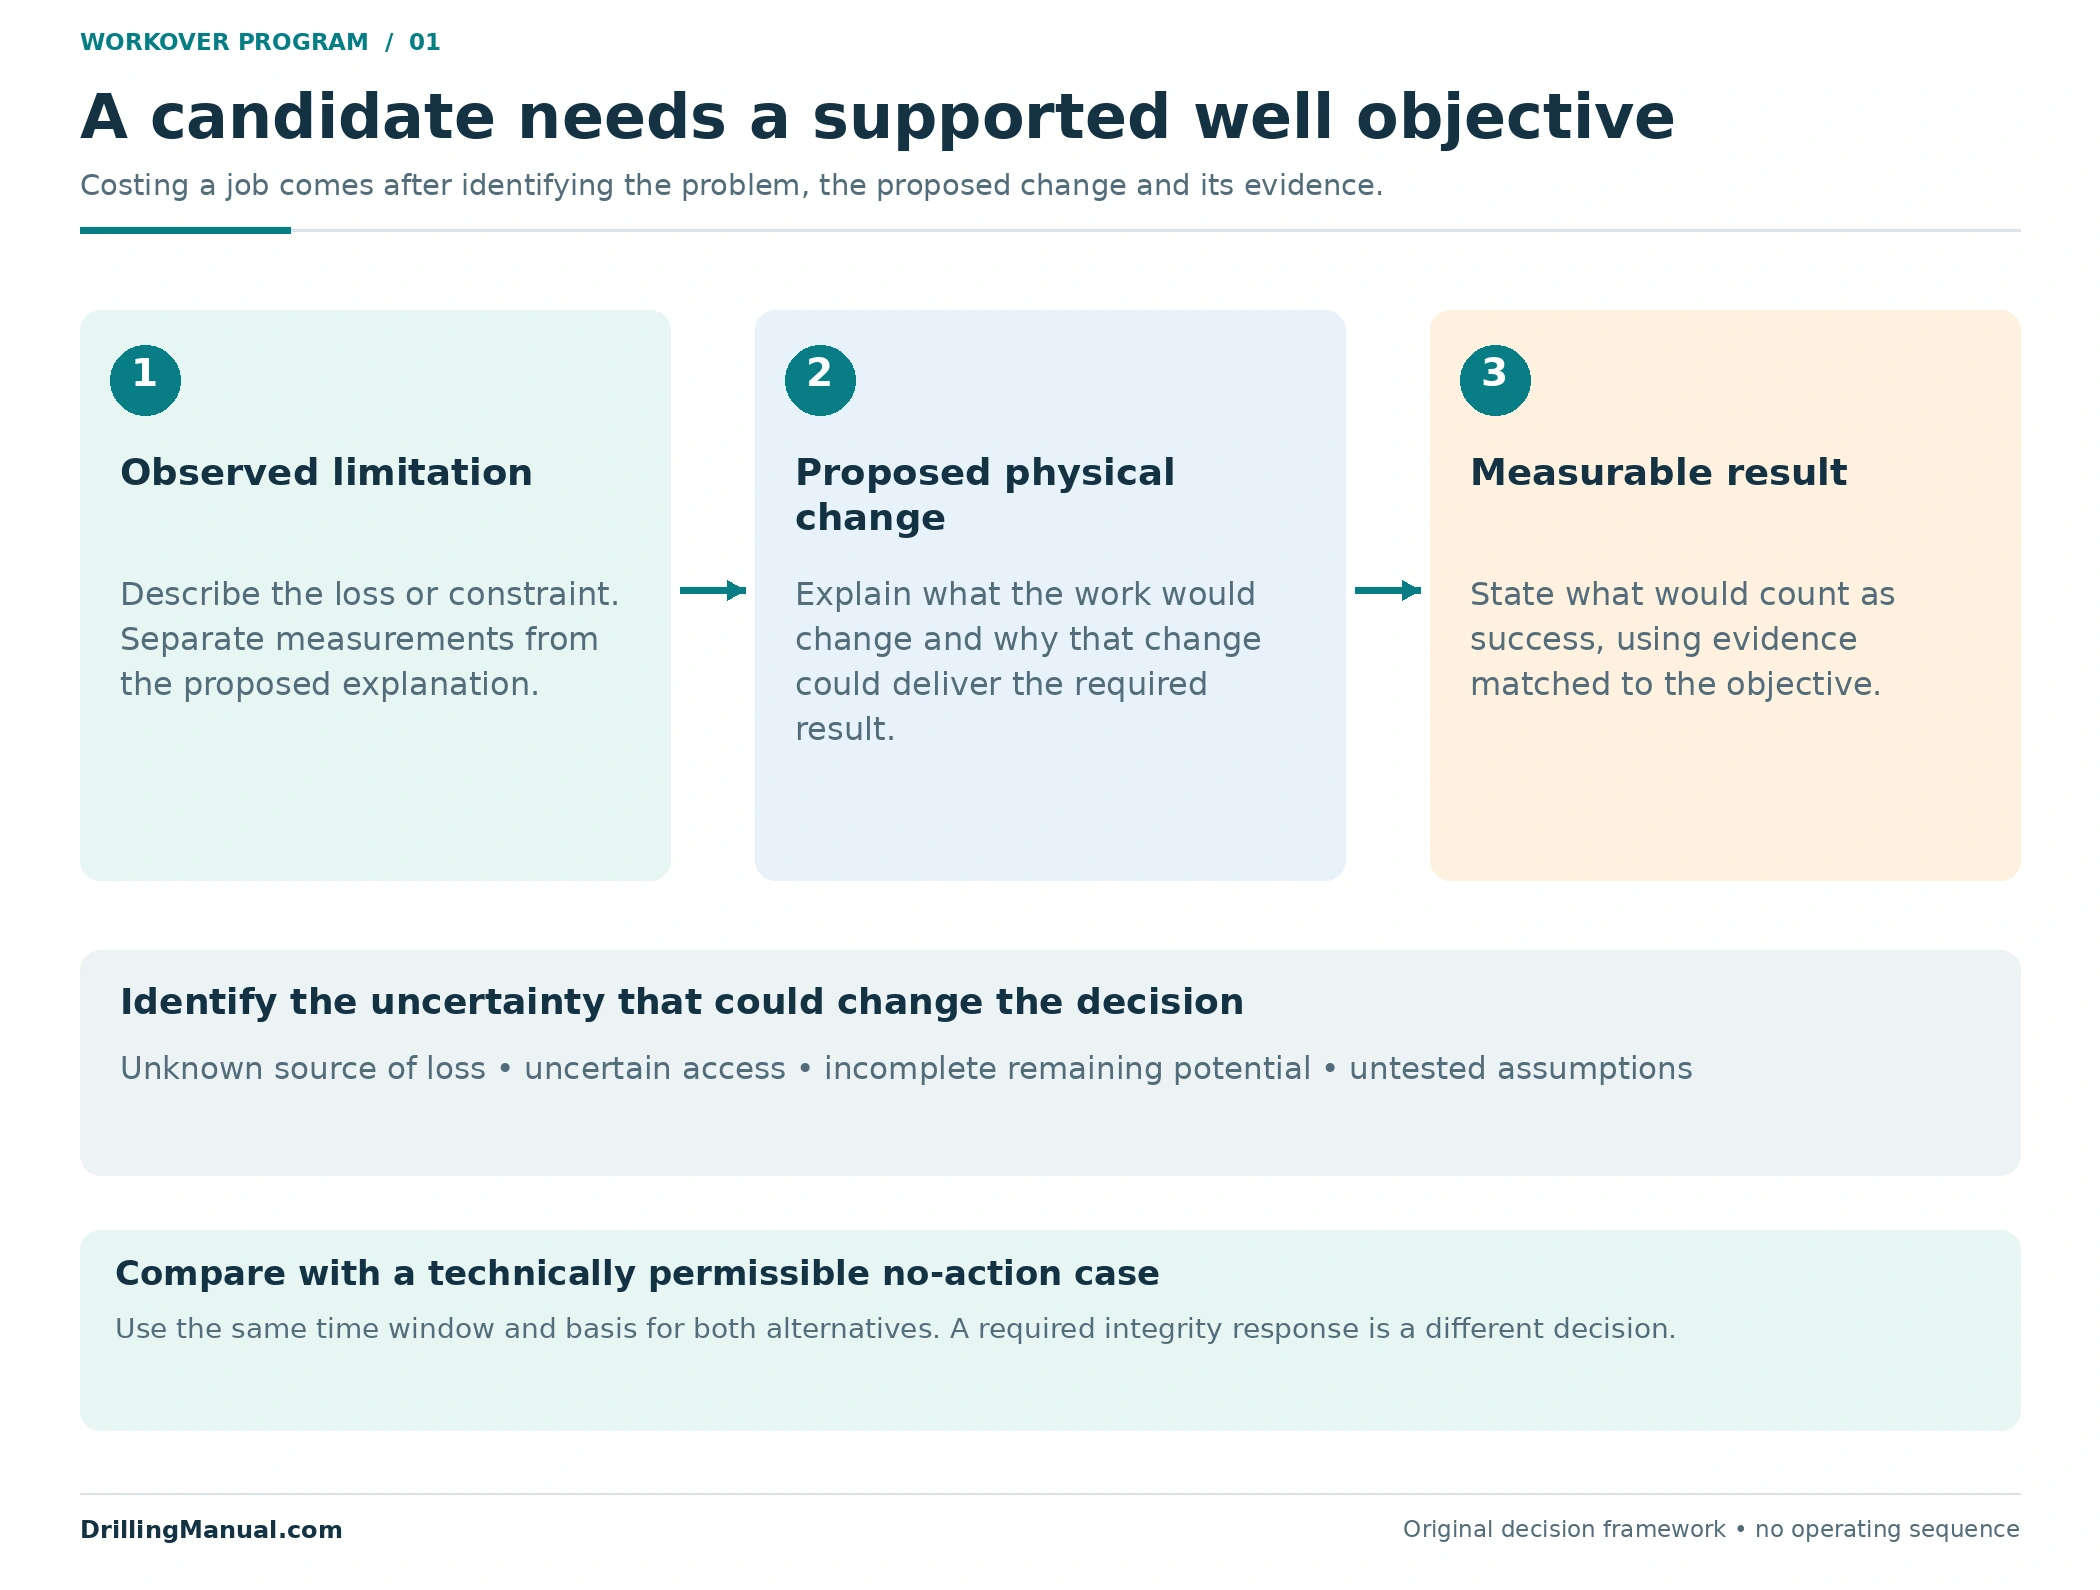
Screen the candidate before pricing the preferred solution
Separate a desirable result from an achievable one. Establish which observations support the proposed mechanism, which relevant facts are missing, and whether the intended change can address the problem. Petroleum Well Construction links successful water treatment to characterization, suitable design and effective placement. That example supports a broader planning question: what would make the proposed operation fail to deliver the benefit used to justify it? [3, pp. 847–850]
Consider credible alternatives before the preferred operation becomes the default. DeGeare’s fishing discussion describes cases where completing available reserves above an obstruction or choosing another route may be more attractive than pursuing recovery. The lesson for candidate review is to compare ways of achieving the required well objective, with the appropriate technical specialists involved. It is not a rule that one intervention method is always cheaper or more successful. [2, pp. 1–2, 5]
Keep a no-action option only where it is a technically permissible comparison. The numerical case below assumes that continued production without the proposed job is acceptable. It does not apply that assumption to a well requiring an integrity response. Likewise, a new producing interval belongs in a recompletion assessment; a candidate involving unwanted water needs its own source and treatment diagnosis. [1, p. 293] [3, pp. 847–850]
Define the no-action case and the evaluation window
The workover program needs a comparison case for any claimed production benefit. “The well will produce 140 barrels per day” does not state the improvement if it would otherwise produce 100. It also says nothing about the period spent shut in. DeGeare identifies interruption of normal operations and production as part of the economic context, while the water-control chapter requires realistic post-treatment expectations. [2, pp. 2, 5] [3, pp. 848–850]
For an original teaching case, assume a well could continue at 100 barrels of oil per day throughout a 180-calendar-day window. A proposed intervention would shut it in for 10 days, followed by 140 barrels per day for the remaining 170 days. Both paths begin on the same date. Constant rates, immediate restart at the assumed rate and no other interruptions are simplifying assumptions, not a field forecast.
The no-action production is 18,000 barrels: 100 × 180. Production with the intervention is 23,800 barrels: 140 × 170. Comparing them gives 5,800 incremental barrels within the stated window. These numbers describe a timing comparison; they do not establish additional ultimate recovery. Oil unavailable during the shutdown may be deferred to a later period rather than permanently lost.
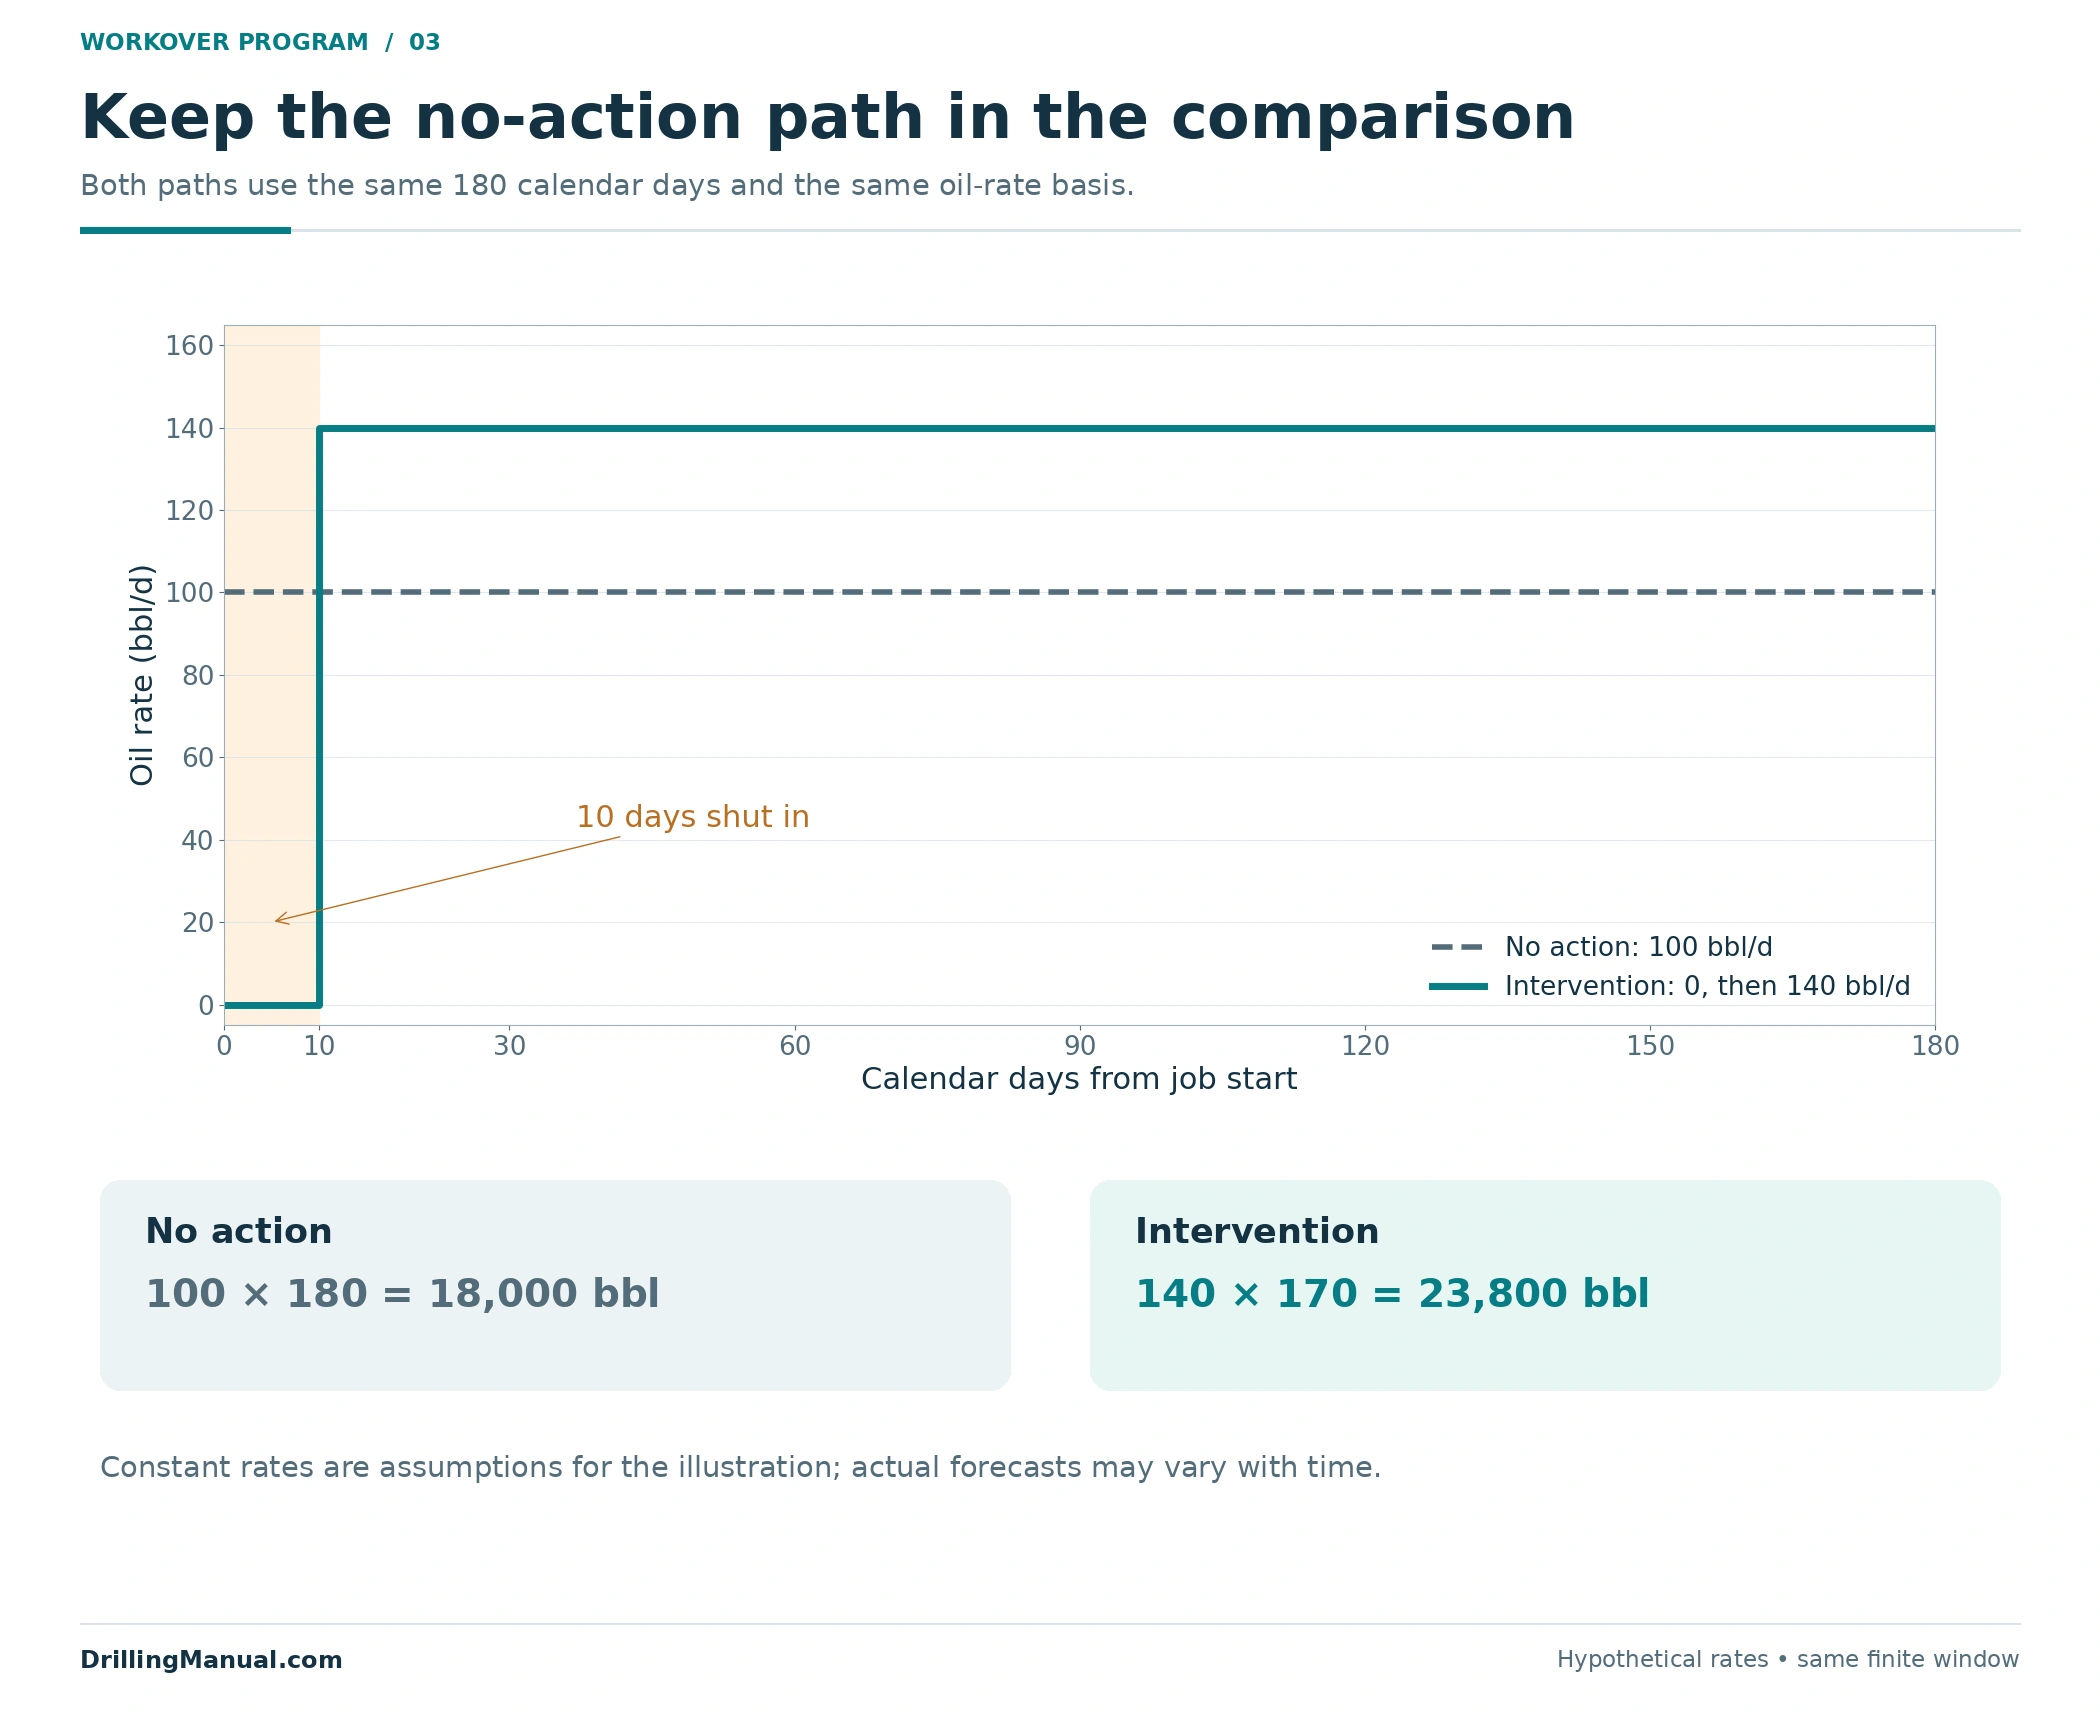
In a real candidate case, the two production paths may decline differently and the new result may take time to develop. The available information must support those assumptions. A treatment’s expected life also matters: the water-control source explicitly relates useful treatment life to recovery of its cost. Extending a favorable early rate indefinitely would create a benefit unsupported by that evidence. [3, pp. 848–850]
A workover program should identify who supplied each forecast and the conditions under which it applies. A whole-well production history, an estimate for one interval and a post-treatment expectation are different inputs. State how they have been connected rather than allowing a single attractive rate to represent all three. The water-control example is particularly instructive because shutting one interval changes the context in which the remaining intervals produce. That response belongs in the forecast before the benefit is priced. [3, pp. 848–849]
Build a whole-job workover program budget
Price the complete scope that leads to the defined outcome. Perrin’s comparison of unit cost with overall duration and results supports this wider view. DeGeare adds the need to plan contingencies and assess the alternatives with the people who understand the well and recovery problem. Neither source supplies a universal cost per day or a standard allowance suitable for every job. [1, p. 293] [2, pp. 1, 3–5]
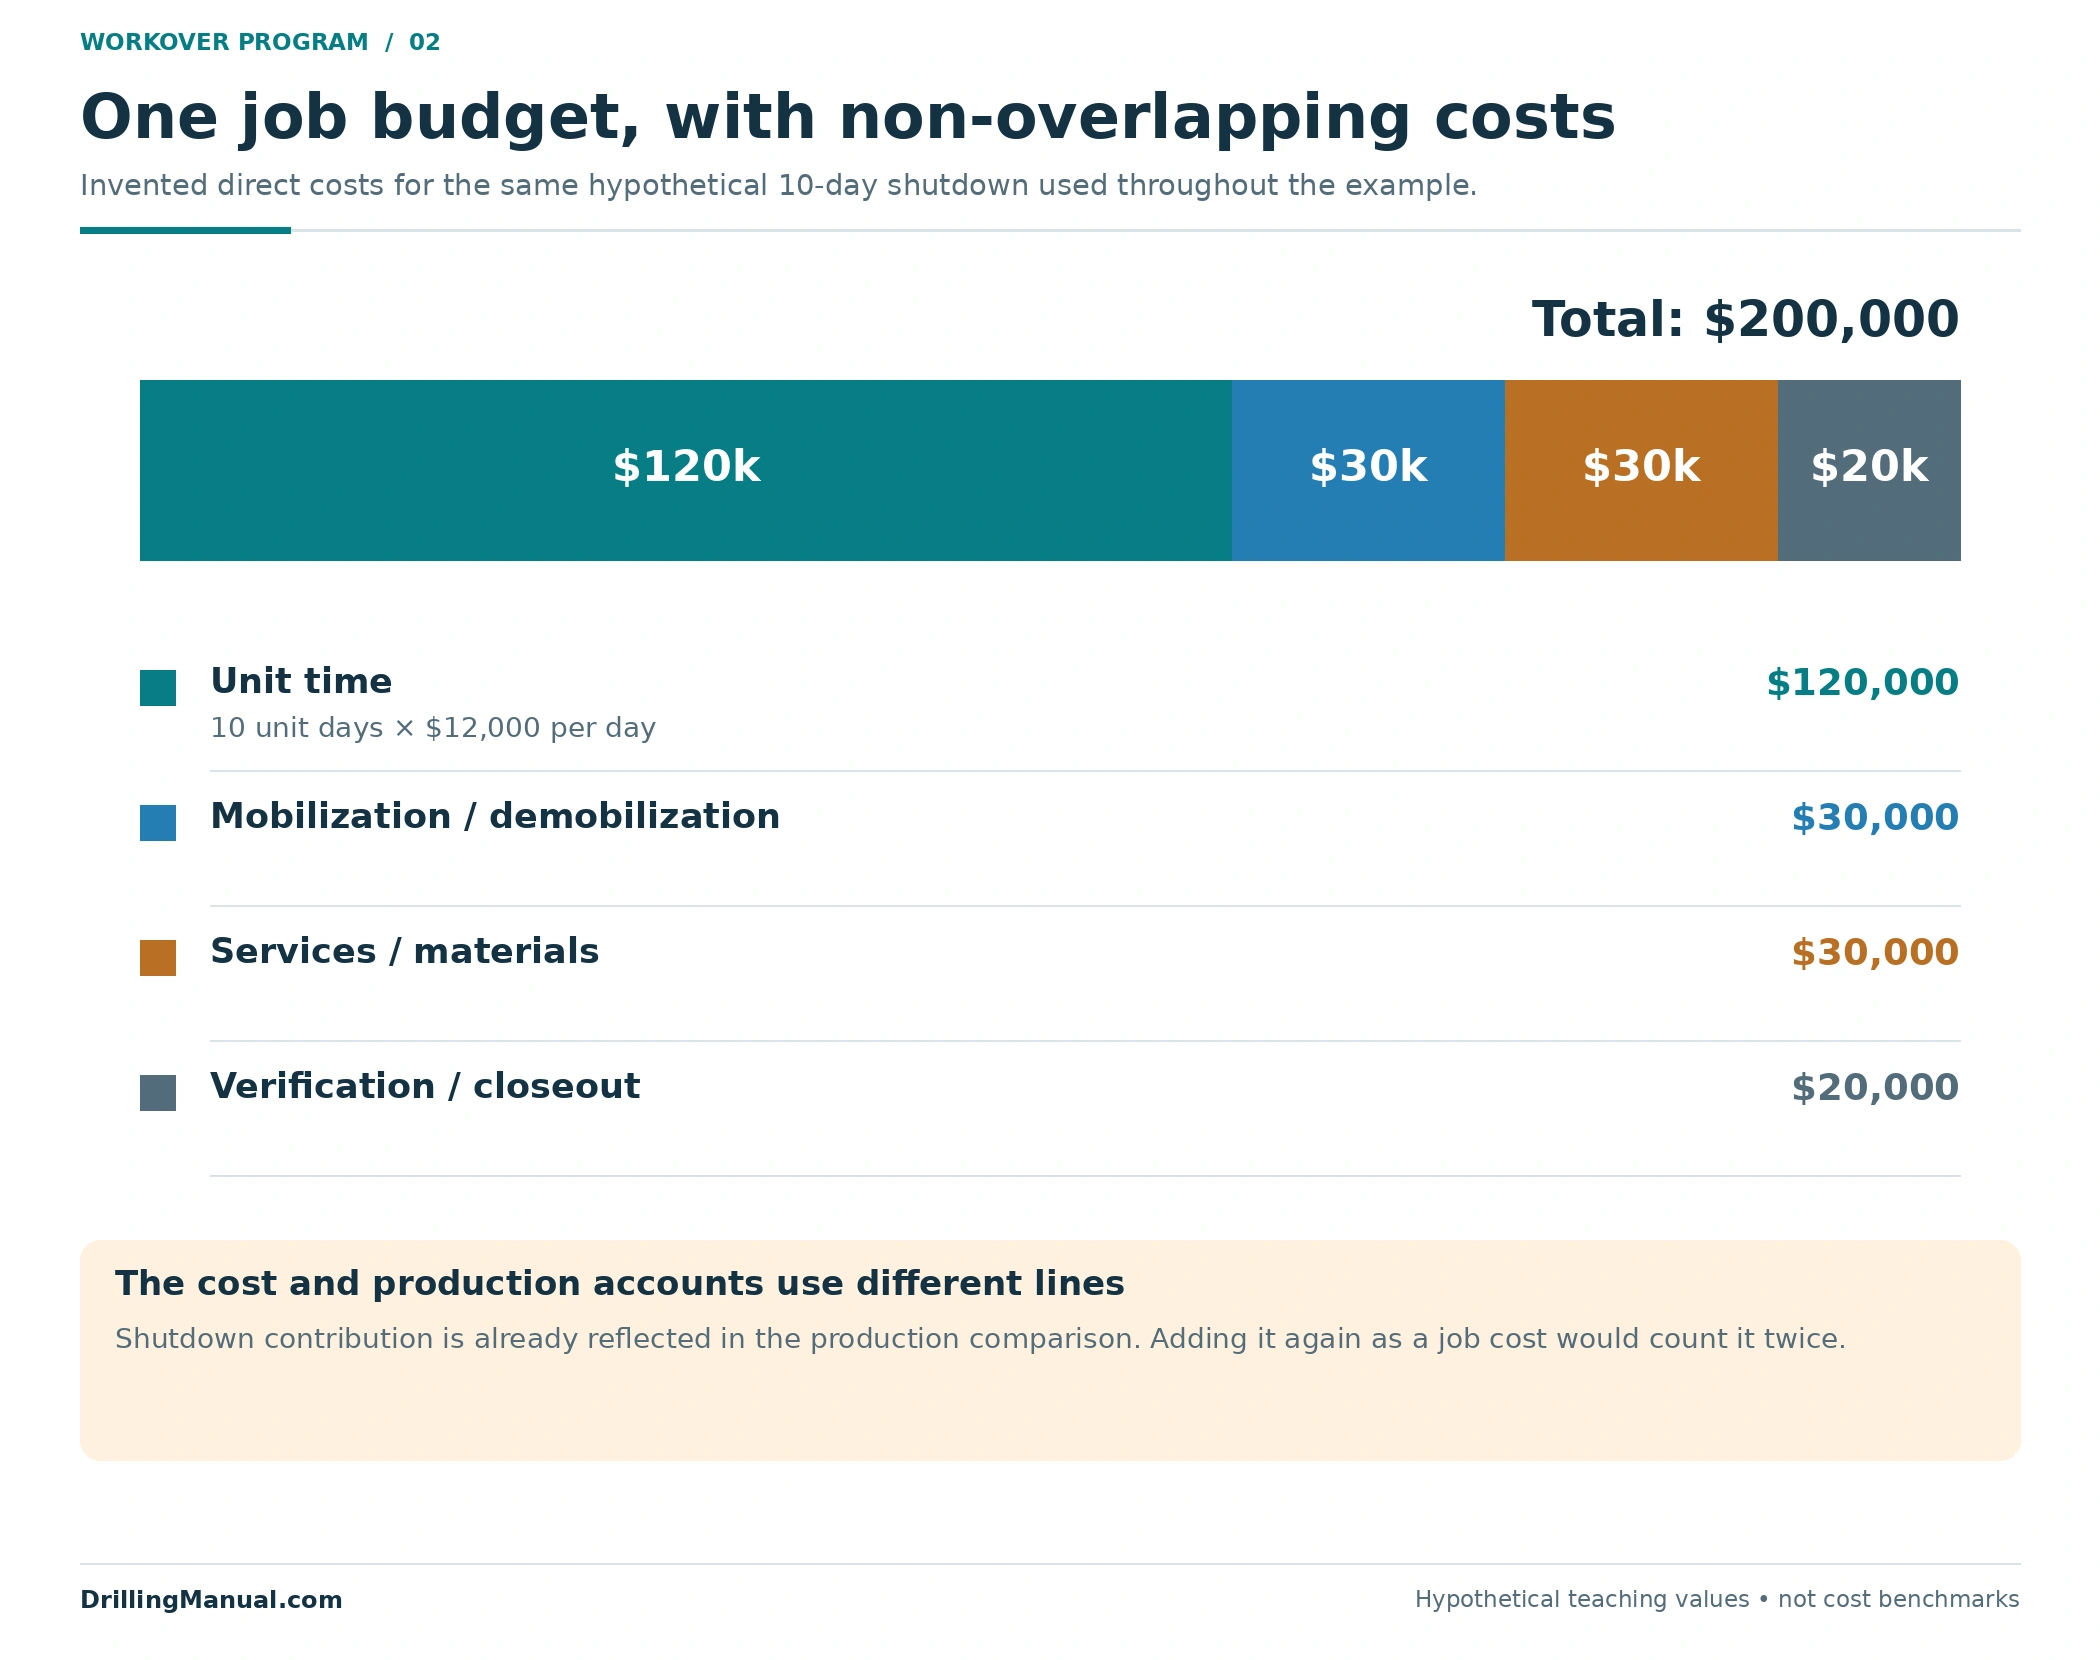
The following budget belongs only to the invented case. Categories are assumed to be nonoverlapping: services already included in one line are not charged again in another. The ten unit days are also the ten shutdown days in this simplified example; that equality must not be assumed for an actual quotation.
| Invented cost component | Assumed amount | Basis in the example |
|---|---|---|
| Unit time | $120,000 | $12,000 per day × 10 days |
| Mobilization and demobilization | $30,000 | One stated allowance |
| Specialist services and materials | $30,000 | Items outside the unit charge |
| Verification and closeout | $20,000 | Included in the evaluated job scope |
| Total direct job cost | $200,000 | Sum of the four distinct components |
Retain the duration assumptions behind each charge. An additional trip can add time, services and another opportunity for difficulty; DeGeare emphasizes useful progress on each trip and advance agreement on contingencies. A cost line without its corresponding scope cannot show what changes when the operation departs from the initial plan. [2, pp. 3–5]
Keep the accounting convention consistent throughout the workover program. In this example, the $200,000 is direct expenditure only; production interruption is accounted for through the difference between the two production paths. Adding the same $40,000 of shutdown contribution to the budget and subtracting it again in the production comparison would double-count it. Other accounting presentations are possible, but the categories must reconcile to the same stated comparison. This is a bookkeeping property of the example, not a claim about an operator’s accounting policy.
Workover program example: count the shutdown as well as the uplift
The post-restart uplift is 40 barrels per day: 140 minus the 100-barrel baseline. Across 170 producing days, that adds 6,800 barrels. However, the intervention path also misses the 1,000 barrels that the baseline would have produced during the ten-day shutdown. Therefore, 6,800 − 1,000 = 5,800 incremental barrels, agreeing with the direct comparison of the two cumulative totals.
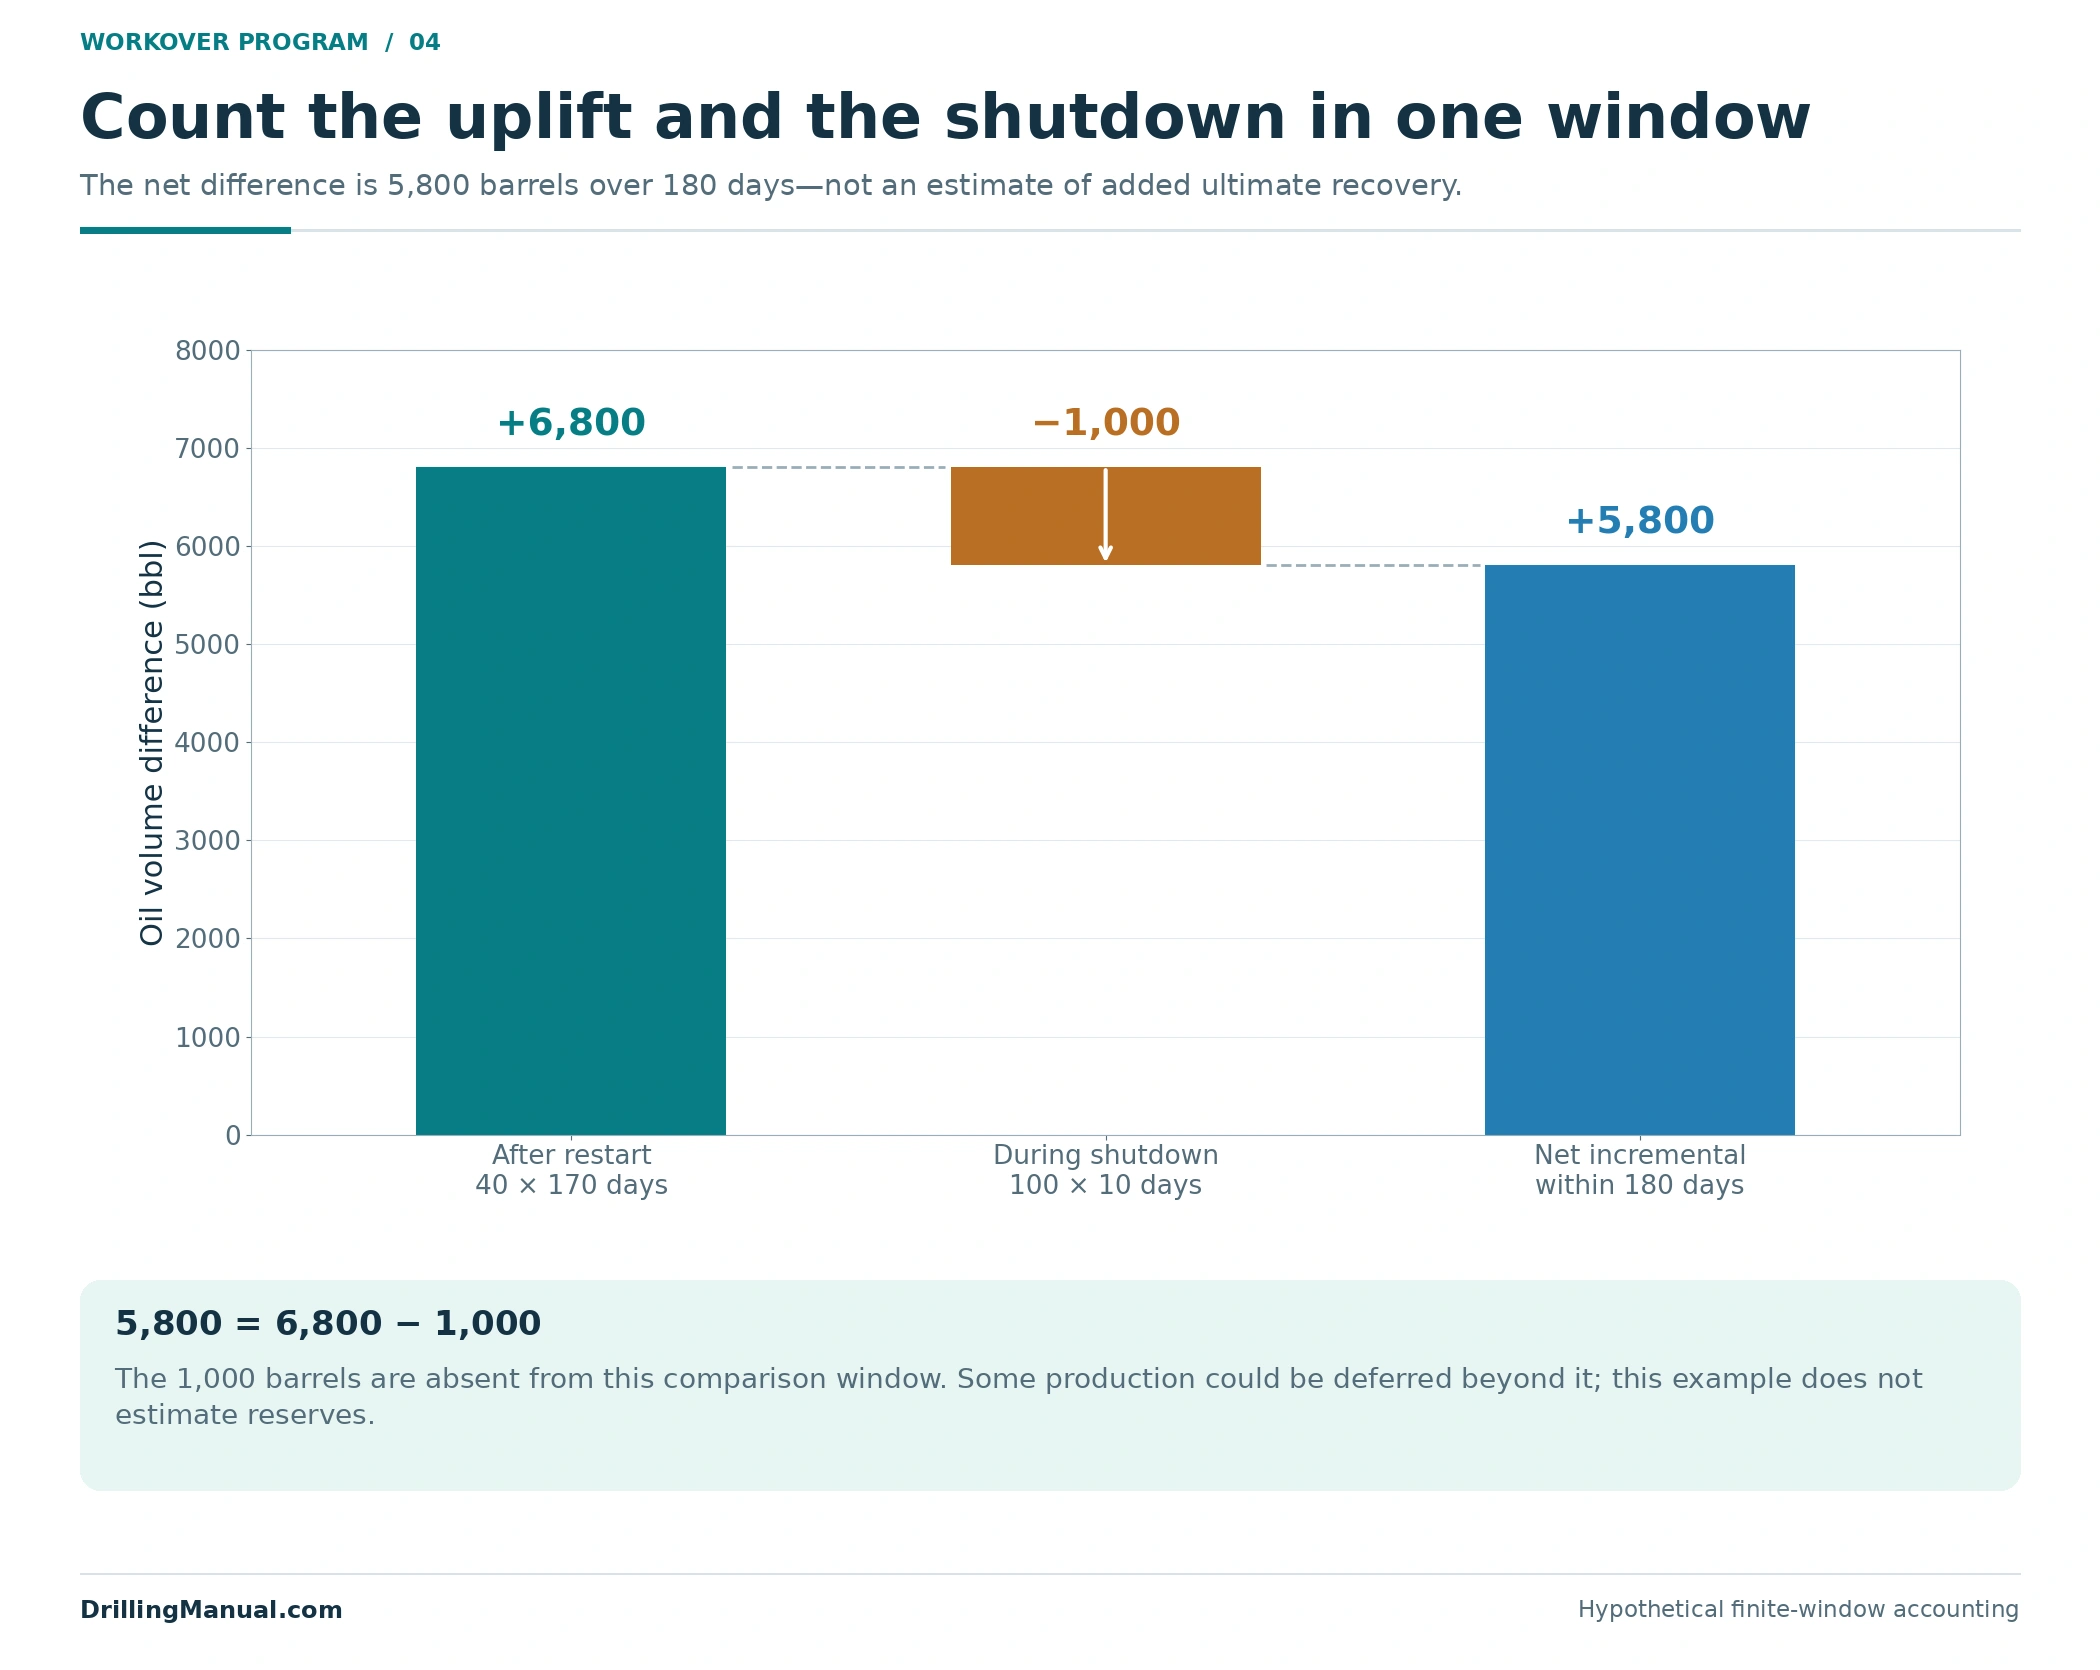
Now assume a constant contribution margin of $40 per barrel after variable production costs, applying equally to both production paths. This invented margin is not an oil-price assumption or an industry benchmark. The extra operating contribution is 5,800 × $40 = $232,000. After the $200,000 job cost, the difference over the 180-day window is +$32,000.
This is an undiscounted teaching calculation, not a complete investment model. It omits tax, financing and changes in fixed costs. It also assumes that the margin adequately represents the relevant variable costs. Where water rates change, lifting, handling and disposal costs may need separate treatment; the source identifies these as part of the water-production economics. A higher oil rate does not automatically preserve the same cost per barrel. [3, p. 828]
The workover program should distinguish its production forecast from the result later measured. If the stated objective is improved inflow, the productivity-index discussion addresses the additional pressure basis needed to assess that claim. The accounting above assumes its rates; it does not prove the reservoir or completion can deliver them.
State where the payout clock starts
In the same example, assume the entire $200,000 job cost is recognized at the start for plotting purposes. During shutdown, the baseline earns 100 × $40 = $4,000 per day while the intervention path earns nothing. At restart, the cumulative difference is therefore −$240,000: the job cost plus $40,000 of baseline contribution forgone during those ten days.
After restart, the assumed incremental contribution is 40 × $40 = $1,600 per day. Recovering $240,000 takes 150 producing days. The cumulative difference reaches zero 160 days after the job began: ten shutdown days plus 150 days after restart. The positive $32,000 at day 180 is the remaining twenty days at $1,600 per day.
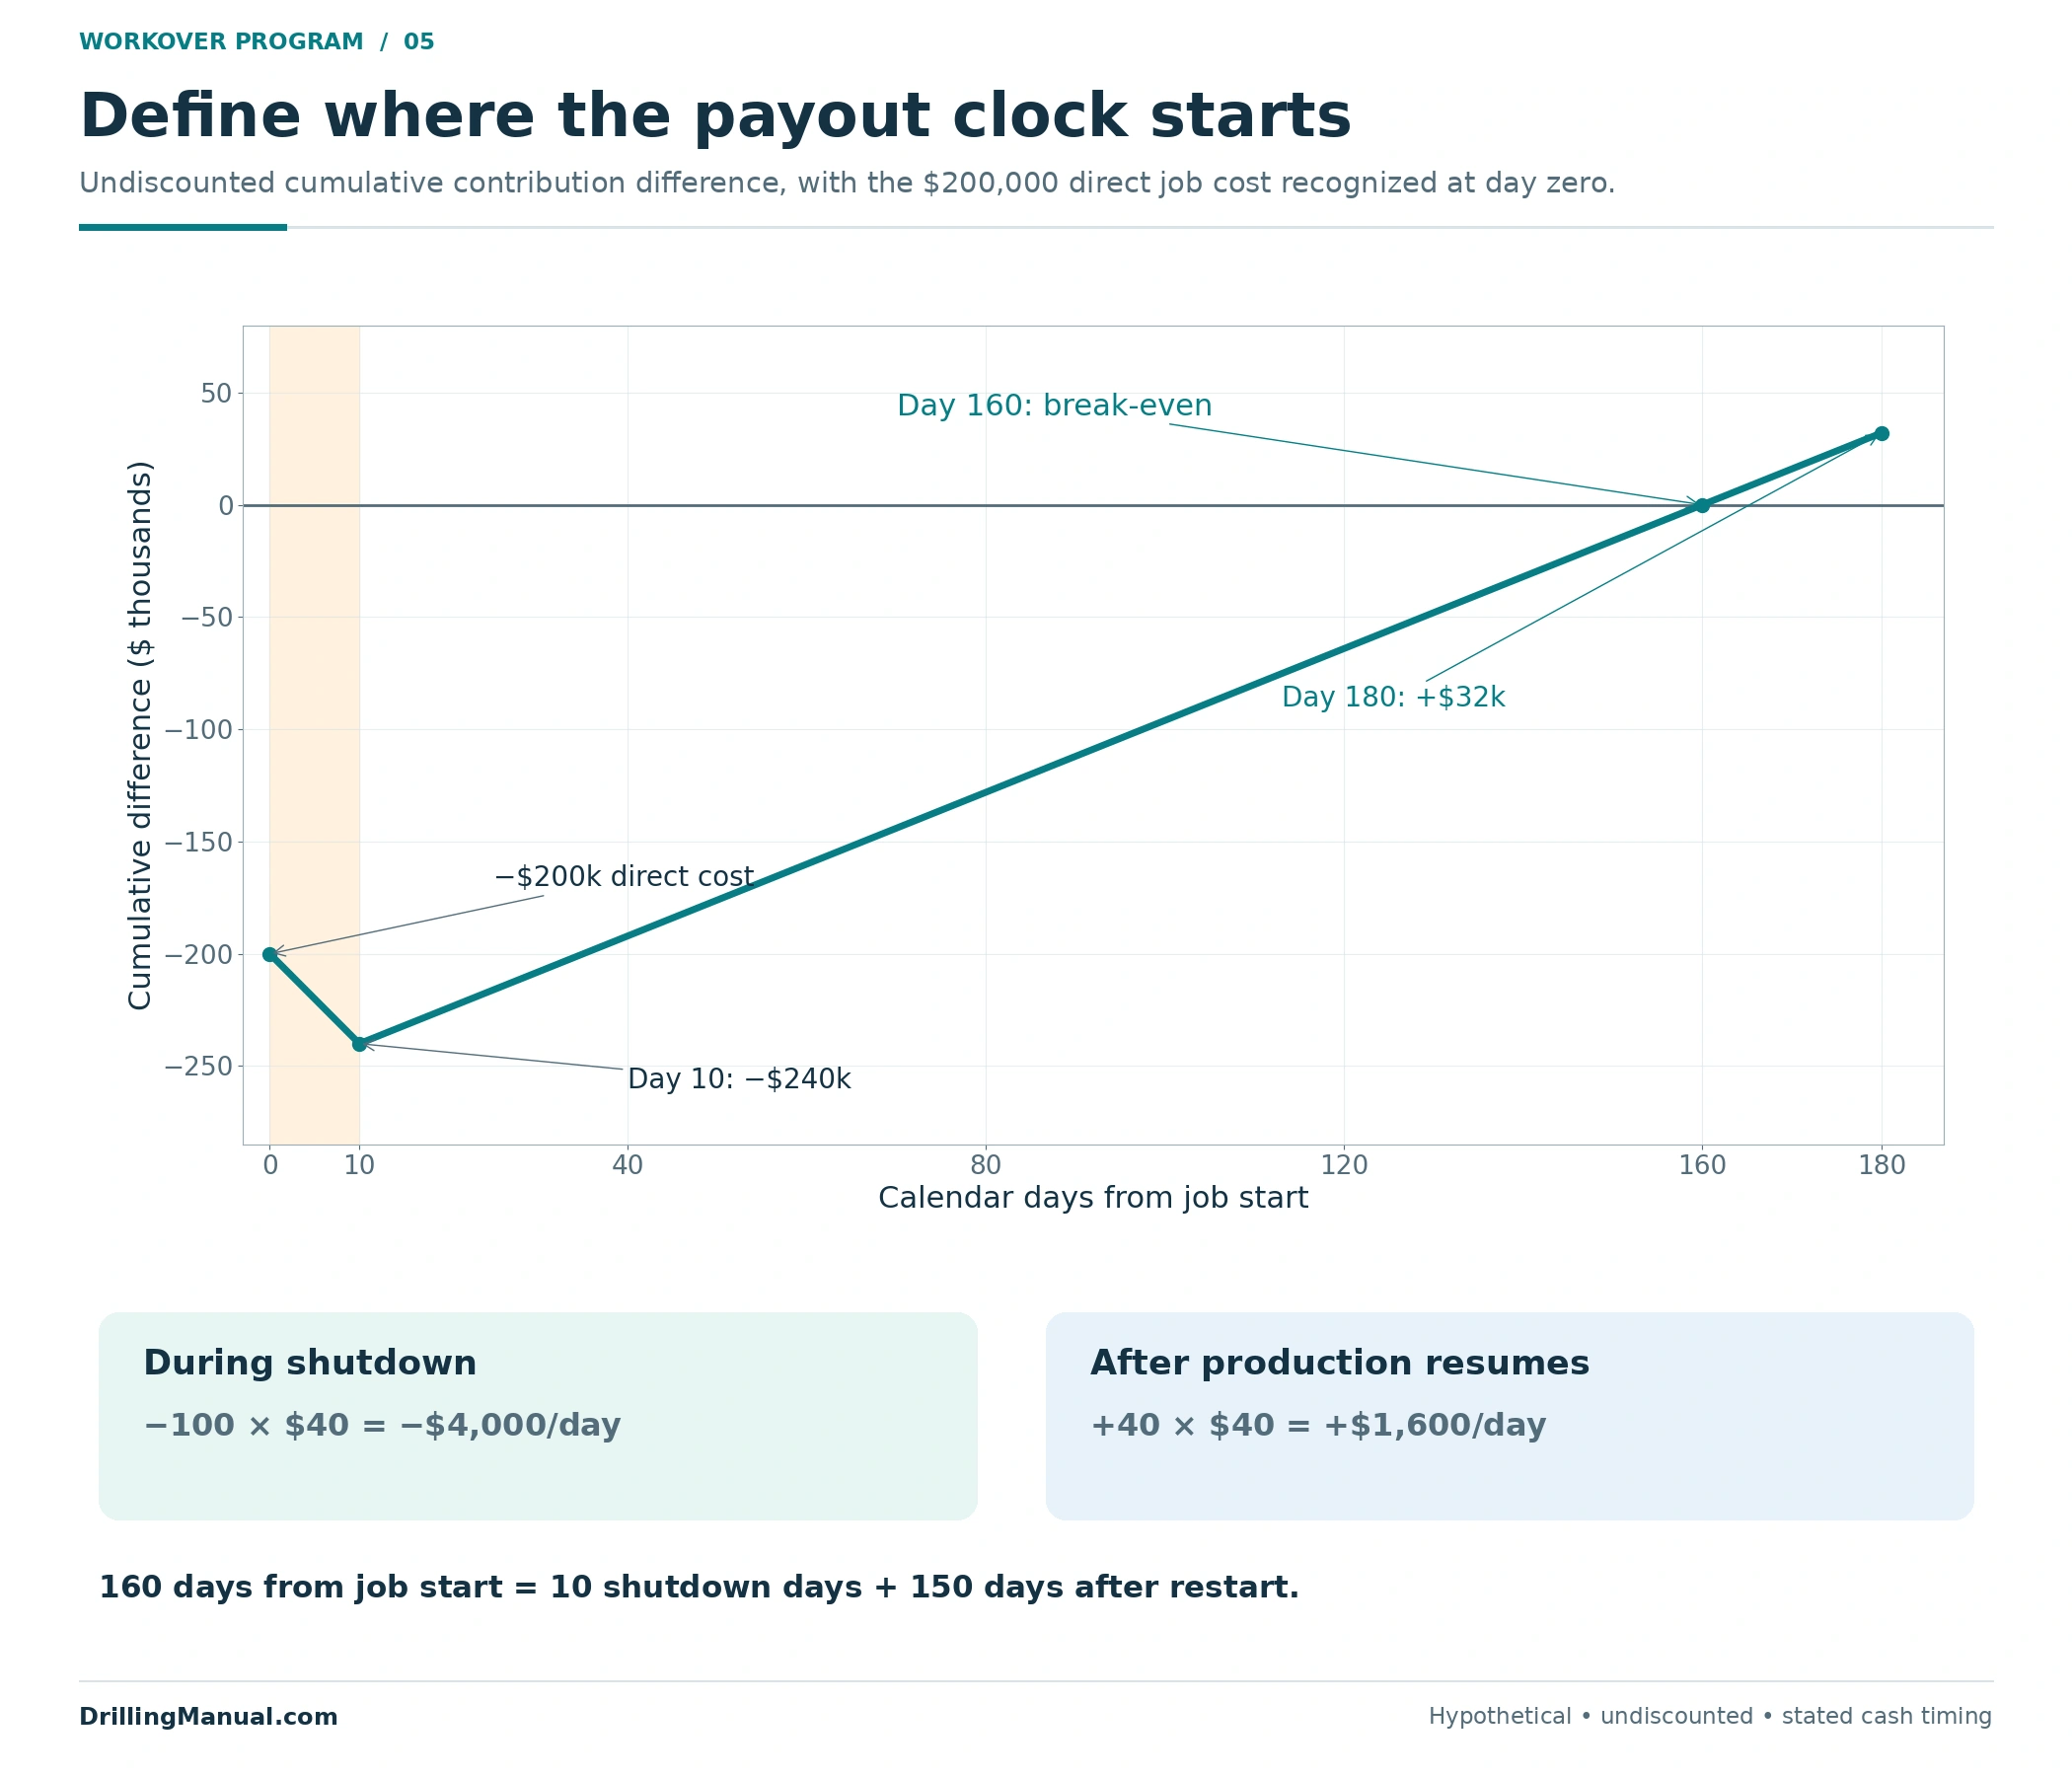
Dividing $200,000 by $1,600 gives 125 days, but that calculation omits the shutdown baseline contribution and uses a different comparison. A payout statement is incomplete unless its cost basis, production assumptions and time origin are stated. Neither calculation estimates ultimate recovery, and neither is a substitute for evaluating the downside or the well’s technical suitability.
Expose uncertainty in the workover program
The base case is one possible outcome. DeGeare discusses probabilities informed by comparable situations and costed decision trees, while cautioning that no two fishing jobs are identical. For a workover program, this supports making the uncertainty visible rather than assigning an unexplained success percentage to a preferred solution. [2, pp. 1, 5]
Consider three mutually exclusive teaching outcomes using the same shutdown, budget, margin and window. The probabilities are invented and sum to 100%. In the no-uplift case the well returns to its baseline rate; more severe outcomes, including additional damage or expenditure, are not modeled here.
| Invented outcome | Rate after restart | Assumed probability | 180-day difference after job cost |
|---|---|---|---|
| No uplift | 100 barrels/day | 20% | −$240,000 |
| Base result | 140 barrels/day | 50% | +$32,000 |
| Higher result | 160 barrels/day | 30% | +$168,000 |
The probability-weighted difference is 0.20 × (−$240,000) + 0.50 × $32,000 + 0.30 × $168,000 = +$18,400. That average is smaller than the base result and is not an outcome guaranteed for this well. It does not remove the large negative branch or justify the invented probabilities.
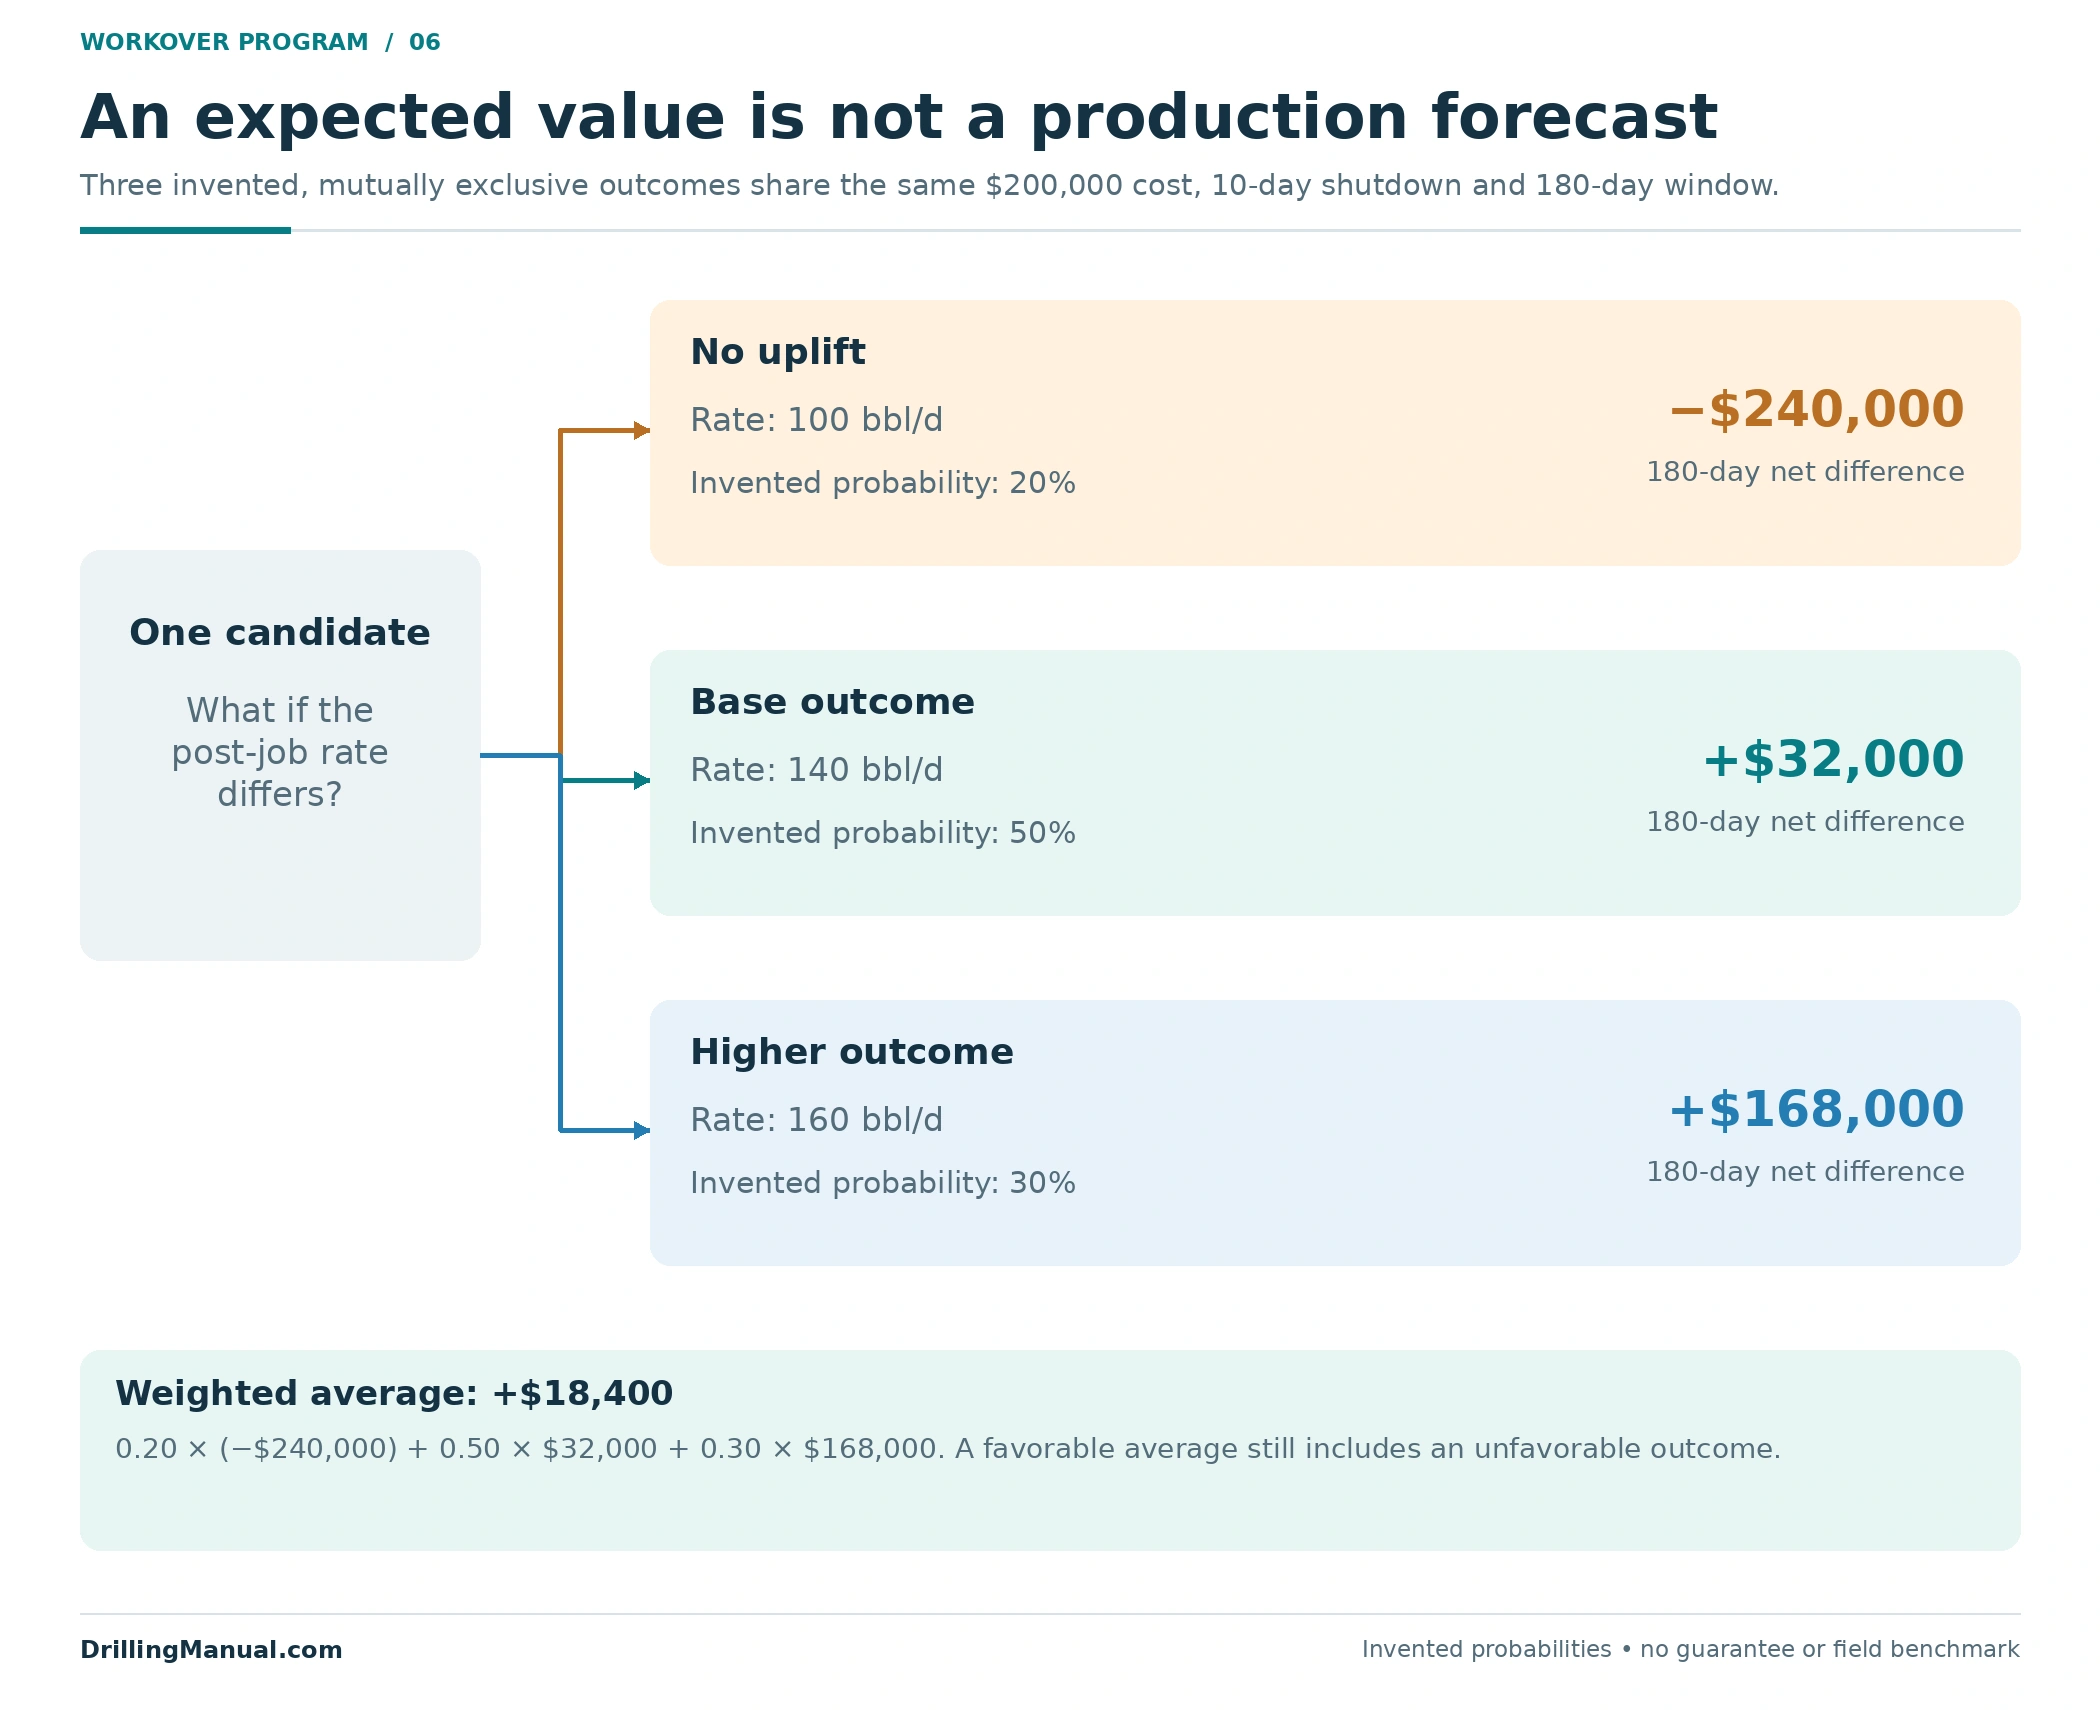
Change one assumption: if the all-in job estimate rises to $250,000, with the other assumptions held fixed, every branch loses another $50,000. The weighted difference becomes −$31,600. This sensitivity identifies a reason to revisit the candidate case. It does not establish an automatic operating stop point or an acceptable probability for a real well.
For an actual workover program, build internally consistent scenarios. A difficult recovery may change the time, remaining scope and expected result together; holding all but the final rate fixed is only a teaching simplification here. The same applies to contingency charges: include them in the scenarios where they occur and explain whether a quoted allowance is already included elsewhere. DeGeare’s discussion links the problem’s scope and duration with its economic impact, and calls for considering the alternative ways of returning the well to its intended function. [2, pp. 3–5]
Use information that can change the decision
List the unknowns that distinguish credible options. Petroleum Well Construction compares the cost of additional diagnostic information with the consequences of selecting a treatment for the wrong mechanism. The additional information is useful when it can alter the choice, design, expected outcome or uncertainty; collecting another measurement does not automatically resolve the important question. [3, pp. 847–848]

For example, a proposal may need evidence about the target interval’s contribution rather than another whole-well rate. If isolation affects a producing interval, potential oil sacrifice and the response of the remaining intervals belong in the benefit estimate. The water-control source cautions that the target can still contain mobile oil and that the rest of the well may respond differently after treatment. [3, pp. 848–850]
Preserve the planning assumptions that other disciplines must use. Current equipment dimensions, the expected configuration and the contingency arrangements need a shared, accurate record. DeGeare emphasizes communication and independent attention to equipment details. The separate workover-fluid selection article develops one of those technical design inputs without turning this candidate review into a fluid recipe. [2, pp. 3–4]
Write stop and review criteria into the workover program
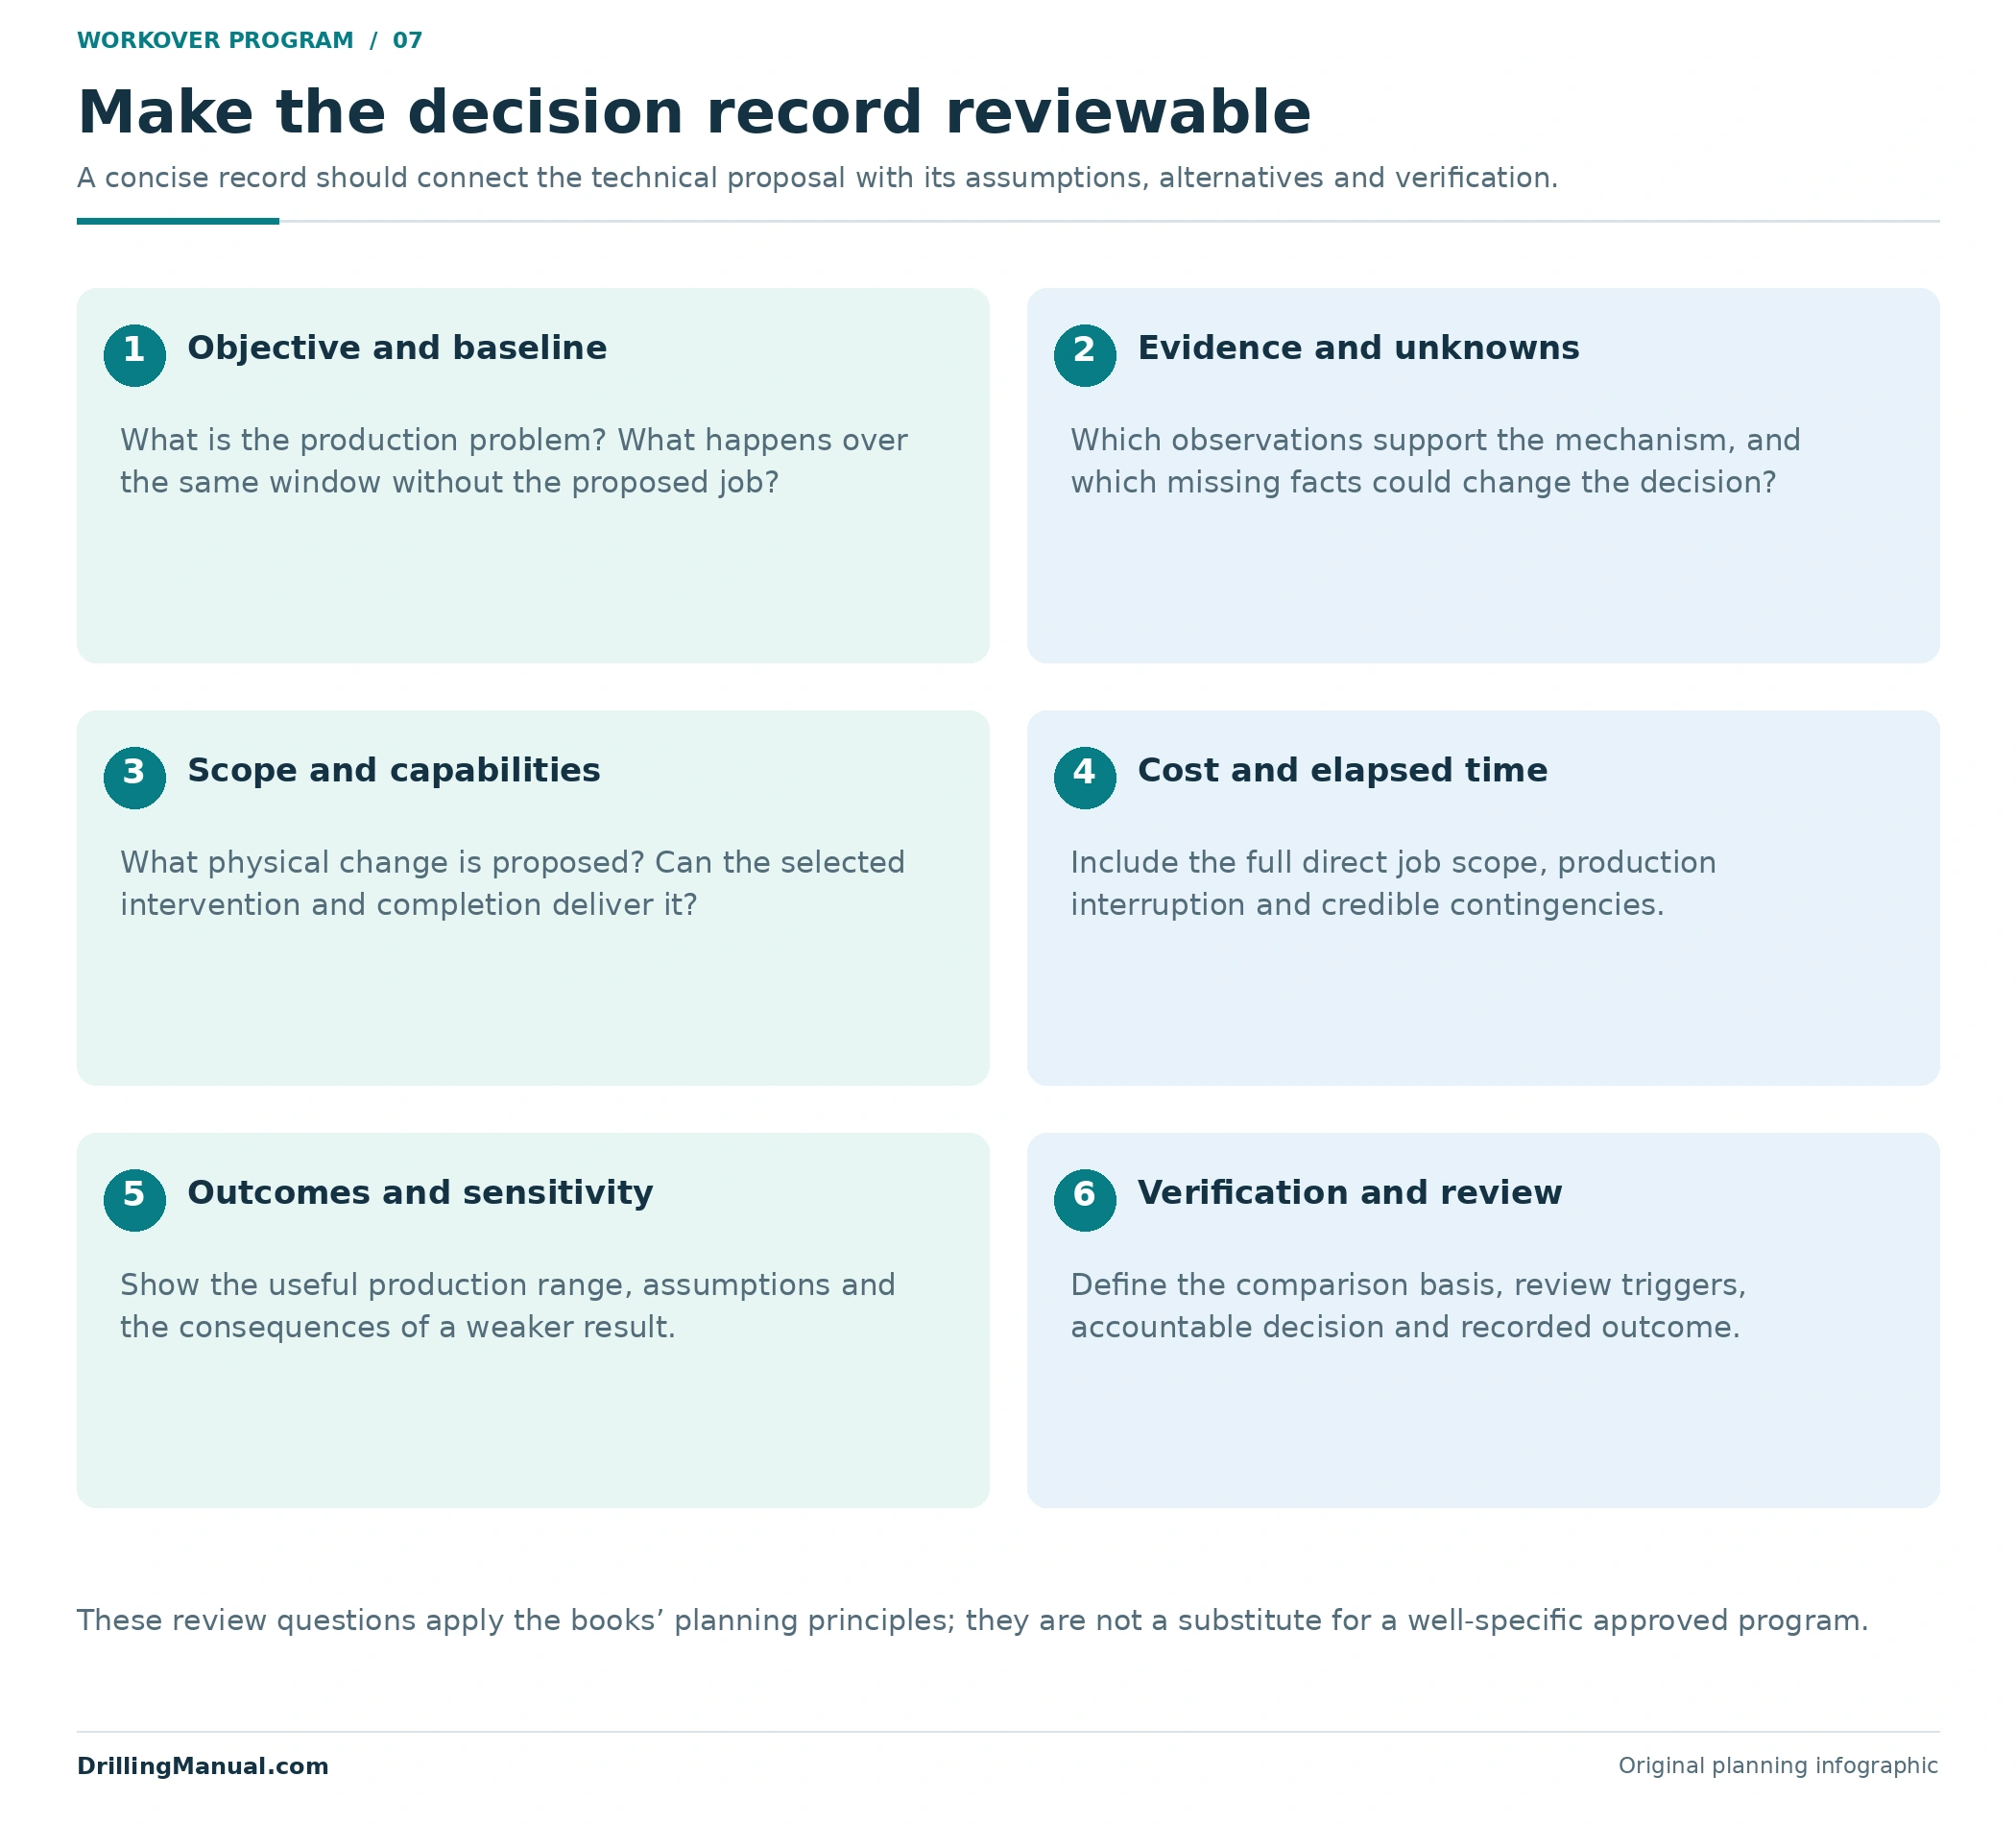
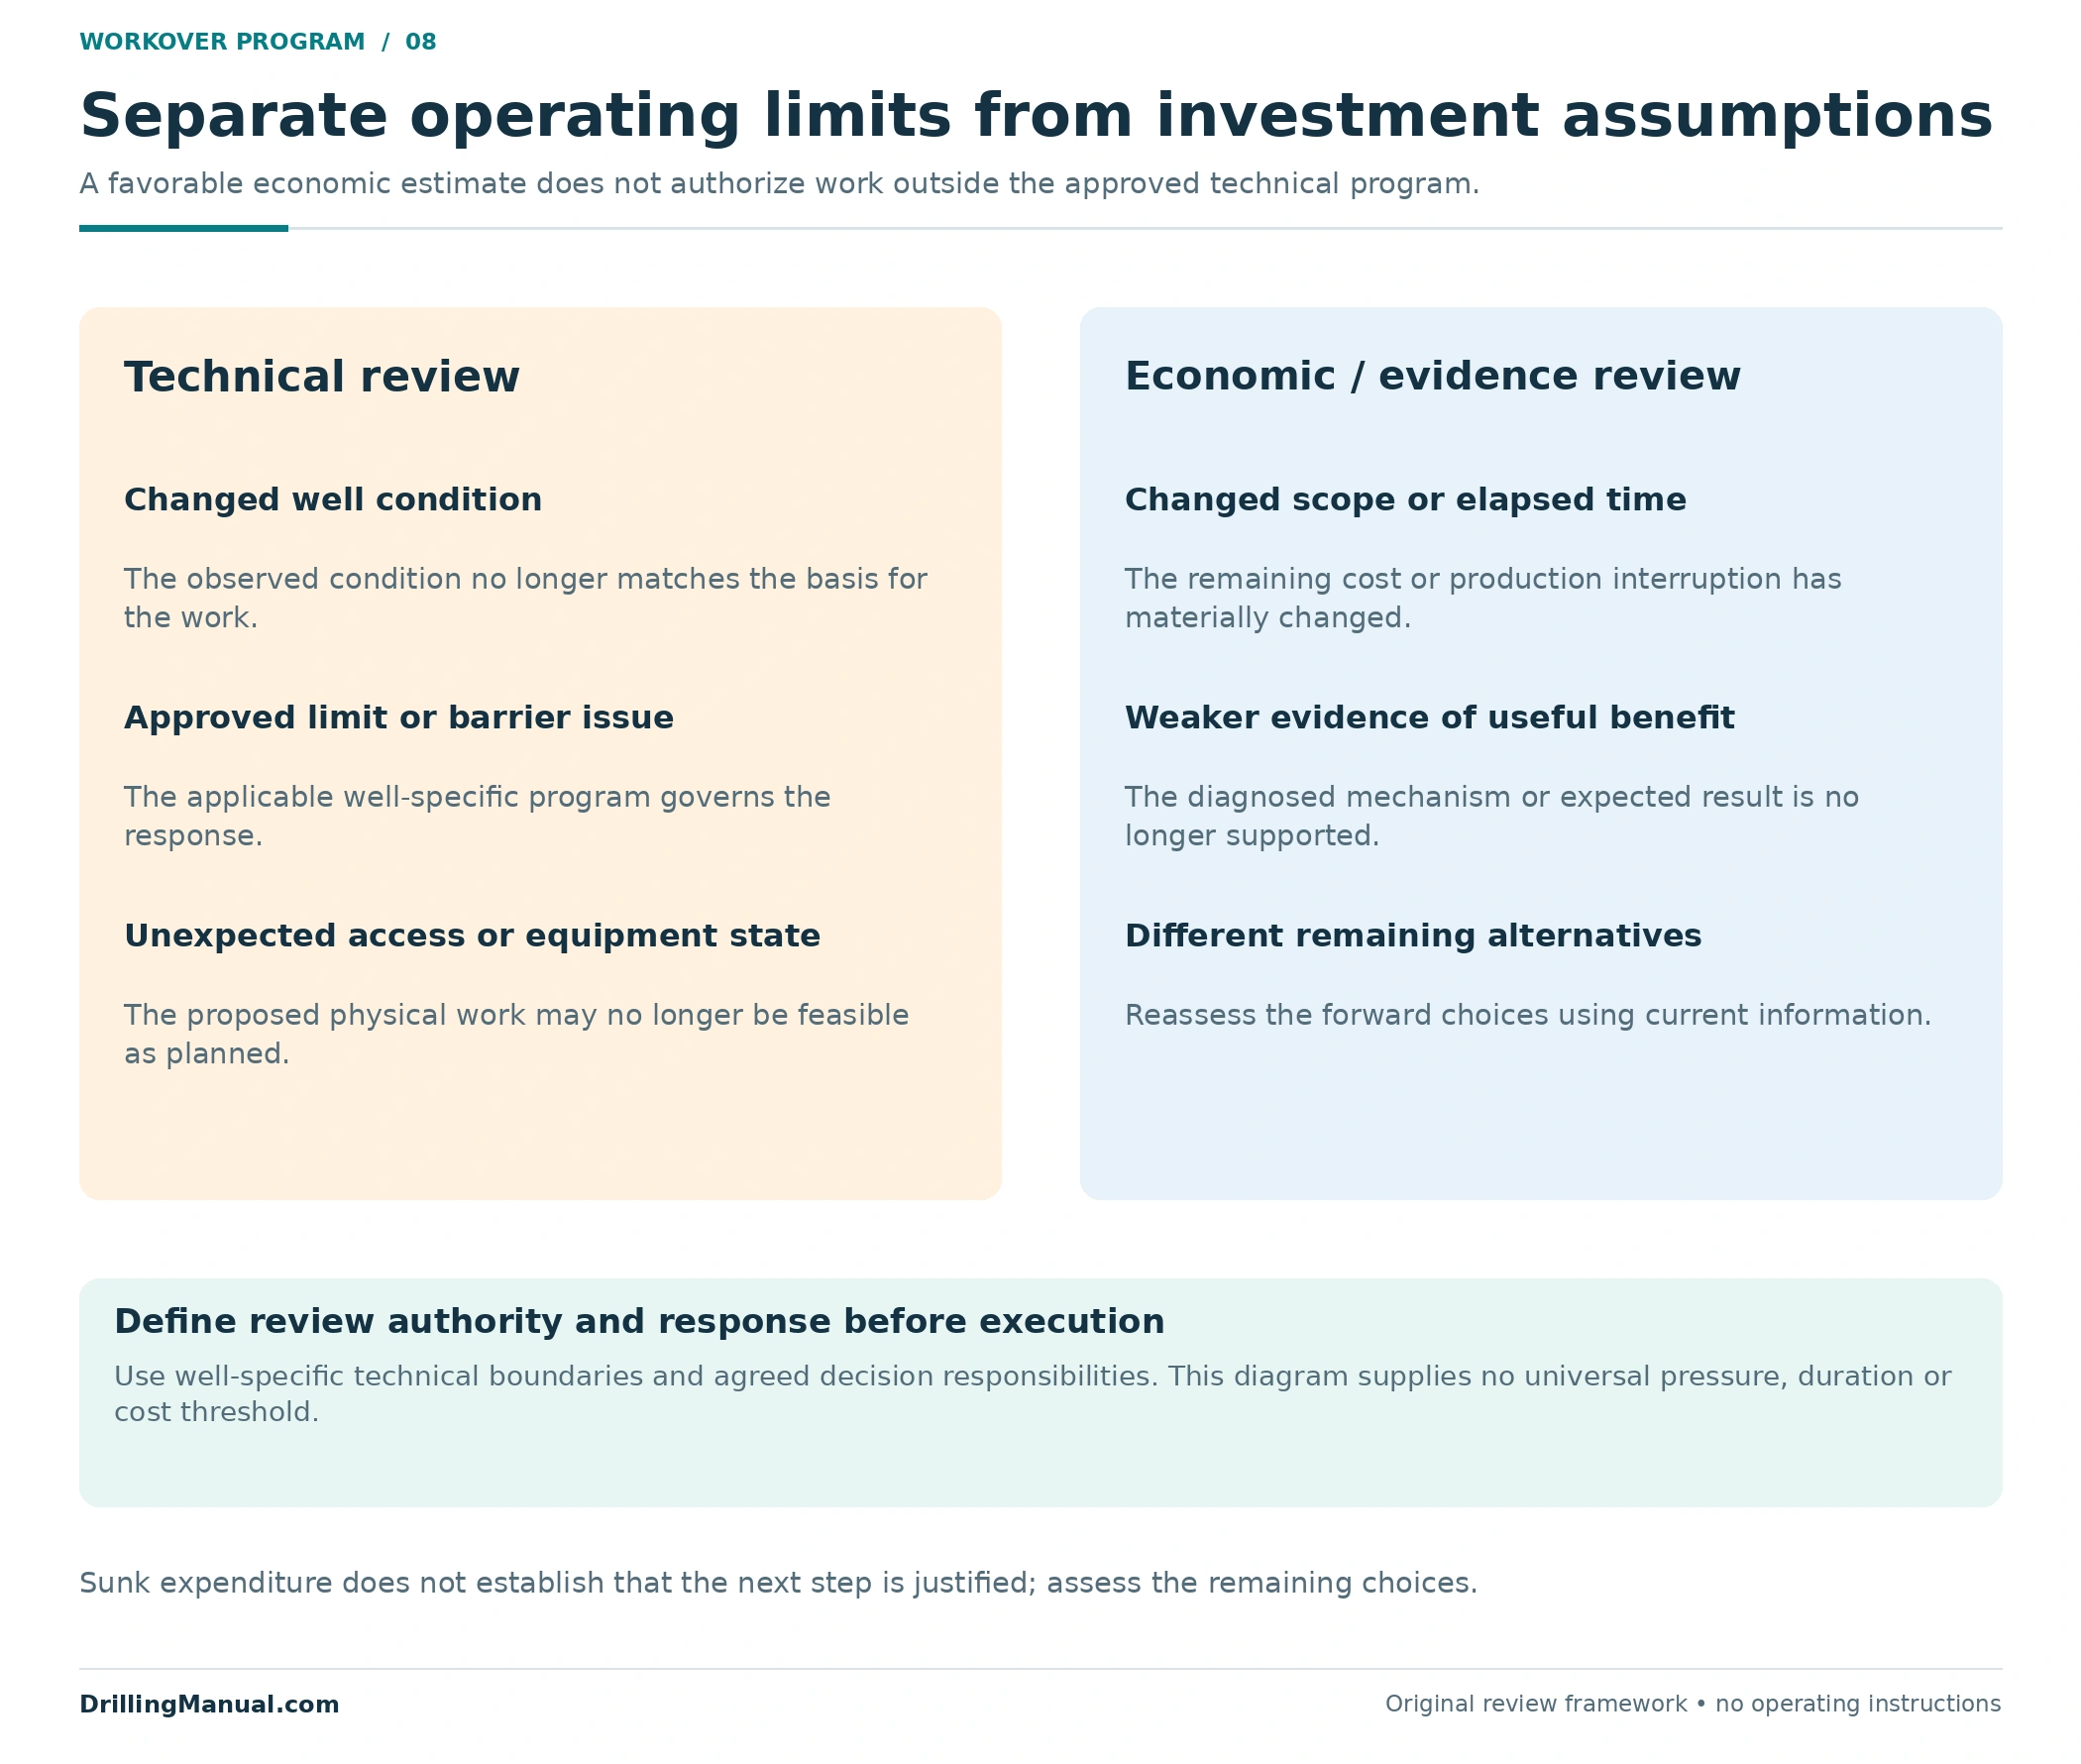
Keep technical operating limits separate from economic review triggers. The actual well program must define the applicable conditions, authority and response for the approved operation. A favorable production estimate cannot make unsuitable equipment or an unresolved well-control condition acceptable. Perrin places proper control and a suitable configuration alongside the selection of the means used for the work. [1, p. 293]
Commercial and evidence triggers ask different questions. Has the diagnosis changed? Has a failed attempt reduced confidence in the next approach? Have the required scope, duration or recovery cost changed enough to alter the original case? DeGeare’s emphasis on useful progress, contingency discussions and alternative solutions supports revisiting these decisions when new information appears. [2, pp. 3–5]
Record who reviews the changed case and what information they need. Money already spent cannot be recovered simply by continuing to spend. The next decision should explain the remaining opportunity, additional commitment and available alternatives. This is an original decision principle applied to the planning discussion, not a universal calculation of how many hours to continue fishing. The dedicated optimum fishing time article covers that narrower subject.
Define verification before committing the job
State the evidence that will close the original objective and the period over which it will be assessed. A treatment can meet an immediate mechanical objective yet fail to sustain the production benefit assumed in its economics. The source requires realistic treatment expectations and recognizes the importance of useful treatment life. Keep those two parts of the result visible. [3, pp. 848–850]

The final workover program should preserve the initial assumptions, approved changes and actual outcome. Comparing them shows whether an error came from diagnosis, scope, duration or the production forecast. An internally consistent budget is valuable, but the completed job must still be judged against the specific reason the well was selected.
Frequently asked questions
Is a workover program only an operating sequence?
No. The sequence needs a defined objective, current well information, suitable means, an expected result and agreed contingencies. This article addresses that decision basis. Well-specific execution steps and operating limits remain separate. [1, p. 293] [2, pp. 1, 3–4]
Does the lowest daily unit price give the lowest job cost?
Not necessarily. Perrin explicitly considers the overall duration and results alongside unit price and availability. Compare the complete scope needed for the required outcome, including the effect of different durations. A low price cannot compensate for missing capability. [1, p. 293]
Should shutdown production be treated as permanently lost oil?
Not automatically. The example subtracts baseline production unavailable within a defined window. Some of that production may be deferred beyond the window. Neither the subtraction nor a higher restart rate establishes a change in ultimate recovery.
Where should workover program probabilities come from?
DeGeare points to comparable situations and informed judgment. Similarity must be assessed rather than assumed, and material differences should remain visible. The article’s percentages are invented solely to demonstrate arithmetic; they are not defaults for field use. [2, p. 5]
Does a short payout justify the job by itself?
No. Payout depends on the comparison and forecast. It does not resolve technical feasibility, an incorrect diagnosis, downside outcomes or the durability of the expected benefit. Those questions remain part of the candidate case. [1, p. 293] [3, pp. 847–850]
Is there a universal time limit for stopping a workover?
No such limit is supplied here. DeGeare emphasizes the variety of situations, alternatives and economic inputs. Actual operating responses belong in the approved program; changes to the candidate evidence and remaining cost require their own review. [2, pp. 3–5]
Book references
- Denis Perrin. Well Completion and Servicing. Éditions Technip, 1999. Chapter 5, “Well Servicing and Workover,” printed p. 293 / physical PDF p. 305.
- Joe DeGeare. The Guide to Oilwell Fishing Operations: Tools, Techniques, and Rules of Thumb. Second edition. Gulf Professional Publishing / Elsevier, 2015. Chapters 1–3, printed pp. 1–5 / physical PDF pp. 7–11.
- Mary Hardy and Thomas Lockhart. “Water Control,” Chapter 17 in Petroleum Well Construction, edited by Michael J. Economides, Larry T. Watters and Shari Dunn-Norman. John Wiley & Sons; Halliburton educational copy. Visible document and physical PDF pp. 828, 847–850. The candidate framework, budgets, production paths, probabilities and calculations in this article are original hypothetical constructions, not reported well results or operating recommendations.