Gas well liquid loading occurs when the produced gas cannot carry the available liquid through the well’s flow path under the prevailing conditions. Retained liquid adds a pressure burden that can restrict reservoir inflow, produce intermittent behavior or stop production. A declining gas rate may prompt the investigation, but it does not establish the diagnosis by itself. [1, pp. 10-31–10-34] [2, pp. 6–8]
The useful starting point is to connect the production history with the liquid source, pressure evidence and actual completion. Only then can an unloading option be judged against the required result: a temporary restart, improved liquid transport through a retained flow path, or continuing lift assistance. Production after temporary assistance ends is a separate question from whether the well initially flows during unloading. [1, pp. 11-96–11-97] [2, pp. 4–9, 15]
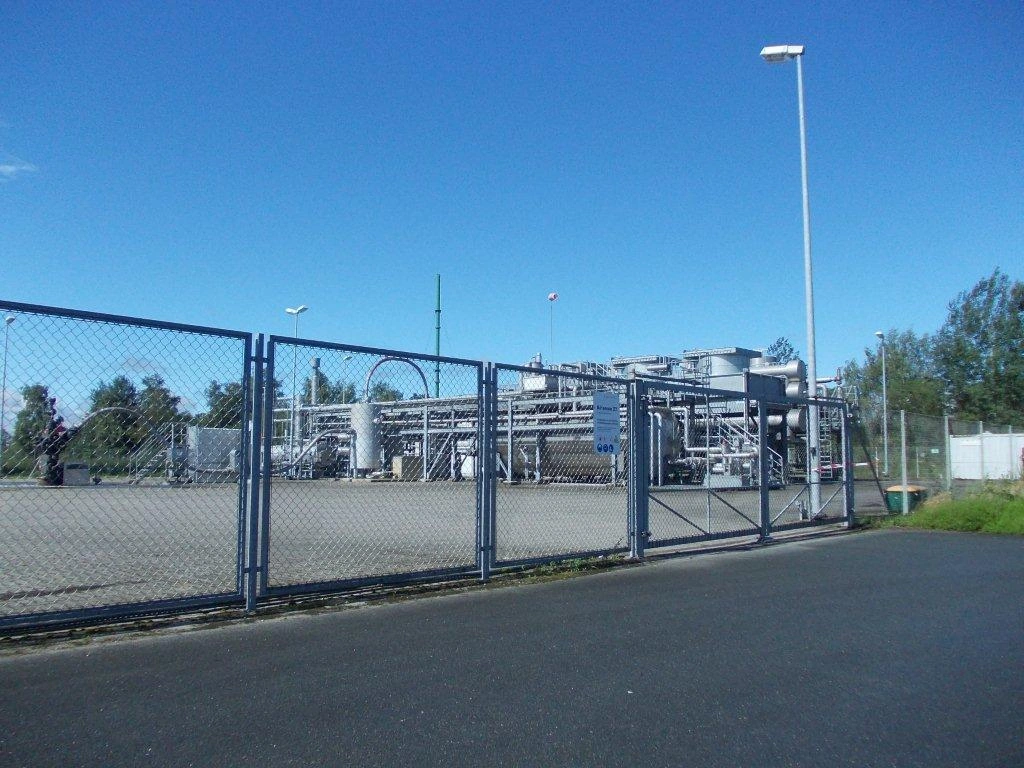
Photo: Bötersen Z7 – gas well in Lower Saxony — Battenbrook / Wikimedia Commons, CC BY-SA 3.0. Converted from JPEG to WebP; native dimensions and original framing retained, with no content alteration. This WebP version is shared under the same licence.

What is gas well liquid loading?
A producing gas stream may contain water, condensate or both. Their presence does not by itself show that the well is loaded. The problem arises when the transport capability of the gas and the existing flow path is insufficient to remove the liquid supplied to, or remaining within, that path. The Schlumberger manual also identifies introduced fluids as a possible part of the liquid inventory. Establishing the origin of the liquid and establishing why it remains in the well are related but different tasks. [2, pp. 6–7]
The interaction can reinforce itself. As more liquid is retained, the hydrostatic contribution to the required flowing bottomhole pressure can rise. That added burden can restrict inflow, leaving less gas available to transport liquid. This describes a possible relationship between reservoir supply and wellbore outflow; it does not prove that every declining well follows the same sequence. [1, pp. 10-33–10-34] [3, pp. 585–586]
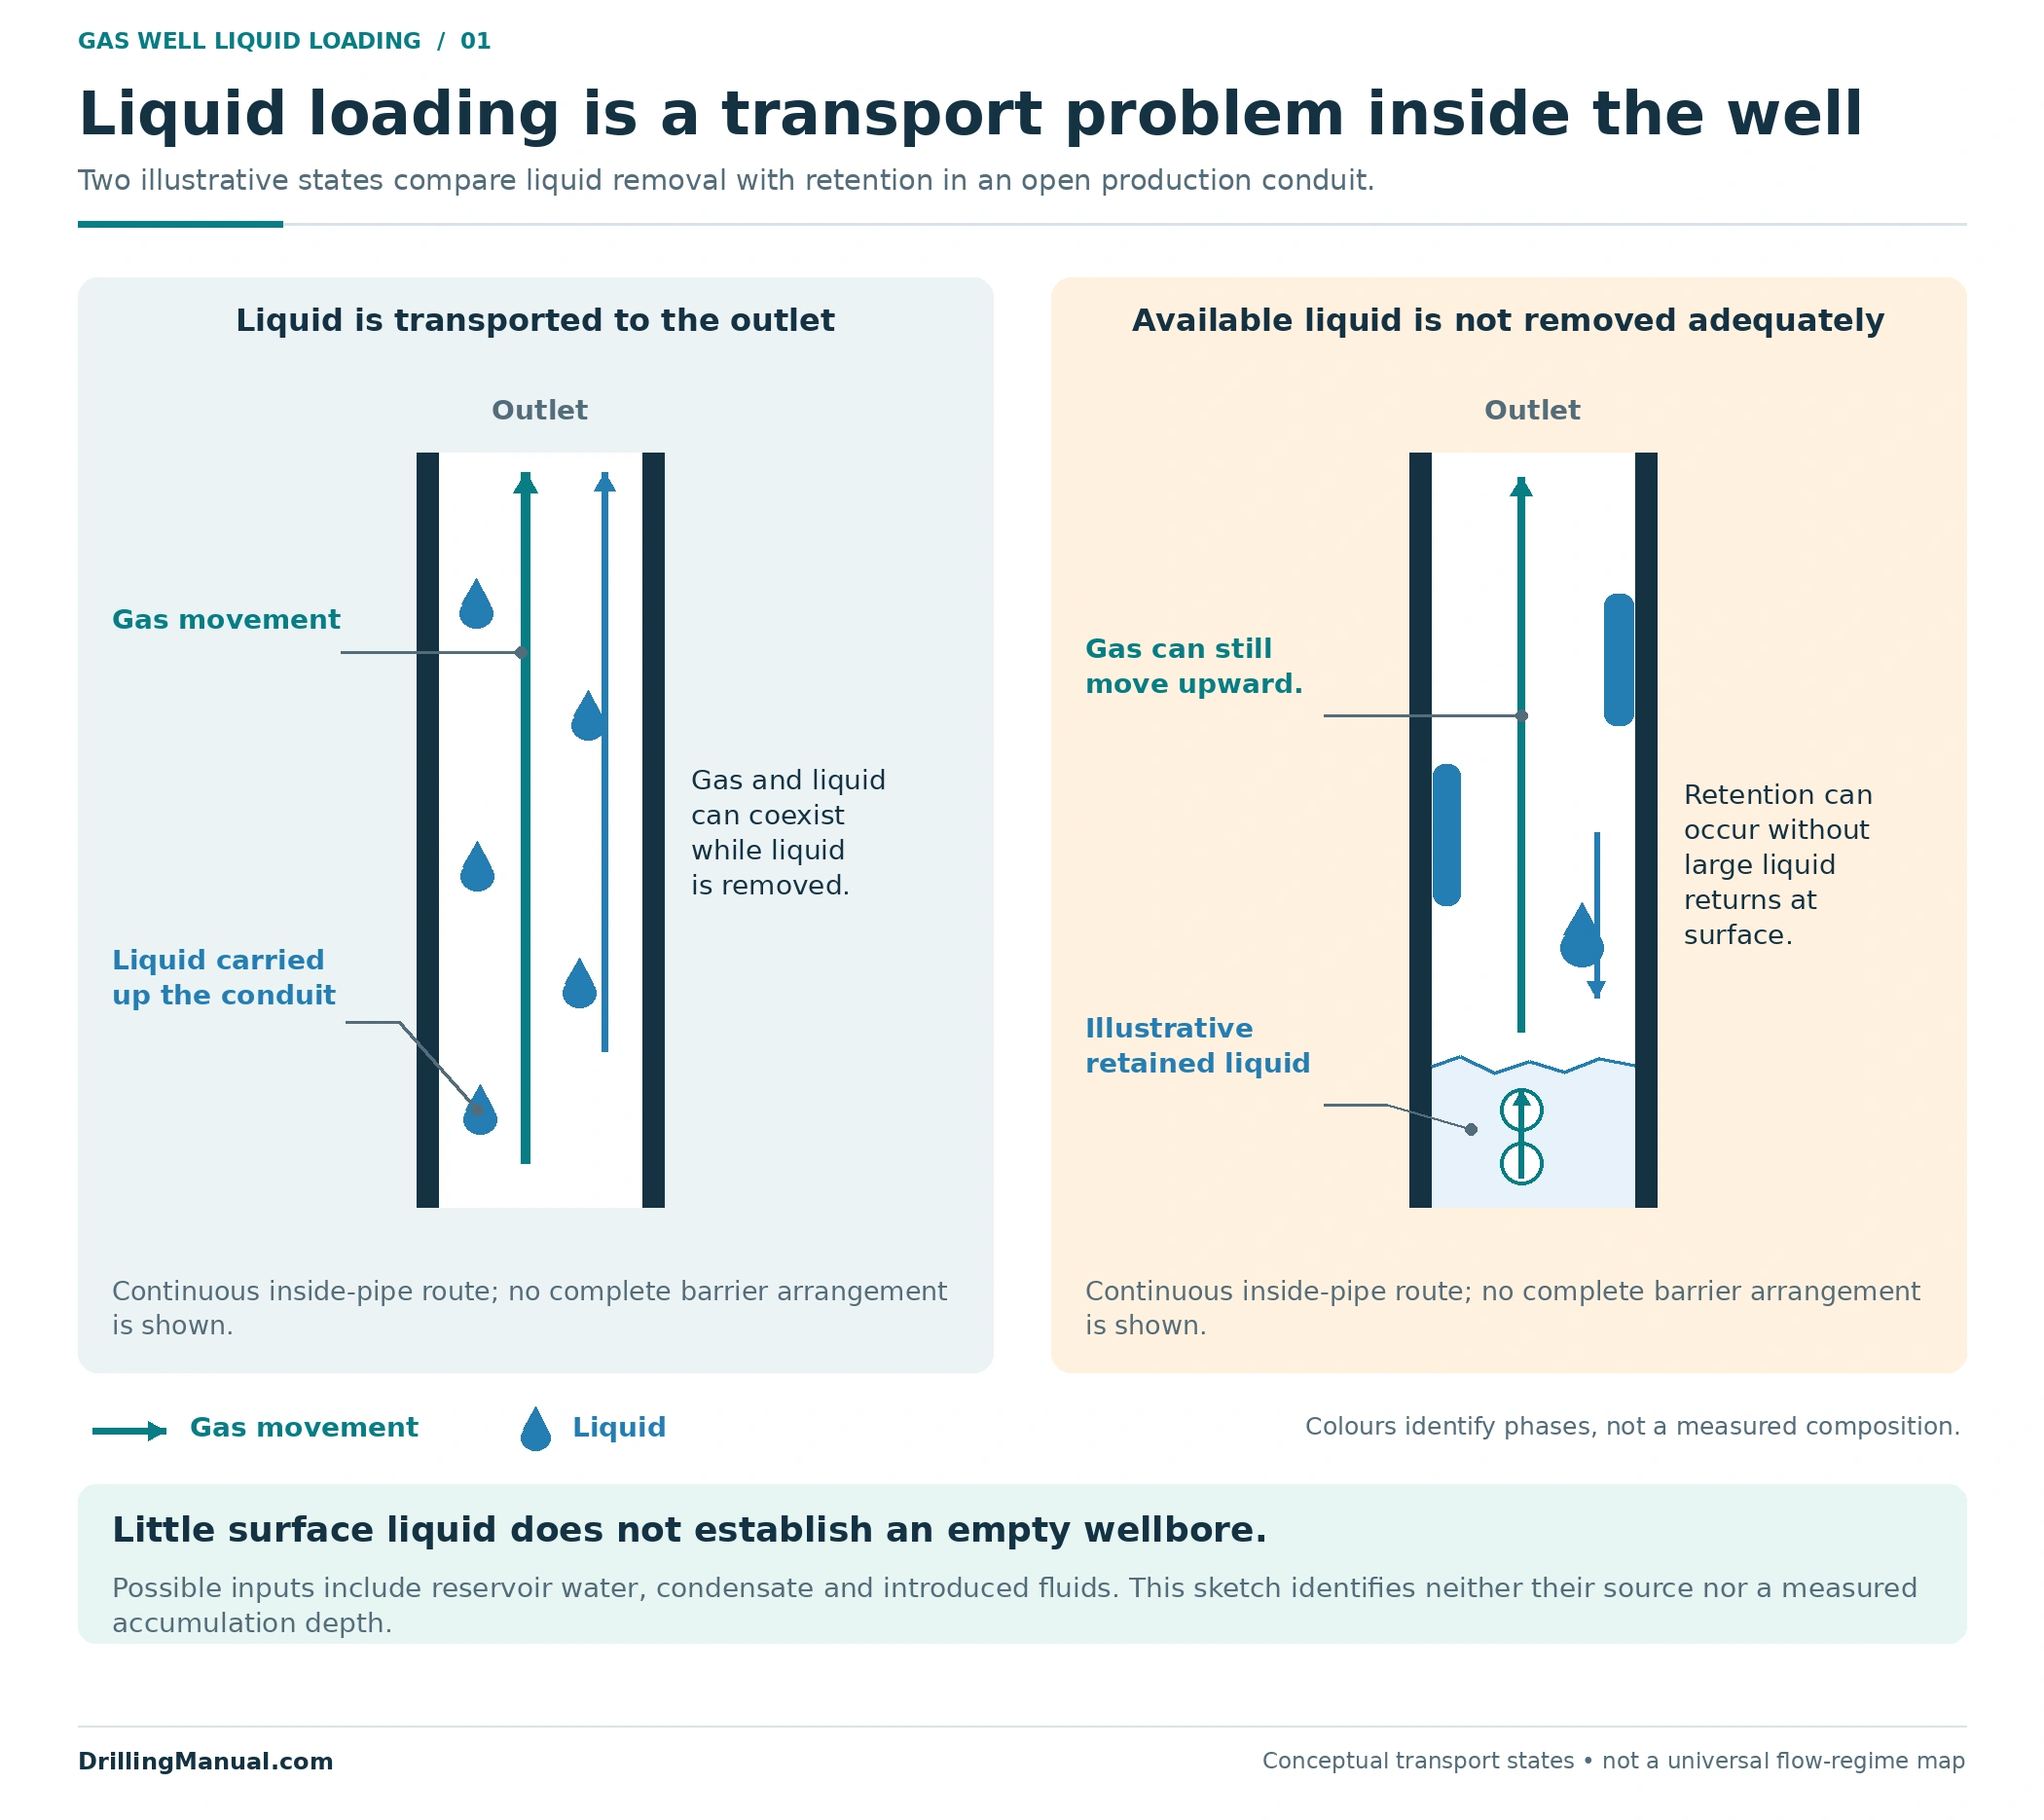
Surface liquid returns and downhole liquid inventory are different quantities. Some liquid reaching the separator does not establish that all available liquid is being removed. Conversely, little or no liquid at surface does not exclude accumulation: the manual describes wells in which the gas never had enough carrying capability to bring the liquid out. A dry-looking production record therefore needs interpretation alongside the well history and pressure evidence. [2, pp. 6–7]
Gas well liquid loading signs: what the history can show
A gradual decline followed by a sharper loss of rate, intermittent production or cessation can make liquid loading a credible candidate. These observations locate a problem in the history; they do not measure the retained liquid volume or identify its source. A system review also considers changes in reservoir inflow and in the conditions through which the well must produce. [2, pp. 6–8] [3, pp. 586–588]
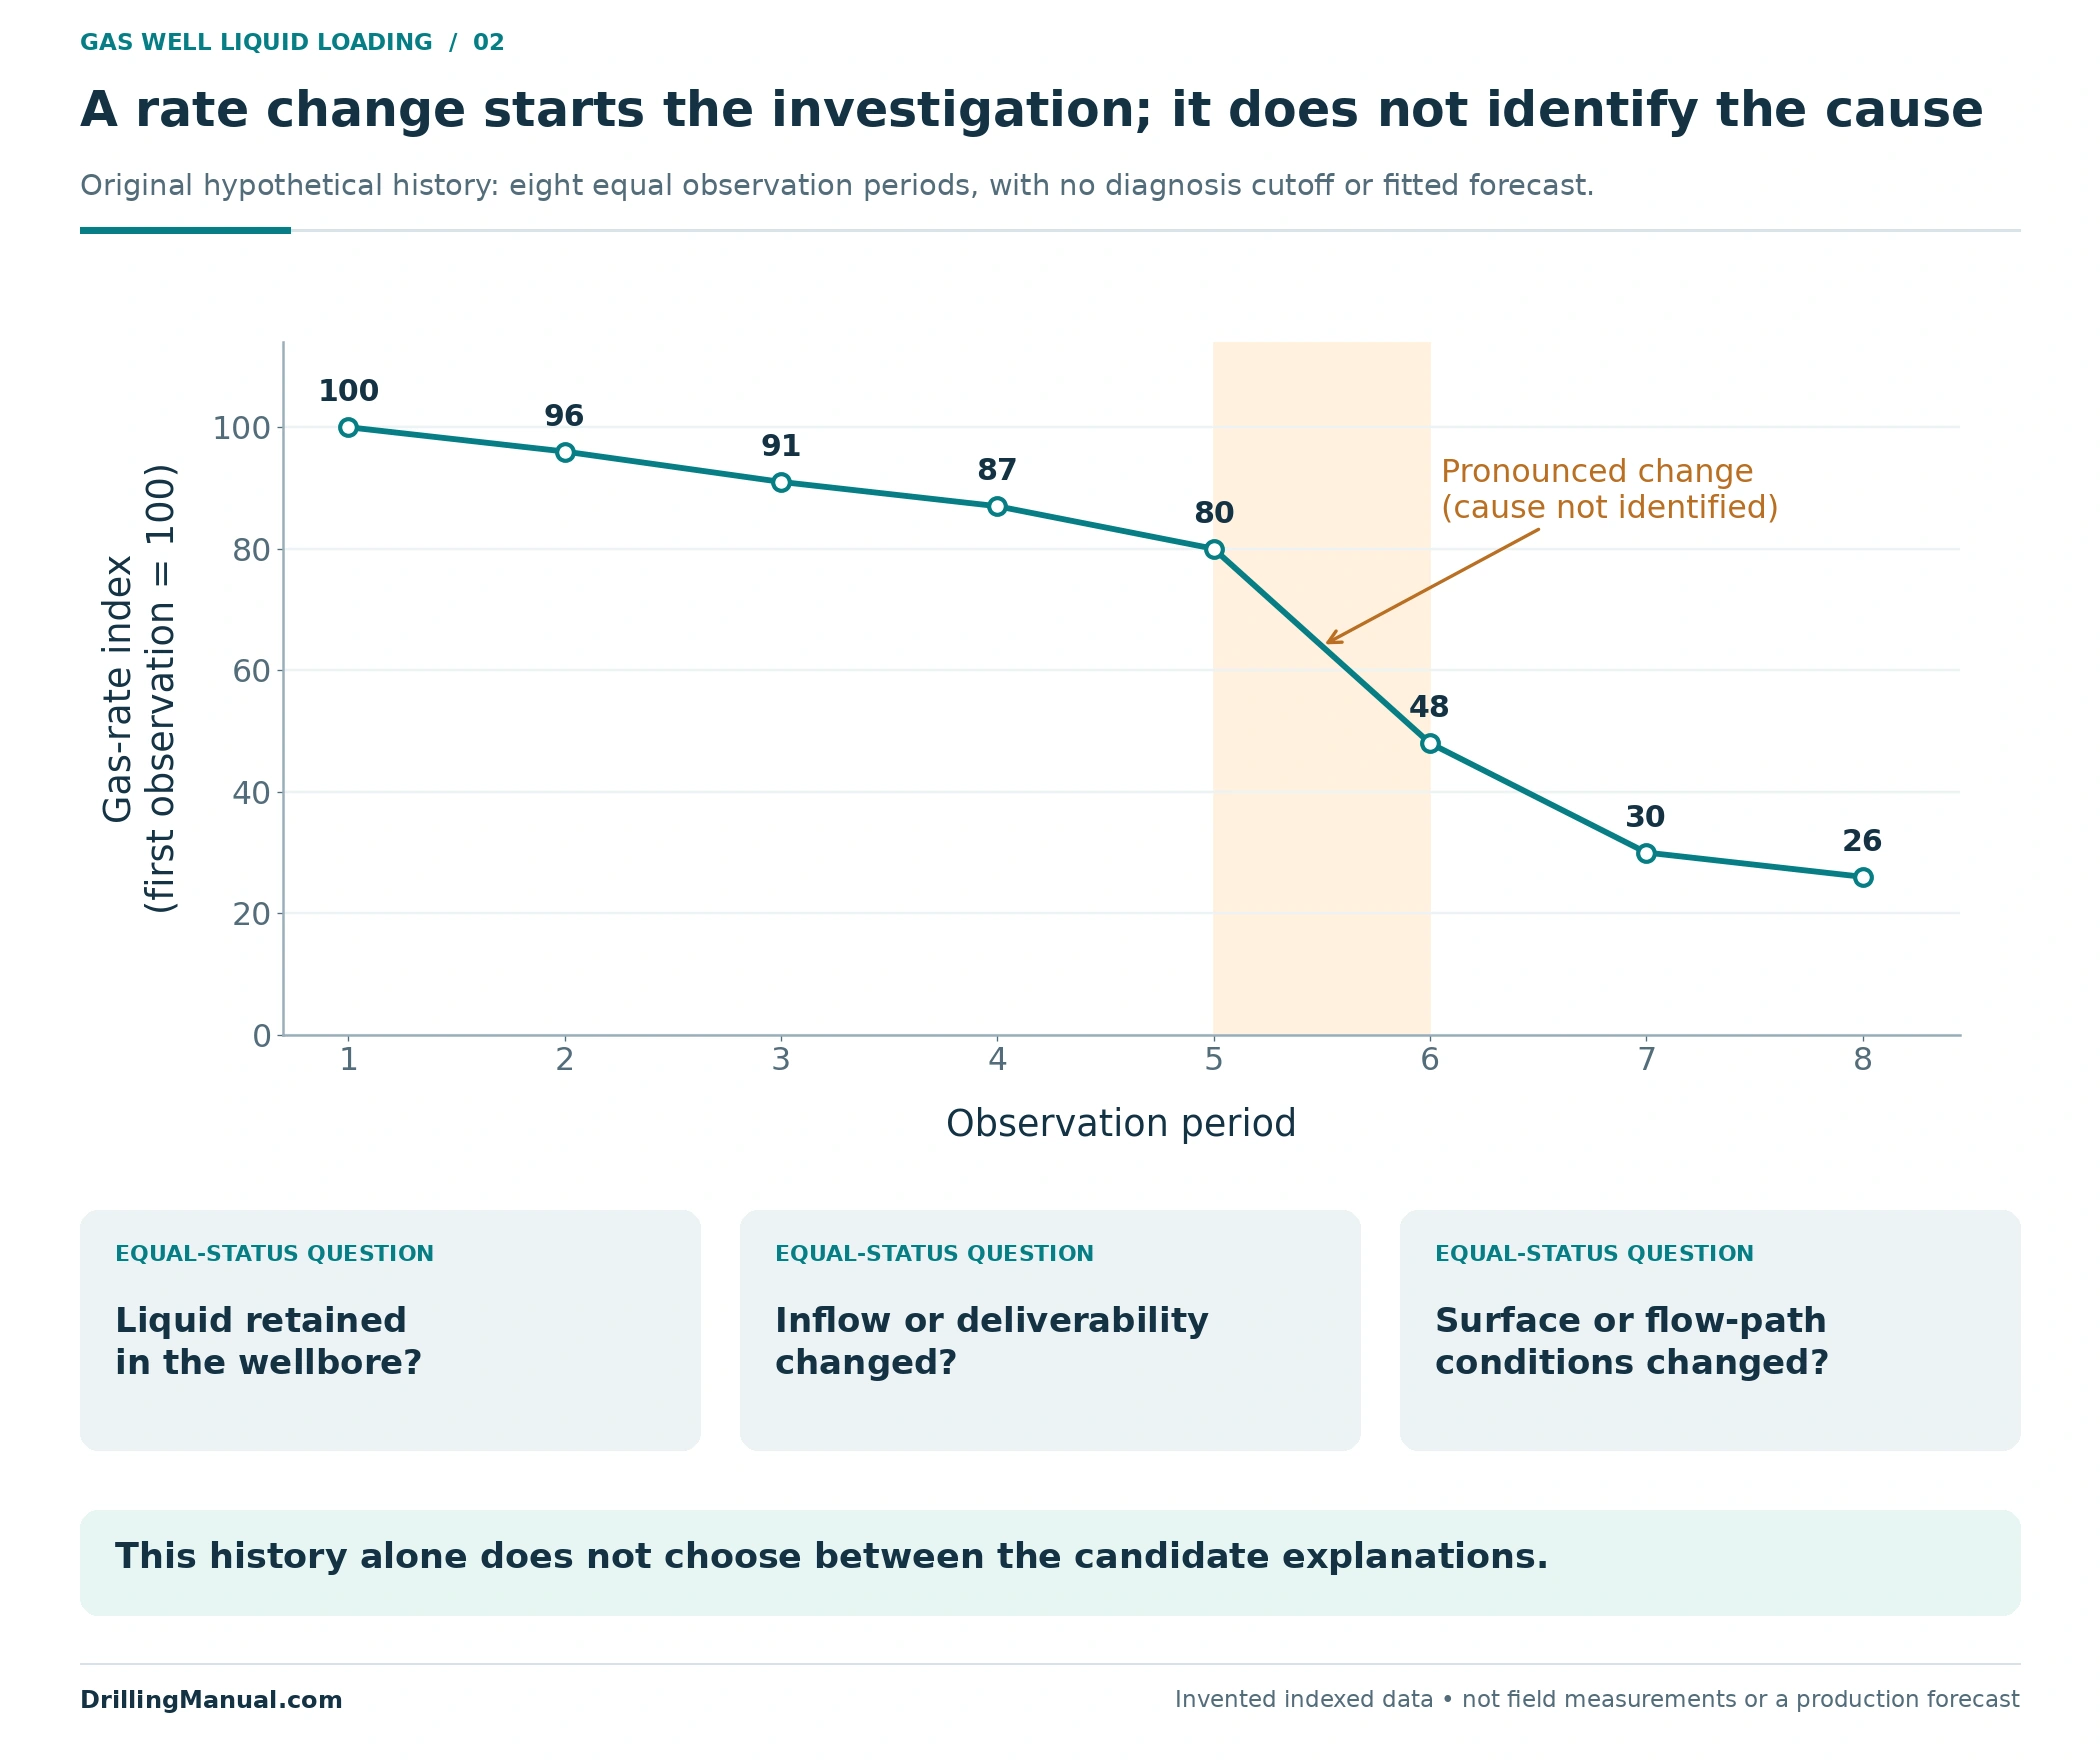
In the original hypothetical chart, the gas-rate index falls from 80 at observation 5 to 48 at observation 6. The first observation has been assigned an index of 100; these are invented values, not field production units. The sharper change marks a period for closer investigation. It does not distinguish retained liquid from a change in deliverability or in the surface and flow-path conditions.
| Observation | What it contributes | What still needs evidence |
|---|---|---|
| A departure from the earlier gas-rate trend | A time window in which the well’s response changed | Whether inflow, multiphase outflow, surface conditions or a combination explains the change |
| Intermittent flow or uneven liquid returns | A reason to examine the gas–liquid transport behavior | The pressure profile, liquid origin and actual completion path |
| Little liquid measured at surface | An observation about the fluid reaching the measurement point | Whether liquid is absent, retained downhole or being produced unevenly |
| Improved flow during an unloading attempt | A response under the conditions of that attempt | What remains achievable when temporary assistance is removed |
This interpretation table is an editorial synthesis of the manuals’ diagnostic and evaluation guidance for gas well liquid loading. It is intended to keep an observation separate from an explanation, so that the preferred unloading method does not become the assumed diagnosis. [1, p. 11-96] [2, pp. 6–8, 15] [3, pp. 586–588]
Identify the liquid and its history
When investigating gas well liquid loading, account for fluids introduced during earlier well activity, liquid formed by condensation and water supplied from the reservoir, including possible combinations. The production and intervention history helps distinguish an existing inventory from a continuing liquid supply. Improving removal capability does not, by itself, demonstrate that the source of that supply has stopped. [2, pp. 6–7]
Keep three descriptions separate in the evidence record: what liquid may enter or form in the well, what may remain within the wellbore, and what is actually measured at surface. For example, a recorded liquid return identifies material that has reached the surface; it does not uniquely locate the downhole source or establish the volume still retained. The working explanation becomes stronger when fluid observations agree with the pressure profile and production history. [2, pp. 6–8]
Assess gas well liquid loading across the production system
The well produces through a connected system. Reservoir inflow supplies the wellbore; the completion, fluids and geometry determine its pressure losses; the wellhead, flowline and receiving equipment establish the surface boundary. Petroleum Well Construction describes tubing-performance calculations in relation to this complete path, including separator pressure and the intervening surface equipment. A bottomhole explanation that ignores a changed receiving condition can therefore miss part of the problem. [3, pp. 584–588]
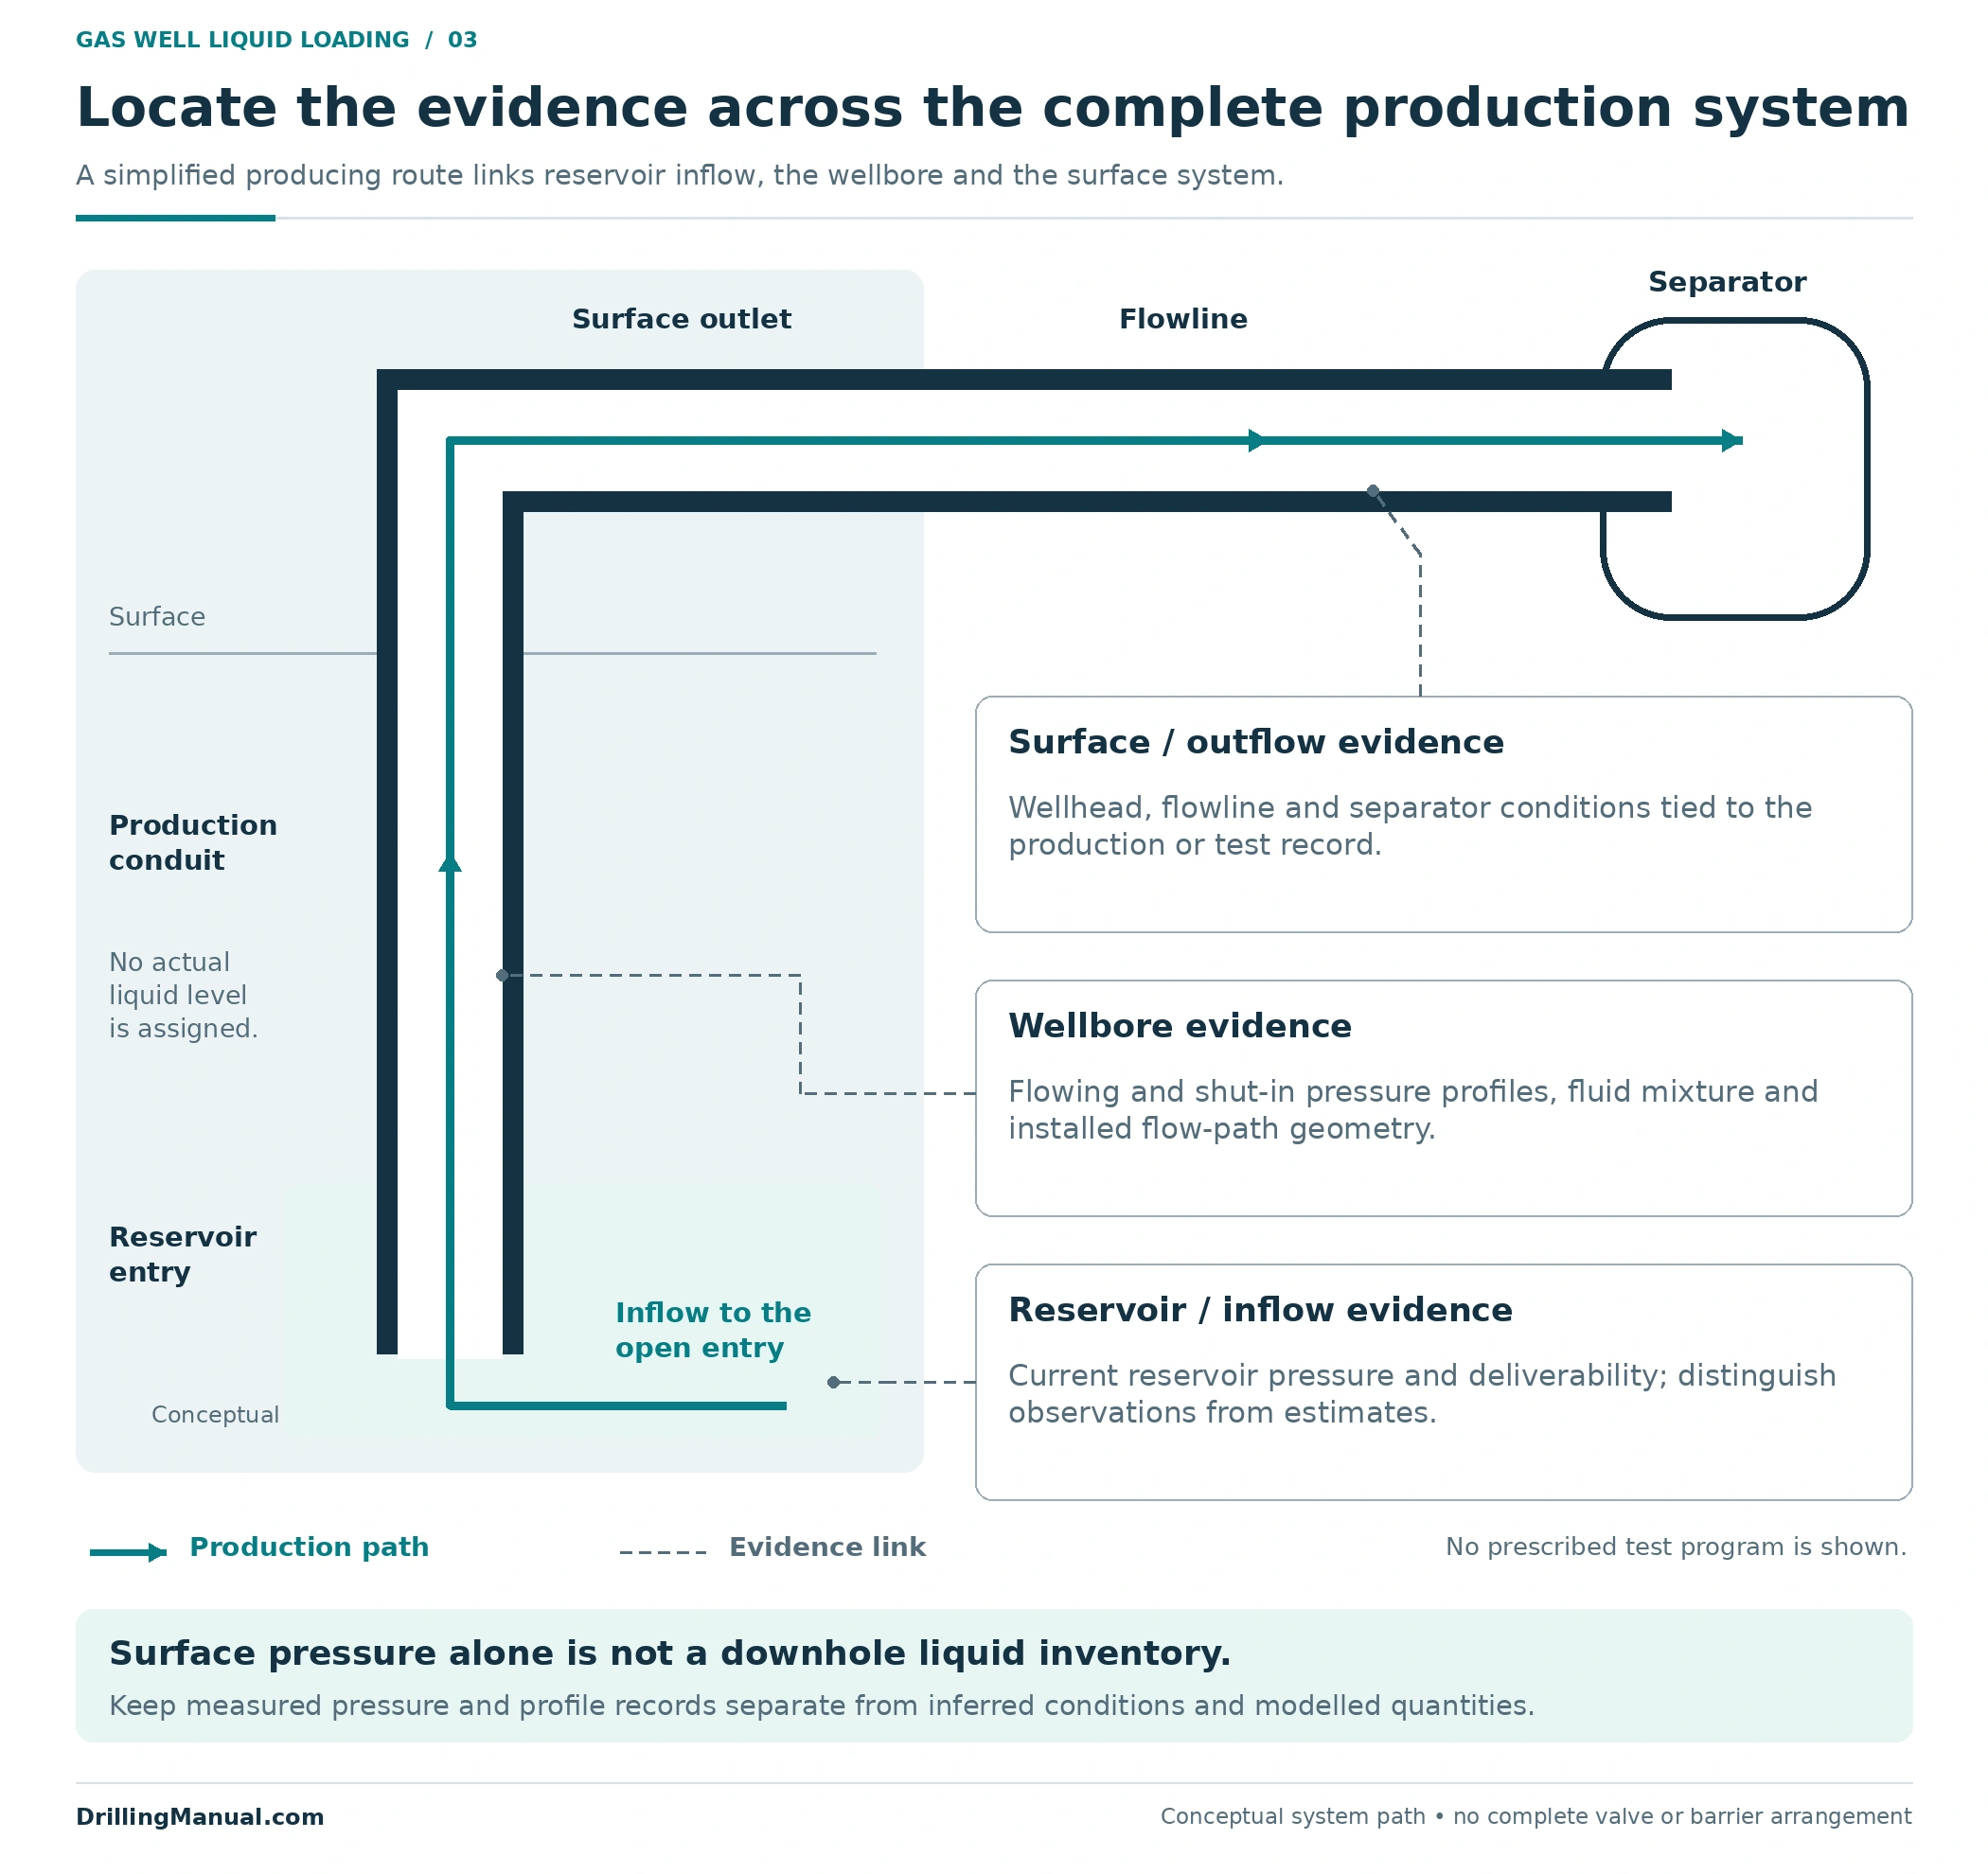
| Evidence group | Information to connect | Diagnostic purpose |
|---|---|---|
| Reservoir and inflow | Current pressure evidence, well tests, production history and the inflow relationship being used | Assess what the reservoir can deliver under the evaluated conditions |
| Wellbore and liquids | Pressure profiles, fluid properties, liquid history, deviation, flowing dimensions and restrictions | Assess transport behavior and the pressure burden through the actual path |
| Surface and facilities | Wellhead, flowline and separator conditions, together with relevant configuration changes | Define the boundary against which the well is producing and make comparisons meaningful |
| Time and operating context | When rates and pressures were recorded, the production mode and any temporary assistance | Avoid combining observations that describe different well states |
The table groups inputs from the book sources into a practical record for investigating gas well liquid loading. Missing values should remain identified as missing; an assumed value should remain distinguishable from a measurement. The same applies when a model is matched to the production history. [1, pp. 10-33, 11-97] [2, pp. 4, 7–8, 15] [3, pp. 584–588]
Use pressure evidence with its limitations visible
The Schlumberger manual gives flowing and shut-in bottomhole pressure profiles an important diagnostic role and cautions against inaccurate inference from wellhead pressure. The useful lesson is to establish how the downhole pressure was obtained and whether its uncertainty is acceptable for the decision. A wellhead measurement, a calculated bottomhole value and a measured profile are different forms of evidence. This does not make every calculated value unusable or prescribe one test for every well. [2, pp. 7–8]
A tubing/casing pressure difference also needs the completion and pressure communication paths to be understood before it is interpreted. It is not a stand-alone inventory measurement or a universal liquid-loading criterion. Questions about the required isolation and pressure-containing functions belong in the accompanying well integrity assessment; they should not be resolved by assuming that an unloading problem explains every pressure observation. [2, pp. 4, 7–9]
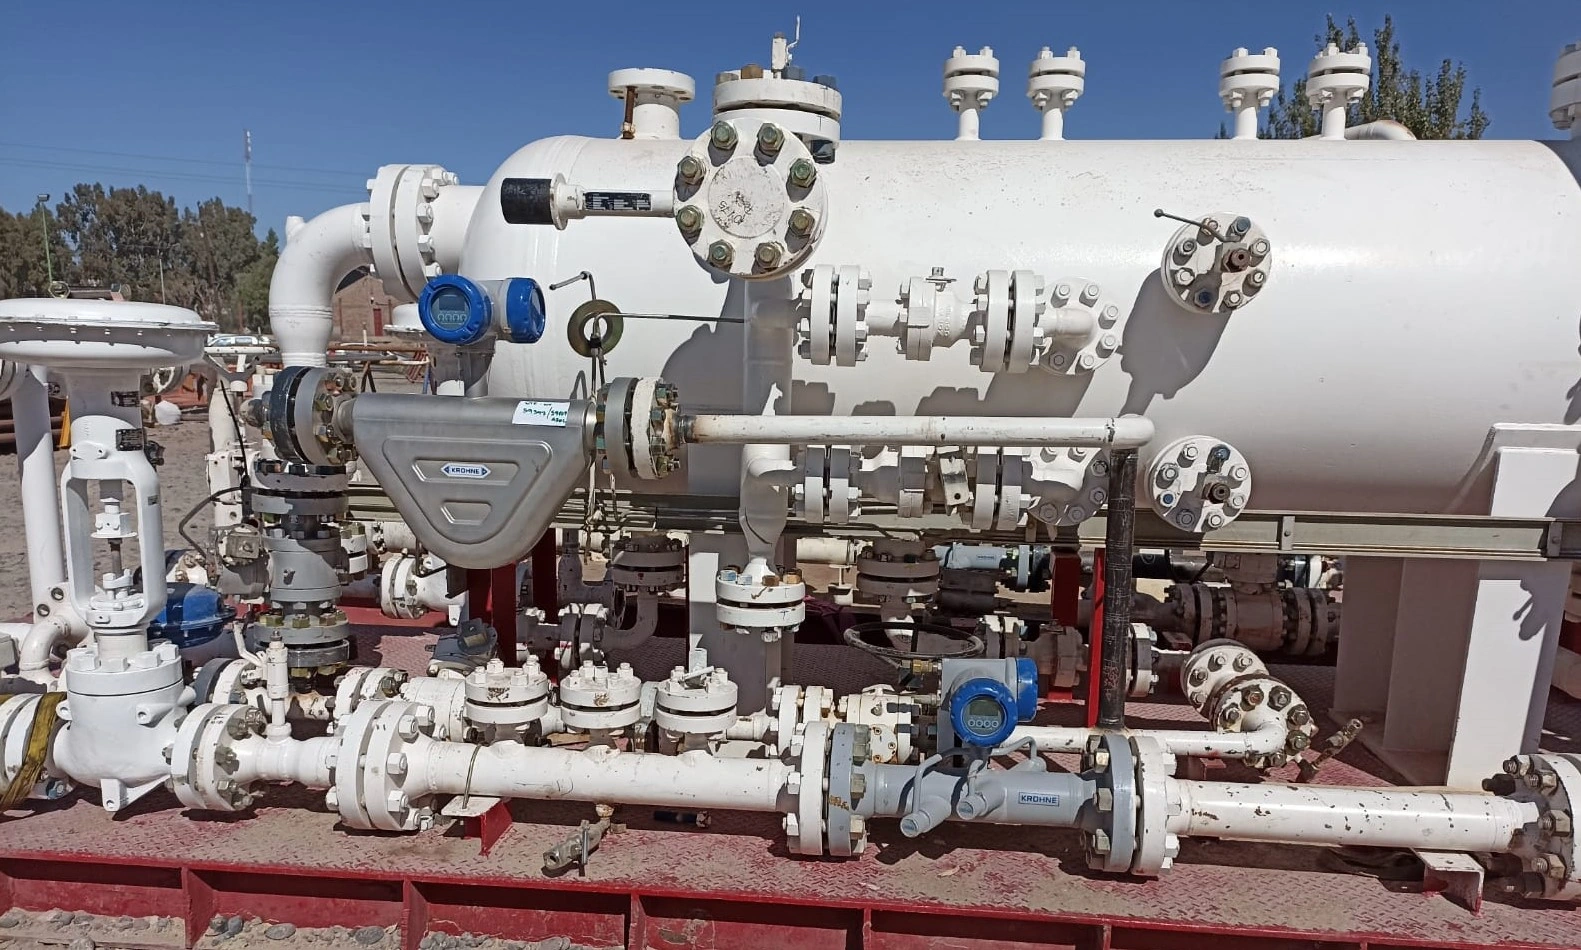
Photo: Test separator with flowmeters for produced oil and produced gas — Theflowexpert / Wikimedia Commons, CC BY-SA 4.0. Converted from JPEG to WebP; native dimensions and original framing retained, with no content alteration. This WebP version is shared under the same licence.

Separate inflow from outflow when interpreting a model
An inflow performance relationship describes the reservoir’s delivery to the well at different flowing bottomhole pressures. An outflow or tubing-performance relationship describes the bottomhole pressure required to move the fluids through the selected production path under specified conditions. A possible operating point is where the assumed relationships are compatible. Confusing these two functions can turn an ordinary feature of an inflow curve into a false diagnosis of gas well liquid loading. [1, pp. 10-31, 10-33] [3, pp. 585–588]
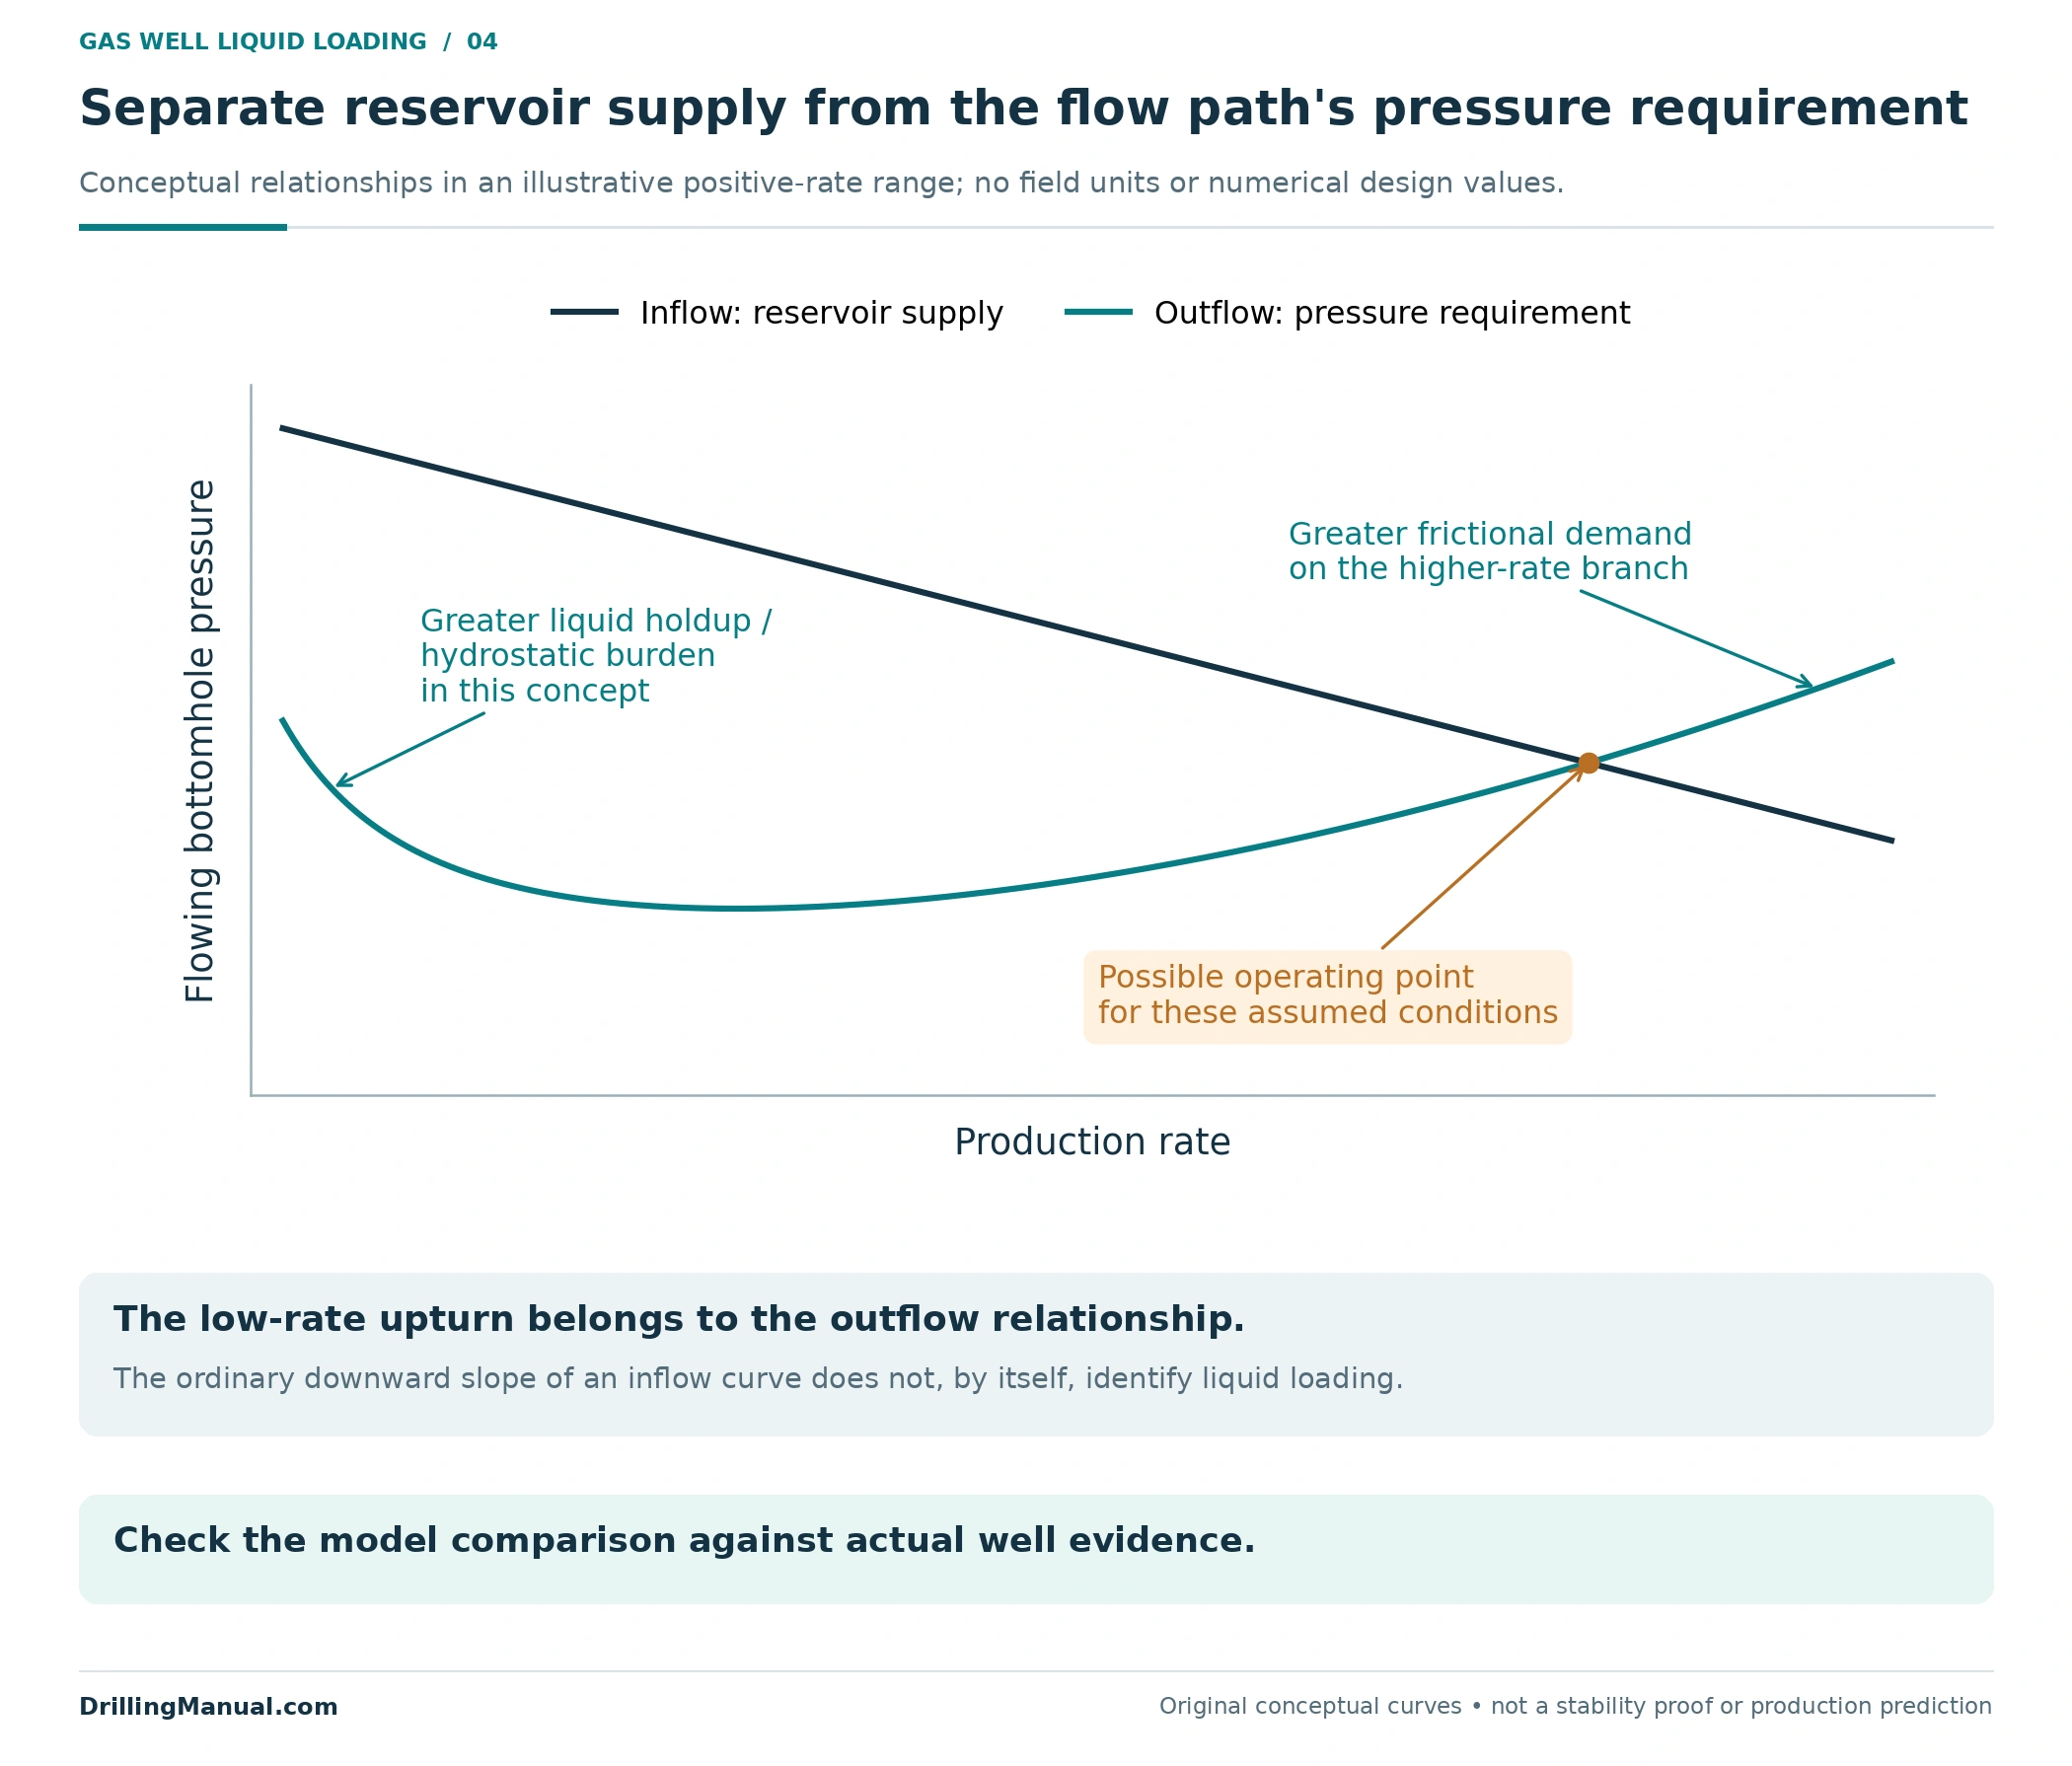
In the conceptual multiphase outflow curve, the low-rate upturn represents a region in which retained liquid and its hydrostatic contribution increase the required bottomhole pressure. At higher rates, friction becomes increasingly important. The normal downward direction of the inflow relationship as rate increases is a different feature; its slope alone is not evidence of liquid loading. The illustrated intersection is a possible solution for the assumed curves, not proof of dynamic stability or sustained liquid removal. [1, pp. 10-33–10-34] [3, pp. 585–588]
Critical velocity and gas well liquid loading
The NOV CTES manual presents a droplet-transport model using gas and liquid properties, including interfacial tension and density. Gas density and interfacial tension change with pressure and temperature, so the modeled critical velocity can vary along the well. A standard-condition gas production rate is also not the same quantity as the local gas velocity within a particular conduit. These dependencies prevent a single surface rate or velocity value from describing every well and every depth. [1, pp. 10-32–10-33]
Use such calculations within a model that represents the fluid, geometry, pressure, temperature and current inflow evidence. The source’s descriptions of flow regimes are specifically introduced for vertical or slightly deviated gas-producing wells; they should not be treated as a universal sequence for every geometry. A calculated transport criterion is one part of the assessment, alongside the observed well response. [1, pp. 10-32–10-34] [2, pp. 7–8]
Define the unloading objective before comparing methods
For gas well liquid loading, a temporary kickoff and continuing liquid removal answer different questions. Nitrogen unloading can reduce the existing hydrostatic burden enough to permit reservoir inflow. The NOV CTES manual explicitly makes production after injection stops conditional on the pressure, phase mixture and flow-rate conditions. An initial response therefore needs to be followed by an assessment of what the well can sustain. [1, p. 11-96]
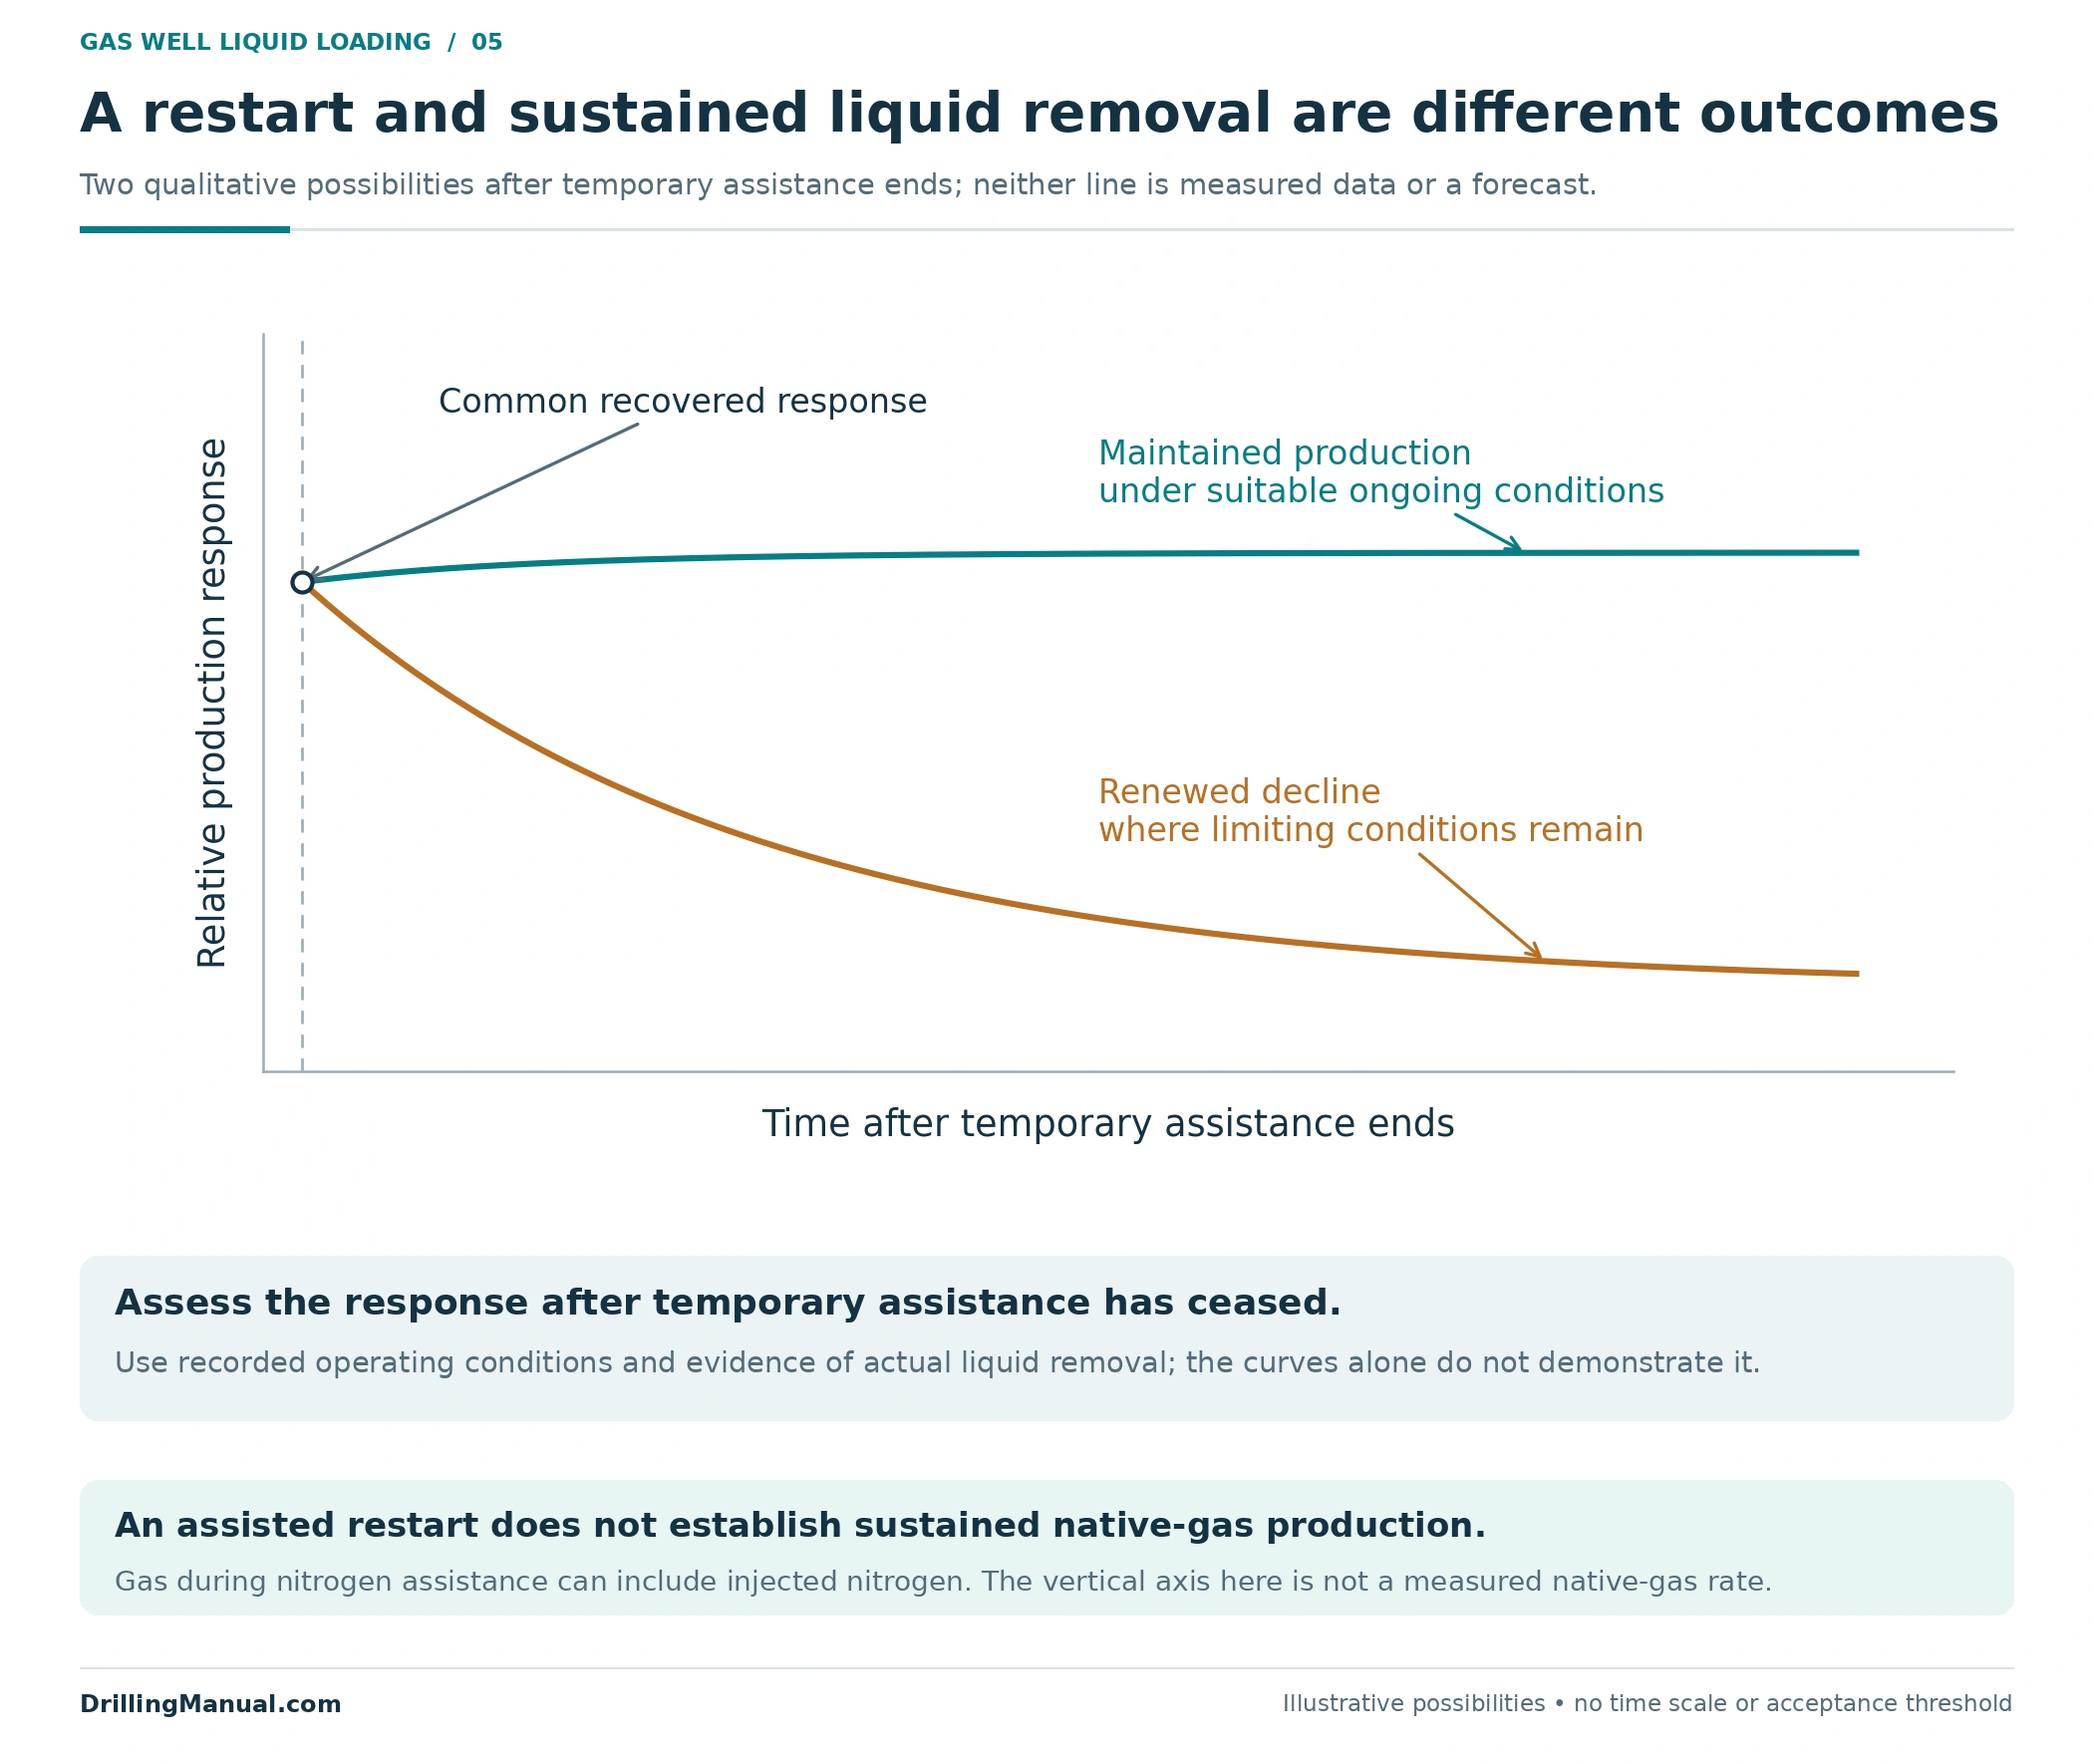
The two post-assistance trajectories are qualitative possibilities. A maintained response and a renewed decline lead to different follow-up questions, but neither curve by itself measures liquid removal. During nitrogen-assisted unloading, returned gas can also contain injected nitrogen; the observed stream must not be represented automatically as an equivalent rate of reservoir gas. The detailed nitrogen lifting and coiled-tubing guide covers that intervention separately. [1, pp. 11-96–11-97]
A useful objective statement connects the diagnosed constraint with the expected production mode. It might call for removal of an existing liquid burden followed by self-sustained flow, a retained change to the flow path, or production that depends on continuing assistance. Stating the intended mode before selecting equipment makes the later evaluation more meaningful. [1, pp. 10-31–10-34, 11-96] [2, pp. 11, 15]
Compare unloading methods for gas well liquid loading
The following comparison covers four functions supported by the selected manuals. It is not a ranking, and the families need not be mutually exclusive. Each candidate still has to fit the well’s inflow, fluids, completion and surface support. Broader artificial-lift selection also considers reliability, energy, maintenance and the costs over the expected producing period. [2, pp. 4–9, 11] [3, pp. 592–594, 641–642]
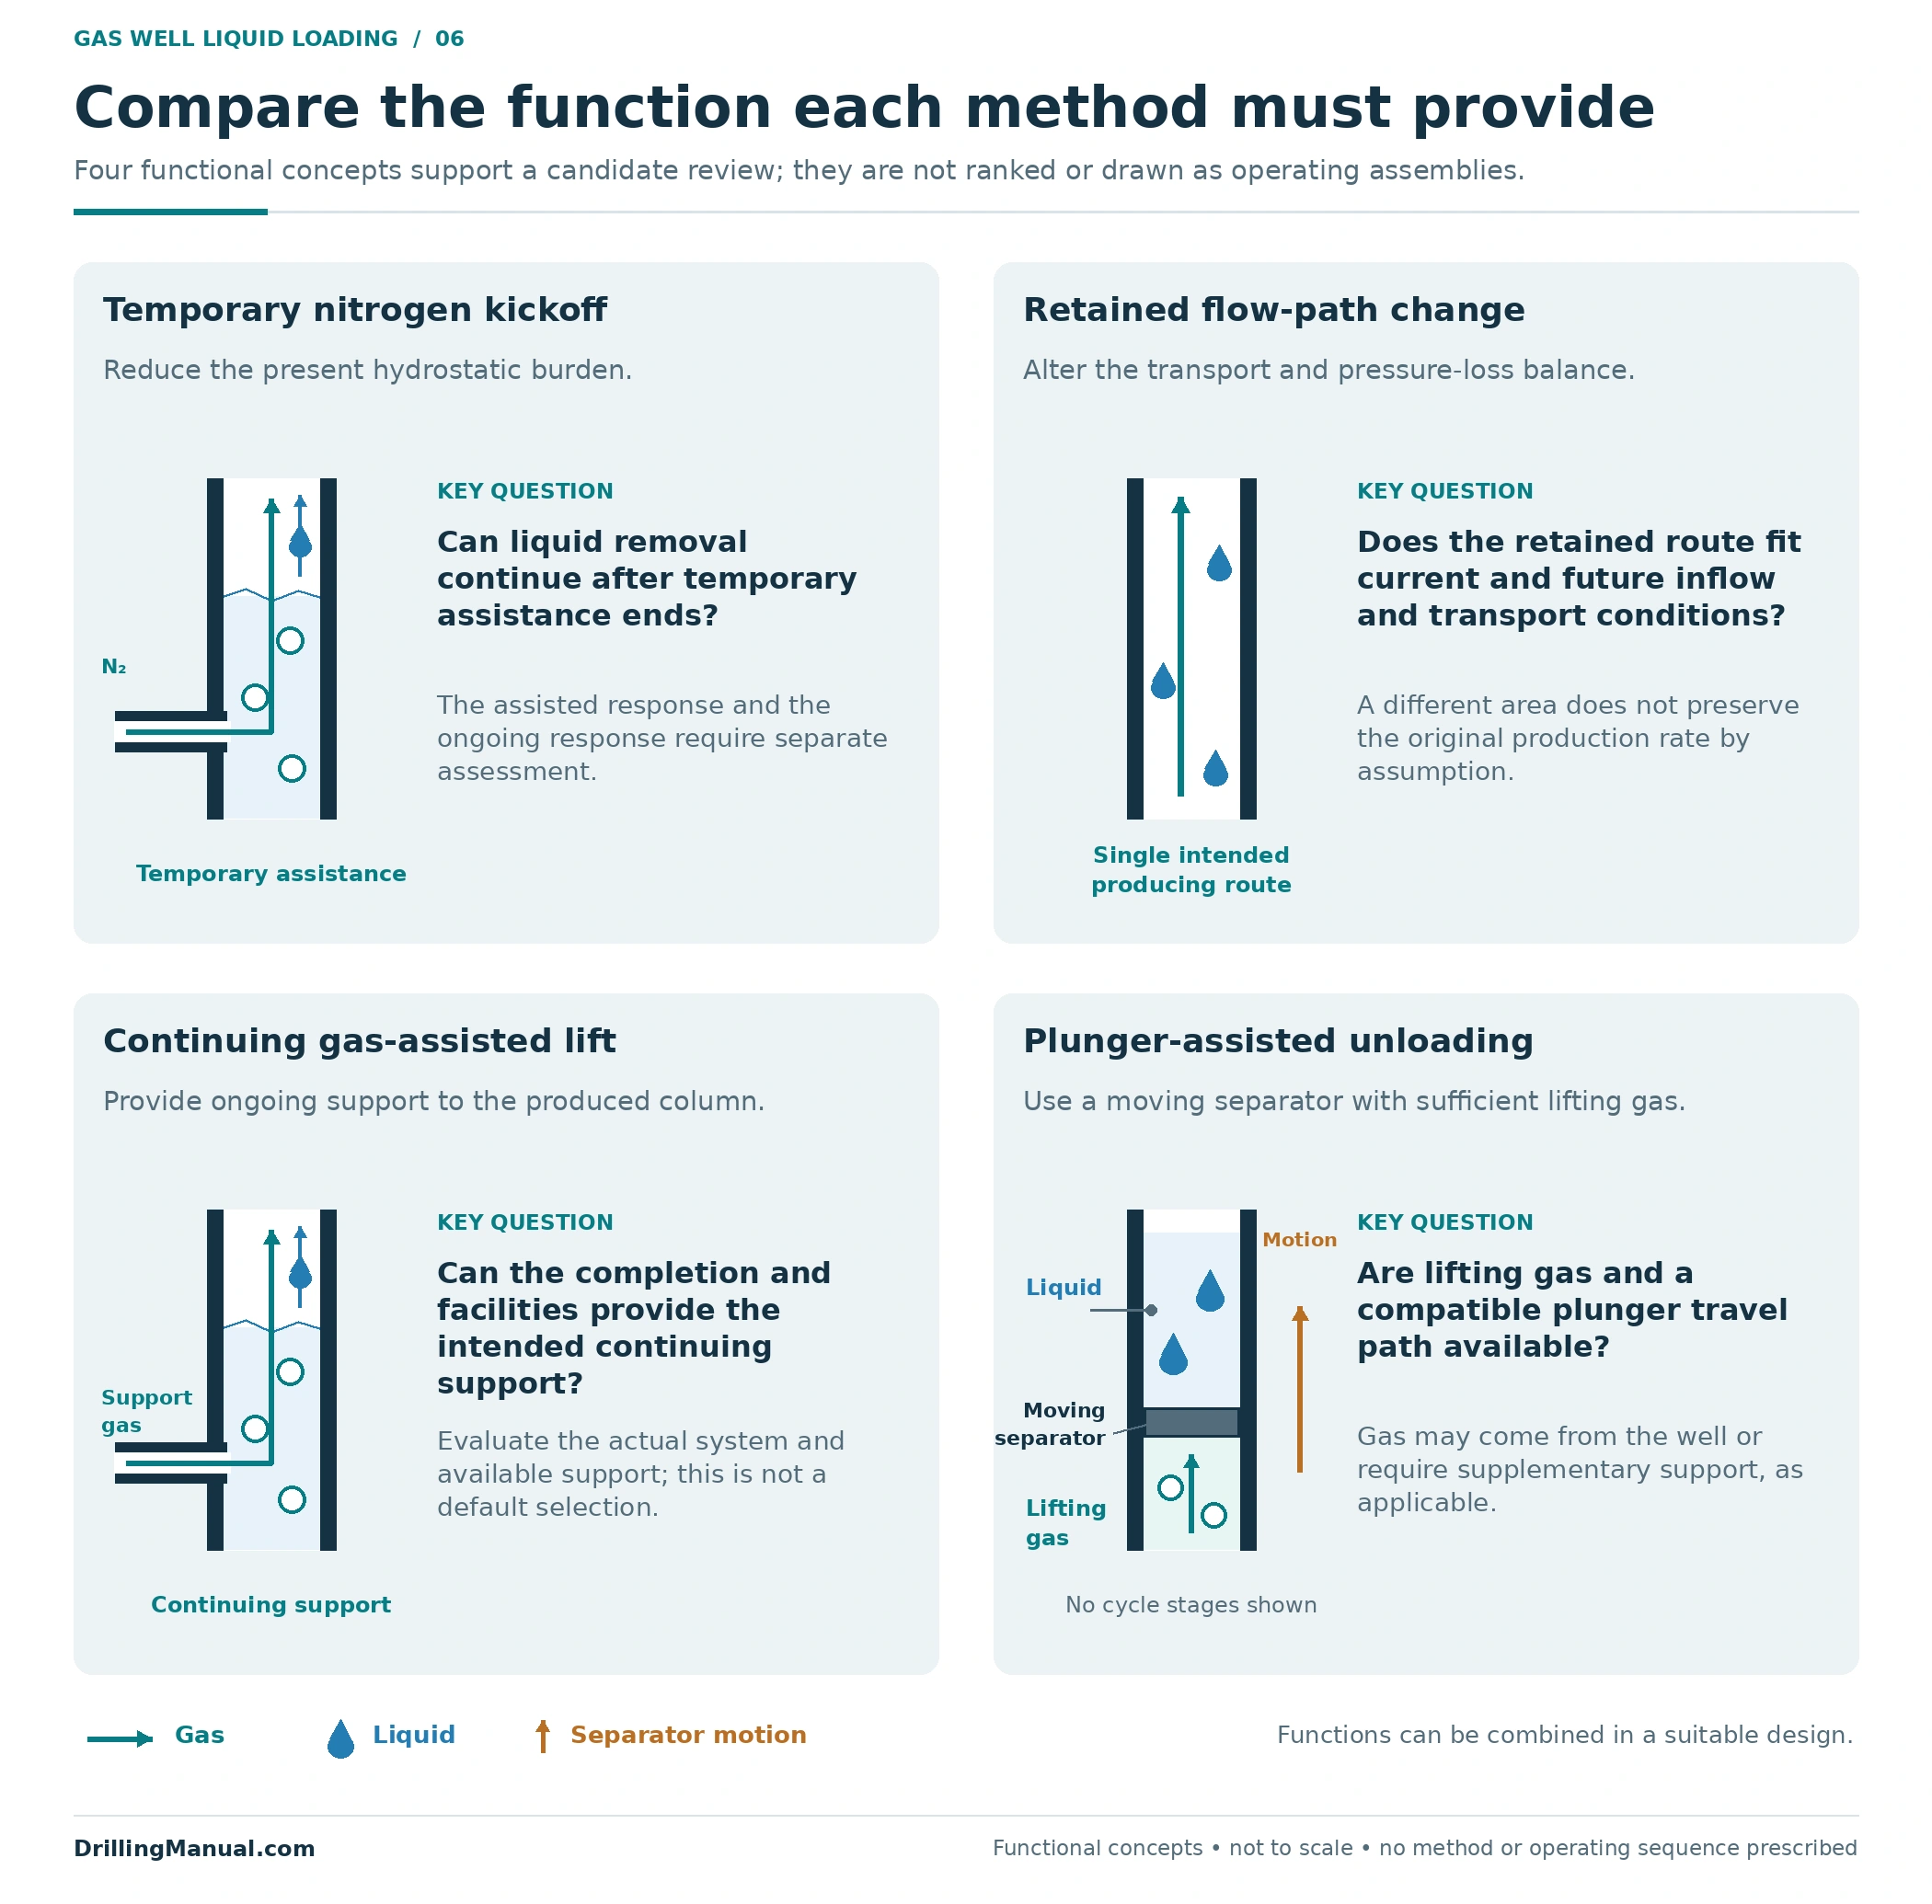
| Method family | Intended contribution | Question that controls further evaluation |
|---|---|---|
| Temporary nitrogen kickoff | Reduce an existing hydrostatic burden sufficiently to allow inflow | Can the well keep transporting its liquid after temporary assistance ends? |
| Retained flow-path change, such as a velocity string | Change the flowing cross-section to improve transport capability | Does the resulting inflow/outflow response provide useful transport without losing the benefit to friction or other constraints? |
| Continuing gas-assisted lift | Introduce gas into the fluid column to reduce its hydrostatic burden | Do the well, completion and available surface support suit the intended assisted-production arrangement? |
| Plunger-assisted unloading | Separate lifting gas from the liquid above the plunger to reduce fallback | Are the gas supply and completion configuration suitable, including any need for supplementary gas? |
The temporary-kickoff and flow-path rows follow the NOV CTES hydraulic discussion; continuing gas assistance follows the Schlumberger completion discussion; the plunger row follows Petroleum Well Construction. The existing gas-lift guide and plunger-lift guide provide the corresponding method detail. A link to a method is not a finding that the method suits the well being investigated. [1, pp. 10-31–10-34, 11-96] [2, pp. 4, 11] [3, pp. 641–642]
Where a velocity string fits
A smaller flowing area can increase velocity at a given local volumetric flow, which explains the attraction of a velocity string. However, the actual production rate does not have to remain unchanged after the path is altered. A smaller conduit also increases frictional resistance, and the coupled well response may deliver less gas. For gas well liquid loading, the hydraulic assessment therefore needs both the achievable production and the ability to remove liquid, including the effect of future depletion. Detailed string sizing is a separate design task. [1, pp. 10-31–10-34]
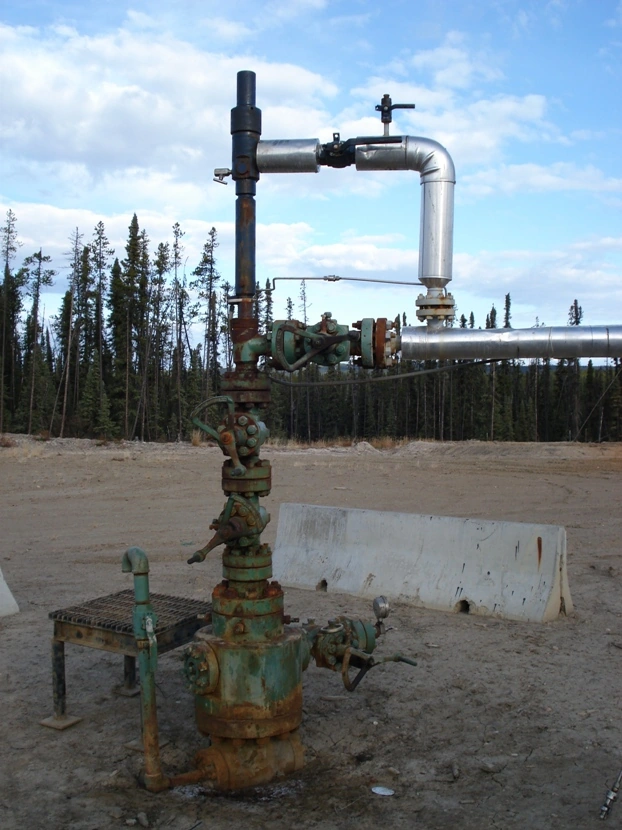
Photo: Wellhead-plunger lift — Dexcel / Wikimedia Commons, Public domain (author release). Converted from JPEG to WebP; native dimensions and original framing retained.

Build the evidence for a gas well liquid loading review
The candidate record should allow another reviewer to follow the explanation from observations to the proposed unloading function. It needs the existing production path and completion restrictions, the liquid history, the evidence for current inflow and outflow, the uncertainty that matters, and the surface support required by the candidate. The manuals identify these inputs across completion selection, hydraulic assessment and nitrogen-unloading evaluation. [1, pp. 10-33–10-34, 11-97] [2, pp. 4, 6–9]

For a retained completion change, the proposed flowing path must be explicit. Its relationship to restrictions, access, wellhead connections and required safety-valve functions needs its own assessment; installing a string does not automatically establish that the final arrangement performs every required function. The coiled-tubing guide provides general equipment context, while the workover operations overview places completion changes within the broader intervention scope. [2, pp. 4–5, 9]
Close the record with the expected ongoing response and the basis for comparing the alternatives over time. A technically plausible first response is only one consideration: future inflow, continued support, maintenance and operating cost can change the value of the selected arrangement. Record unresolved questions so that they remain visible at the selection decision. [1, pp. 10-33–10-34] [3, pp. 592–594]
Verify the ongoing response after unloading
When evaluating an intervention for gas well liquid loading, distinguish installation or initial restart from the subsequent production result. The Schlumberger manual calls for evaluation after flow has stabilized sufficiently to assess the completion. In practice, the evidence must also describe the intended production mode: an intermittently operating arrangement should be assessed through a representative response, not by demanding a perfectly flat instantaneous rate. No universal observation period follows from these sources. [2, p. 15] [3, pp. 641–642]
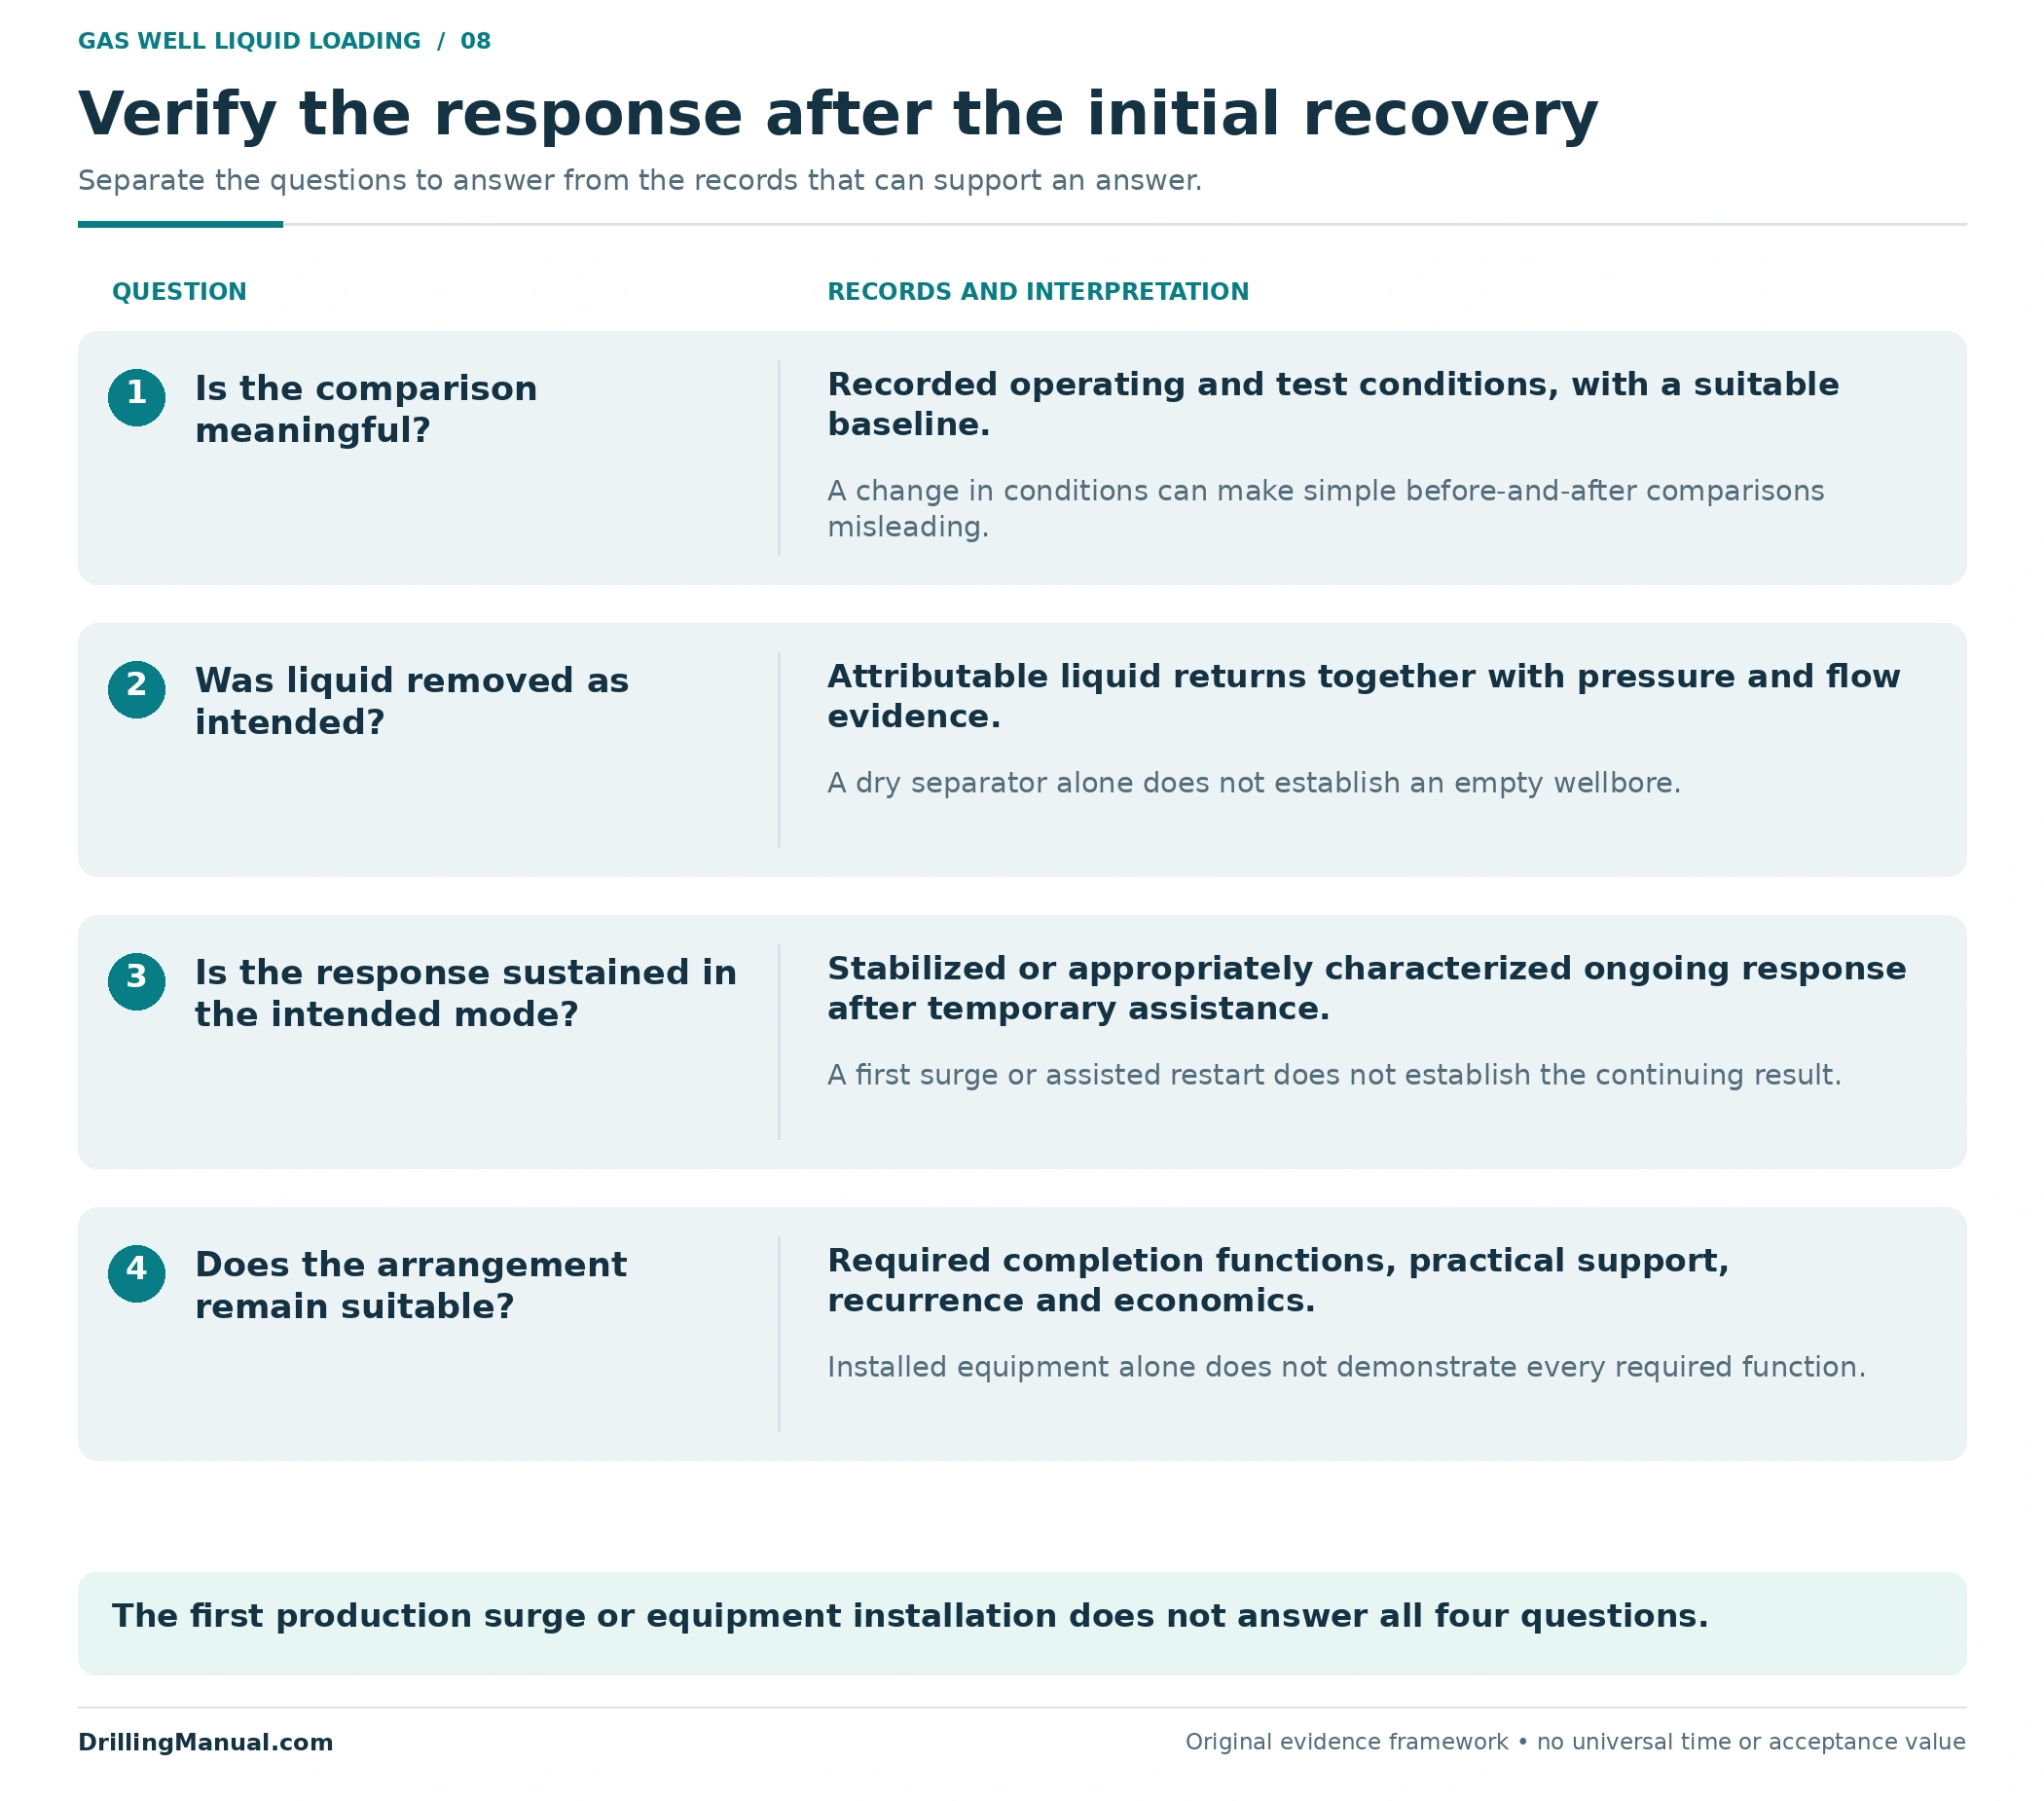
This original review framework asks four questions:
- Is the comparison meaningful? State the baseline, measurement basis, surface conditions and assistance present in each period.
- Does the combined evidence support improved liquid removal? Interpret liquid returns with pressure and flow behavior, rather than using either a liquid surge or a low surface liquid rate alone.
- Does the response continue in the intended mode? Separate temporary assistance from the subsequent production and characterize the behavior over an appropriate period.
- Does the arrangement remain suitable? Review its required functions, continuing support, recurrence of the problem and the economic result.
These questions combine the source guidance on history matching, completion compatibility, conditional post-kickoff flow and production evaluation. The outcome should describe what the evidence establishes and what remains uncertain. “The well restarted” is a narrower result than “the selected arrangement continues to remove liquid under the recorded conditions.” [1, pp. 10-33–10-34, 11-96] [2, pp. 7–9, 15] [3, pp. 592–594]
Gas well liquid loading: frequently asked questions
Does a declining gas rate prove liquid loading?
No. A changed trend is a reason to investigate. The diagnosis needs liquid history, pressure evidence and an assessment of reservoir inflow and the well’s outflow conditions. [2, pp. 6–8] [3, pp. 586–588]
Can gas well liquid loading occur with little liquid at surface?
Yes. The source manual describes wells whose gas cannot bring the liquid out, including from early production. Low measured liquid returns do not establish a small downhole inventory. [2, p. 6]
Can water and condensate both contribute?
Yes. Water, condensate and introduced well fluids may contribute, individually or in combination. Their origin should be assessed from the fluid and well history instead of inferred from the rate decline alone. [2, pp. 6–7]
What is the minimum gas rate needed to unload a well?
There is no single value established here. Local transport depends on the flow path and fluid properties under changing pressure and temperature, together with the rate that the coupled reservoir and well can deliver. A suitable model and well evidence are needed. [1, pp. 10-32–10-34]
Does a successful nitrogen kickoff solve the loading problem?
It may remove enough hydrostatic burden to restart inflow, but continued production after injection stops remains conditional. The later liquid-removal and production response must be evaluated separately. [1, p. 11-96]
Is the smallest possible tubing always best?
No. Reduced area can help transport, while increased friction can reduce achievable production. The balance must be evaluated with the well’s current and expected future inflow. [1, pp. 10-31–10-34]
When is plunger-assisted unloading worth investigating?
It is a candidate when using a moving separator between lifting gas and liquid addresses the intended unloading function. Available gas, any supplementary-gas requirement and completion compatibility must still support the arrangement; the mechanism alone does not establish suitability. [3, pp. 641–642]
What is stronger evidence of success than the first restart?
A documented response under stated conditions that supports the intended liquid removal and production mode, together with a functioning completion and a review of continuing support. Temporary assistance and subsequent performance should be identified separately. [1, p. 11-96] [2, pp. 9, 15]
Technical references
The technical discussion uses the following manuals and book chapters. Figures and review frameworks are original educational syntheses. The production-history numbers and qualitative response curves are illustrative, not field data or design limits. Photograph sources and reuse licences appear in their captions.
[1] NOV CTES, Coiled Tubing Manual. Inspected technical pages revised 27 June 2014; copyright 2007–2013 NOV CTES. Chapter 10, “CT Hydraulic Performance,” “Velocity String Hydraulics,” printed pp. 10-31–10-34 (PDF pp. 294–297); Chapter 11, “Pumping Operations,” “Unloading a Well with Nitrogen,” printed pp. 11-96–11-97 (PDF pp. 393–394).
[2] Schlumberger Dowell, Coiled Tubing Engineering Manual. Section 910, “Coiled Completions,” Rev A, September 1993. Relevant pp. 4–9, 11 and 15; printed and PDF page numbers coincide in the supplied 15-page section.
[3] Petroleum Well Construction, edited by Michael J. Economides, Larry T. Watters and Shari Dunn-Norman, John Wiley & Sons. Chapter 12, “Inflow Performance/Tubing Performance,” by Mohamed Soliman and Michael J. Economides, pp. 584–588; Chapter 13, “Artificial-Lift Completions,” by James F. Lea and Clark E. Robison, pp. 592–594 and 641–642. Visible and PDF page numbers coincide in the inspected sections.