The only way to obtain information, before well drilling, on the nature and characteristics of the subsurface, including the pore pressure prediction, is through geophysical prospecting. The seismic reflection method is the most important and extensively used geophysical method for oil prospecting. Although geophysicists and geologists use seismograms mainly for subsurface structural and lithological interpretation, they have recently become of great interest and help to the drilling engineer.
Pore Pressure Prediction While Planning
Offset Well Information
When planning a development or appraisal well, offset wells’ information can provide over-pressure indicators. Key information is:
- Formation Pressure measurements (e.g., RFT logs)
- Drill-speed logs – drillability should reduce with depth in shales (see later article on “d” exponent)
- Formation bulk density logs (compaction and thus bulk density should generally increase with depth in shales)
- Formation Fluid contact levels (OWC, GOC, GWC) – these tend to remain almost constant across a field (assuming the absence of sealing faults), and thus their depths, combined with formation depth estimates, can provide sufficient information to estimate formation pressure gradients along the proposed well path. Given that depth prognoses tend to have margins of error associated with them, it is normal to make pore pressure prediction estimates based on the worst reasonable case scenario (but not on the worst theoretically possible case). This is generally a combination of a reasonable estimate of the maximum reservoir height and a reasonable estimate of the maximum hydrostatic pressure.
We can use this data to estimate the pore pressures encountered in the new well to design casing scheme and drilling fluid program accordingly. However, we should check pressure data carefully to ensure that field production operations have not caused changes in the reservoir characteristics since drilling the source well.
Regional Geology
Because the majority of causes of overpressures are related to the depositional environment or history of the sedimentary rock, the pore pressure prediction of overpressures during well planning, in the absence of any offset well information (e.g., when drilling a wildcat well or first well in an area), relies on either looking for indications of sedimentary activity that has the potential to generate overpressures or, alternatively, extrapolating symptoms of overpressure that are visible at or near the surface to underlying formations. In common with hydrocarbons, often, the only way to determine if overpressures exist is to drill!
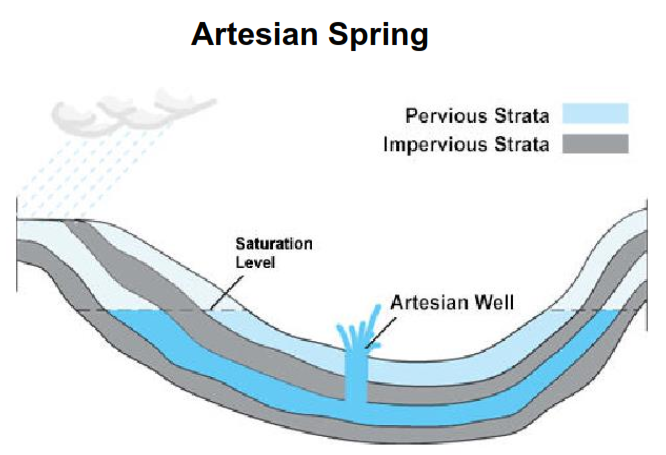
Complex studies of stratigraphic and hydrodynamic features have been conducted in some world areas. These can be useful for pore pressure prediction and identifying shallow overpressures caused by artesian flow conditions etc. but are less likely to yield information about overpressures in hydrocarbon-bearing formations. Studies into the depositional environment of an area may indicate the type of rapid burial that can lead to over-pressures. Mathematical modeling is being applied to sedimentation and burial to simulate the process of compaction and identify areas where overpressures may exist.
Geophysics
Generally, we rarely initiate exploration or appraisal drilling before the completion of seismic profiling of the area. With modern processing techniques, it is possible to identify characteristics in the survey that suggest the existence of over-pressured formations. Primarily they identify under-compacted material due to poor response or slow transit times. These techniques become more reliable when combined with log data from wells in the same province. We can compare actual sonic transit times in these wells to seismic data to identify where under compaction occurs.
Seismic surveys can help in pore pressure prediction and show the presence of geological features that cause overpressure, such as salt domes (causing formation distortions), growth faults (in areas of rapid burial), etc. In addition, the presence of gas can increasingly be suggested by seismic data; bright spots indicating high amplitude reflections from gas-filled (and so relatively low bulk density) formations are being identified on the seismic maps.
Pore Pressure Prediction & Warning Signs Whilst Drilling
It usually is possible to identify that the well is entering an area of overpressure before the latter manifests itself by a kick from a porous and permeable formation. To exist, we shall seal an overpressured formation, at least from above, by an impermeable layer. Consequently, a pressure gradient will exist across the impermeable layer, and the effects of this gradient provide warning signs. The nature of the impermeable layer is important; a skinny but extremely impermeable layer (such as salt and limestone) will not provide as many clues as one where the pressure gradient permeates the formation (e.g. shale). The formation where pressure moves from usually pressured is called the transition zone.
We will look at the following:
- Drilling Parameters
- Drilling fluid parameters
- Cuttings analysis
- Wireline logs & pore pressure evaluation & prediction
- Well seismic evaluation
Drilling Parameters
In general, the onset of abnormally pressured formations is associated with an increase in the drillability of the formation. This is a deviation from a general trend of reduced drillability with depth due to compaction, increased stresses, etc. Basically, this increase can manifest itself in two ways. In shale, where this shale is a pressure transition zone, the increase will be gradual, while when entering the overpressured reservoir itself, the increase will be more sudden. The latter is normally called a drilling break. We should consider that not all increases in the drilling rate result from increased formation pressure. It could simply have been the result of a change in lithology. However, we shall always investigate any unexplained increase in the drilling rate.
In D Exponent Article, we shall learn how to calculate it and why it helps predict pore pressure while drilling.
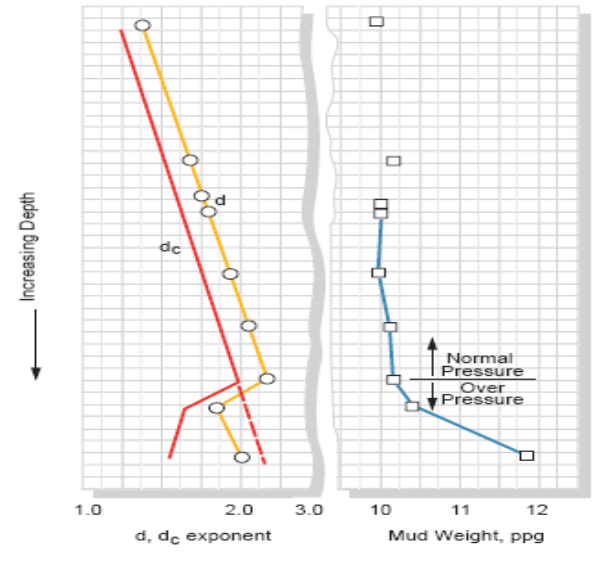
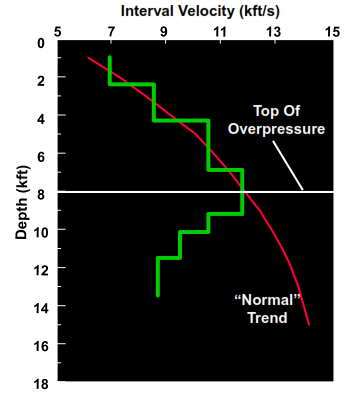
The d-exponent is generally used in pore pressure prediction to simply identify the top of overpressure zone.
Drilling Fluid Parameters For Pore Pressure Prediction
We can observe several indications in the drilling fluid returns. These, again, have to be assessed in conjunction with the drilling parameters and the drilling environment. Relevant parameters include:
Drilling Fluid Gas Levels
Ideally, we can measure the gas content of the drilling fluid crudely using stand-alone methane (CH4) meters or more sophisticated gas chromatographs (usually in Mud Logging units). The following parameters may be useful:
- Background gas levels (minimal gas in claystone/shale ) generally increase from ambient values when drilling into under-compacted shales.
- Gas shows (from the pores of gas-containing reservoir rock being drilled) will be apparent when a hydrocarbon reservoir is entered. The show’s degree depends on the rock’s pore pressure. Excessive gas shows suggest a minimal overbalance on the bottom.
- Trip / Connection gas may be observed due to slight reductions in bottom hole pressure due to a loss of the back pressure due to fluid friction in the annulus when the mud pumps are stopped, plus a swabbing effect whilst picking up to make a connection or when pipe tripping. Again, high readings tend to suggest minimal overbalance on the bottom.
- Gas composition from a gas chromatograph – a service offered by Mud Logging Units – can also provide indications of overpressures. In pore pressure prediction, the ratio of methane to ethane generally reduces as levels of ethane increase in transition zones or overpressured formations.
- H2S levels – The presence of increasing levels of H2S in the drilling fluid whilst drilling evaporites can also be an indication of the onset of overpressure
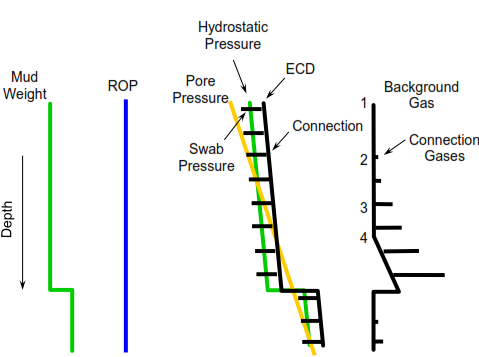
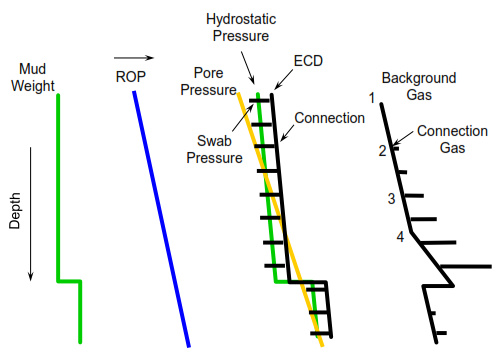
Drilling Fluid Density
Reductions in drilling fluid density may be caused by increased gas content or increasing water content. This may be observed in place of a higher volume well kick in low permeability formations.
Drilling Fluid Temperature
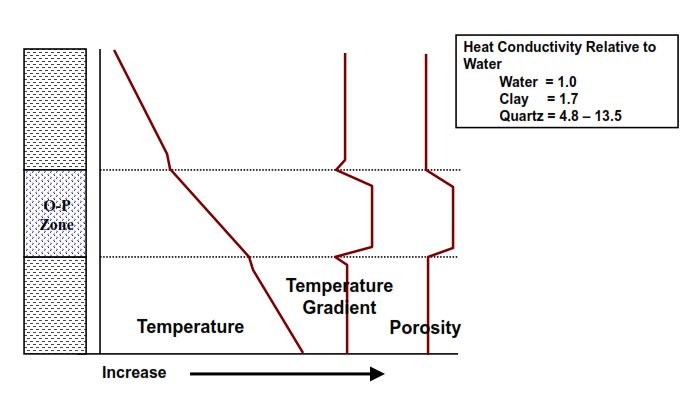
Temperature gradients (dT/dZ) in under-compacted formations tend to be greater than in normally compacted formations. Normally, the flow line temperature of the drilling fluid type, under conditions of uniform cooling, etc. should regularly increase with depth. If the increase deviates from the established pattern, it can indicate the onset of over-pressures. However, this effect is generally masked by changes in circulation rate, drilling fluid properties, tripping, and drilling riser cooling effects, particularly in deep water operations.
Drilling Fluid Resistivity
Associated with increased formation water content in the drilling fluid, this parameter can back up others, such as density, provided there is sufficient contrast in the salinity of the drilling fluid and formation water. Increased sulfur salts in the drilling fluid whilst drilling evaporites can indicate over-pressures.
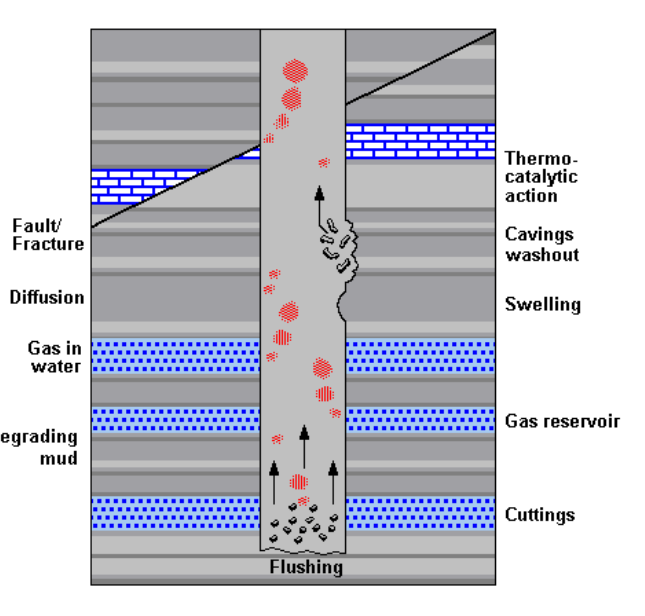
Hole Fill
Cavings may settle to the bottom of the hole during connections or trips, producing fill. This may be caused by wellbore instability from overpressured formations but could have other causes:
- Geomechanical instability
- Inefficient hole cleaning by the drilling mud
- Poor mud rheology
Cuttings Analysis
Careful analysis of drilling cuttings samples can provide warning signs of impending overpressure and make pore pressure prediction easier:
Shale Density
We can generally measure the shale density relatively easily at the well site by Mud-Loggers (Mud Logging Guide). In areas of under-compaction, the density will not increase with depth as fast as in usually pressured formations and may even decrease. Plotted against depth, this tool is helpful in areas of long shale sections.
Cation Exchange Capacity (CEC)
Shale comprises four different clay minerals, kaolinite, illite, montmorillonite, and smectite. The ratios of these minerals change with depth due to the transformation of smectite into illite with increased pressure and temperature. A simple test can be performed to estimate the amount of smectite in a sample of cuttings, and this value, when plotted against depth, should show a negative gradient. Deviation from this trend in a shale formation indicates entering a transition or overpressured zone.
Cuttings Shape, Size, and Abundance.
In general, as a transition or over-pressured zone is penetrated, increased borehole instability caused by a reduced drilling fluid pressure overbalance can lead to increased volumes of larger, more angular cuttings. This may be associated with other indications of borehole instability, such as over-pulls (Overpull Margin), etc. It is important to realize, however, that such features are not indicative in isolation as they can be caused by other factors such as tectonic stress, etc.
Wireline logs & Pore Pressure Prediction
Many logging tools used for petrophysical analysis can give indications of overpressured formations or transition zones, predominantly through identifying shale under compaction.
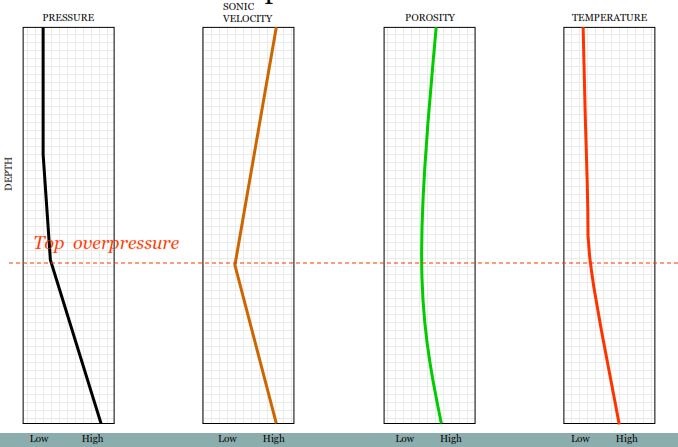
- Density: Under normal compaction conditions, shale density increases with depth. Consequently, a change in the density gradient can suggest a transition zone or overpressures.
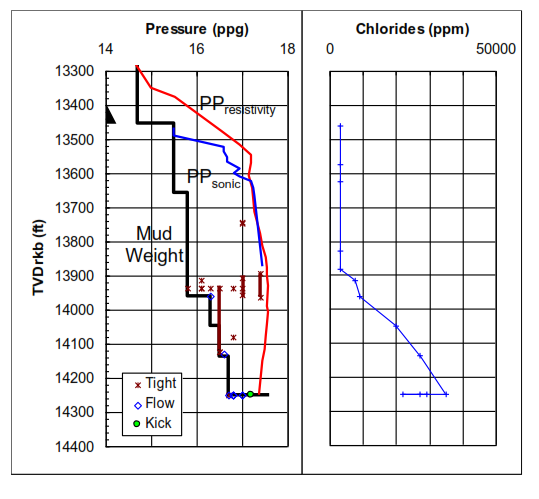
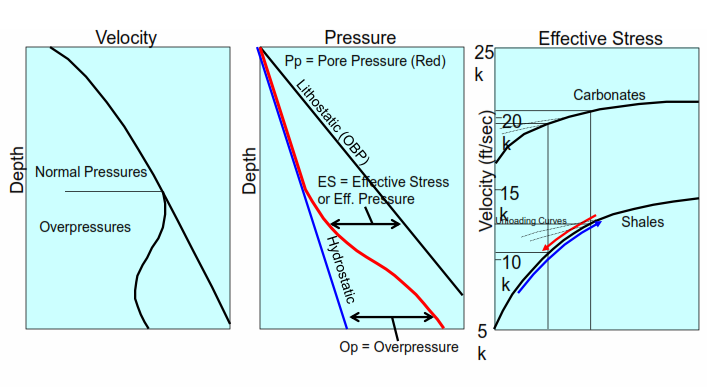
- Resistivity: Shale density and resistivity tend to increase with compaction and depth. Reductions in resistivity can indicate overpressures.
- Sonic: Sonic transit times reduce as density increases. Thus, an increase in the transit time can indicate overpressures.
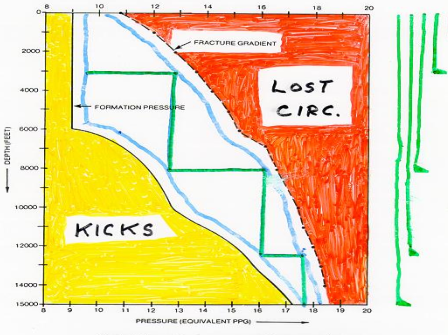
- Formation pressure: Ultimately, a series of formation pressure measurements will provide quantitative evidence of the existence of over-pressures. However, these require porous, permeable formations and cannot give warning of the existence of a transition zone.
Well seismic evaluation
Seismic check shots or a Vertical Seismic Profile can be conducted in the well, and the time/depth data used to correct the original seismic interpretations, which may have been based on assumed velocities in various rock formations. These corrections can assist in more accurately predicting the depth of deeper sites of under-compaction and, thus, possible overpressure.